Cost Optimization
Overview
The Cost Optimization Pillar focuses on integrating financial accountability and cost awareness throughout the cloud platform lifecycle. It involves establishing principles, gaining visibility into spending, implementing controls, and continuously optimizing resources to align cloud costs with business value. This pillar is essential for financial stakeholders, cloud architects, and engineering teams seeking to maximize return on investment in cloud infrastructure.
Principles
Business impact: Align cost with business value
Connect cloud spending directly to business outcomes, ensuring that every dollar spent in the cloud contributes meaningfully to strategic objectives and demonstrable value. Embed cost considerations directly into platform planning and architecture considerations.
Visibility: Understand & contextualize your consumption footprint
You can neither control nor optimize what you can't see. Gain deep and granular insight into all aspects of your cloud spending, fostering transparency, and attributing costs effectively.
Control: Establish guardrails and governance
Establish policies and mechanisms to govern resource provisioning and consumption, preventing unnecessary costs and enforcing financial boundaries.
Optimize: Maximize efficiency and value
Continuously improve the efficiency of your resources and workloads to maximize the value derived from your platform investment.
Recommendations
The following key recommendations are covered within each principle of Cost Optimization:
-
Business Impact
-
Consider cost as a design constraint: Integrate cost considerations into the architecture and design process from the very beginning, making it a key non-functional requirement alongside performance, security, and reliability.
-
Quantify value: Develop metrics to quantify the business value delivered by cloud resources (e.g., revenue per Snowflake Credit, cost per customer, efficiency gains).
-
Trade-off analysis: Understand the inherent trade-offs between cost, performance, reliability, and security, and make informed decisions that align with business priorities.
-
Measure business value KPIs baseline: Once metrics to quantify business value are identified and trade-offs between cost, performance, and reliability are established, you need to document a “baseline measurement” in order to track progress again. Furthermore, you should establish a regular cadence for refreshing this measurement to ensure value realization is in line with expectations and business goals.
-
-
Visibility
-
Understand Snowflake’s resource billing models: Review Snowflake’s billing models to align technical and non-technical resources on financial drivers and consumption terminology.
-
Establish a consistent and granular cost attribution strategy: Implement robust and organizationally consistent tagging and labeling strategies across all resources (storage objects, warehouses, accounts, queries) to accurately allocate costs to specific teams, products, or initiatives.
-
Embed cost accountability into your organization's DNA: Implement a feedback system to transparently show or charge back cloud costs to relevant business units or teams, increasing accountability.
-
Deliver clear, historical consumption insights: Utilize consistent in-tool visualizations or custom dashboards to monitor consumption and contextualize spend on the platform with unit economics.
-
Investigate anomalous consumption activity: Review anomaly detection to identify unforeseen cost anomalies and investigate cause and effect trends.
-
-
Control
-
Proactively monitor all platform usage: Define and enforce budgets for projects and services, setting soft quotas to limit resource consumption and prevent runaway spending.
-
Forecast consumption based on business needs: Establish a forecast process to project future spend needs based on business and technical needs.
-
Enforce cost guardrails for organizational resources: Set up automated checks (e.g., Tasks, query insights) and resource guardrails (e.g., warehouse timeout, storage policies, resource monitors) to identify unusual usage patterns and potential overspending as they occur.
-
Govern resource creation and administration: Establish clear guidelines and automated processes for provisioning and maintaining resources, ensuring that only necessary and appropriately sized resources are deployed (e.g., warehouse timeout, storage policies, resource monitors).
-
-
Optimize
-
Compute workload-aligned provisioning: Continuously monitor resource health metrics to resize and reconfigure to match actual workload requirements.
-
Leverage managed services: Prioritize fully managed Snowflake services (e.g., Snowpipe, Auto-clustering, Query Acceleration Service) to offload operational overhead and often achieve better cost efficiency.
-
Data storage types & lifecycle management: Utilize appropriate storage types and implement appropriate storage configuration to right-size workloads to your storage footprint. Move data to cheaper tiers or delete it when no longer needed.
-
Workload & architectural optimization: Leverage architectural decisions for cost-optimized resource utilization while meeting business needs.
-
Limit data transfer: Move, secure, and back up the appropriate footprint across cloud regions.
-
Improve continually: As new capabilities or usage patterns emerge, establish a consistent testing framework to identify areas for cost efficiency.
-
Business Impact
Overview
To maximize organizational outcomes, Snowflake consumption must be explicitly tied to business value. While cost optimization ensures efficiency, it does not guarantee that spend is aligned with outcomes that matter to stakeholders. Alignment of business value to cost ensures workloads, pipelines, dashboards, and advanced analytics are continuously evaluated not only for cost but also for the value they deliver. This approach ensures Snowflake delivers as a strategic business platform rather than a technical expense.
Recommendations
Business value to cost alignment represents a maturity step in FinOps on Snowflake. By embedding benchmarking, impact analysis, SLA definition, usage metrics, ROI measures, and business impact evaluation into daily operations, organizations can ensure that Snowflake consumption is continuously justified, optimized, and communicated in business terms. This elevates the conversation with leadership from cost oversight to value realization and ensures that Snowflake is understood as a platform for growth, innovation, and competitive advantage.
Consider cost as a design constraint
Cost-Aware Architecting is the practice of embedding financial accountability directly into the design and development of Snowflake workloads. By shifting left—introducing cost considerations early in the architecture lifecycle—organizations ensure that ingestion, transformation, analytics, and distribution workloads are not only performant but also aligned with budget expectations. Many cost overruns in Snowflake originate from architectural decisions made without cost implications in mind.
For example, designing ingestion with sub-second latency when daily freshness is sufficient, or selecting inefficient table designs that increase query scanning. These can lead to disproportionate spend. Shifting cost awareness into architecture helps prevent inefficiencies before they occur and reinforces Snowflake’s role as a cost-effective enabler of business value.
At the ingestion layer, best practices include balancing latency versus cost by selecting appropriate services (e.g., Snowpipe, Snowpipe Streaming, or third-party tools) and choosing the right storage format (e.g., native tables, Iceberg). For transformations, design with frequency versus SLA in mind to ensure data freshness matches the business need. For analytics, apply schema design best practices such as thoughtful clustering key choices and pruning strategies to reduce consumed credits. In distribution, optimize data transfer by monitoring egress patterns and applying cost-saving practices like the Snowflake Data Transfer Optimizer.
Quantify value
To maximize organizational outcomes, Snowflake consumption must be explicitly tied to measurable business value and clearly communicated in terms that resonate with stakeholders. Establishing baselines using Snowflake’s Account Usage views creates a reference point, while tracking the current state highlights trends in performance and consumption. Defining explicit goal states—such as reduced cost per decision, improved time-to-market, or broader data access—ties workloads directly to outcomes that matter to stakeholders. Outliers that diverge from these goals should be flagged for review and optimization to prevent wasted resources. Best practices include applying unit economic measures related to your field (e.g. cost per terabyte analyzed or cost per fraud case prevented) and publishing ROI dashboards that continuously link Snowflake consumption to business outcomes. By incorporating measurement into daily operations, organizations can move the conversation with leadership from cost oversight to demonstrable value realization, positioning Snowflake as a clear enabler of enterprise growth and innovation.
Trade-off analysis
Defining SLAs or explicit business needs ensures that Snowflake workloads are aligned with their intended purpose and that consumption levels are justified by business outcomes. Some Snowflake workloads can become over-engineered or maintained without clear justification. Tying each workload to an SLA or business requirement prevents waste and ensures that investment aligns with value. Before implementation, it is crucial to document and align on the value of meeting an SLA, identifying all stakeholders who rely on the workload. This includes differentiating between tangible outcomes, such as increased revenue, and intangible outcomes, such as compliance or data trust. Efficient customers use both Snowflake Resource Monitors and Budgets features to enforce guardrails that ensure workloads remain within acceptable cost-performance boundaries. All design decisions have trade-offs, and explicitly calling out the expected outcomes leads to streamlined decision-making in the future when outcomes are reviewed.

Measure business value KPIs baseline
Benchmarking establishes performance and cost baselines for Snowflake workloads and compares them against internal standards as well as performance and cost results from previous tech solutions. These benchmarks can measure workload efficiency, the adoption of specific Snowflake features, and the alignment of workload costs to business outcomes. Without benchmarks, organizations lack the context to determine if their Snowflake consumption is delivering economies of scale or value back to the business. Benchmarking allows teams to identify best practices, track improvements over time, and highlight outliers that may be driving unnecessary spend or delivering unexpected value.
Best practices include measuring technical unit economic metrics (e.g. credits per 1K queries, credits per 1 TB scanned), warehouse efficiency and utilization by workload type, and business unit economics (e.g. credits per customer acquired, credits per partner onboarded, or credits per data product-specific KPIs). This provides a more comprehensive picture of consumption in relation to cost and value. Outliers should be highlighted in executive communications as either success stories or cautionary examples. Benchmarking should be embedded in a continuous improvement loop, where insights drive action, action improves efficiency, and those improvements are effectively measured.
Visibility
Overview
The Snowflake Visibility principle is designed to transform opaque cloud spending into actionable insights, fostering financial accountability and maximizing business value within your Snowflake environment. It is foundational to the FinOps framework, as you cannot control, optimize, or attribute business value to what you cannot see. To effectively manage and optimize cloud costs in Snowflake, it's crucial to align organizationally to an accountability structure of spend, gain deep and granular insight into all aspects of your cloud spending, and transparently display it to the appropriate stakeholders to take action.
Recommendations
Implementing a robust FinOps visibility framework in Snowflake, supported by cross-functional collaboration, enables each business function to access timely and relevant usage and cost data. This empowers them to understand the business impact of their consumption and take prompt action when anomalies arise. To meet this vision, consider the following recommendations based on industry best practices and Snowflake's capabilities:
Understand Snowflake’s resource billing models
It is essential to review Snowflake's billing models to align technical and non-technical resources on financial drivers and consumption terminology. Snowflake's elastic, credit-based consumption model charges separately for compute (Virtual Warehouses, Compute Pools, etc), storage, data transfer, and various serverless features (e.g., Snowpipe, Automatic Clustering, Search Optimization, Replication/Failover, AI Services). Understanding the interplay of these billing types ensures you can attribute costs associated with each category’s unique usage parameters. High-level categories are below.
-
Compute (Virtual Warehouses, Snowpark Container Services, Openflow): This is often the most dynamic and largest portion of Snowflake spend. Virtual Warehouses are billed per-second after an initial 60-second minimum when active, with credit consumption directly proportional to warehouse size (e.g., an “X-Small” Gen1 warehouse consumes one credit per hour, a 'Small' consumes two credits per hour, doubling with each size increase) while SPCS (via compute pools) are billed for all uptime with a minimum of five minutes. Openflow is billed per second of runtime with a 60-second minimum.
-
Storage: Costs are based on the average monthly compressed data volume stored, including active data, Time Travel (data retention), and Fail-safe (disaster recovery) data. The price per terabyte (TB) varies by cloud provider and region.
-
Serverless features: Snowflake Serverless features use resources managed by Snowflake, not the user, which automatically scale to meet the needs of a workload. This allows Snowflake to pass on efficiencies and reduce platform administration while providing increased performance to customers. The cost varies by feature and is outlined in Snowflake’s Credit Consumption Document.
-
Cloud services layer: This encompasses essential background services, including query compilation, metadata management, information schema access, access controls, and authentication. Usage for cloud services is only charged if the daily consumption of cloud services exceeds 10% of the daily usage of virtual warehouses.
-
AI features: Snowflake additionally offers artificial intelligence features that run on Snowflake-managed compute resources, including Cortex AISQL functions (e.g. COMPLETE, CLASSIFY, etc.), Cortex Analyst, Cortex Search, Fine Tuning, and Document AI. The usage of these features, often with tokens, are converted to credits to unify with the rest of Snowflake’s billing model. Details are listed in the Credit Consumption Document.
-
Data transfer: Data transfer is the process of moving data into (ingress) and out of (egress) Snowflake. This generally happens via egress on cross-region data replication, copying into/out of stage, function calls, and cross/same region SPCS data transfer. Depending on the cloud provider and the region used during data transfer, charges vary.
-
Data sharing & rebates: Snowflake offers an opt-out Data Collaboration rebate program that allows customers to offset credits by data consumed with shared outside organizations. This rebate is proportional to the consumption of your shared data by consumer Snowflake accounts. See the latest terms and more details here.
Establish a consistent and granular cost attribution strategy
Implementing robust and organizationally consistent tagging and labeling strategies across all resources (e.g. storage objects, warehouses, accounts, queries) is crucial to accurately allocate costs to specific teams, products, or initiatives and linking actions to outcomes.
Tagging in Snowflake
Tagging can be done at several levels:
-
Snowflake object tagging: Snowflake allows you to apply object-level tags (key-value pairs) to accounts, warehouses, databases, schemas, users, tables, and more. These tags are fundamental for apportioning costs across departments, environments (dev, test, prod), projects, or lines of business. Tags can also support inheritance and propagation, simplifying tagging across dependent objects. For example, instead of tagging each individual table underneath a schema, tagging the schema will cause all tables to inherit the tag of the schema. This significantly reduces the manual effort required for tagging and ensures that new objects created within a tagged schema or propagated workflow automatically inherit the correct cost attribution. Snowflake strongly recommends tags for warehouses, databases, tables, and users to enable granular cost breakdowns. You can use the TAG_REFERENCES view in SNOWFLAKE.ACCOUNT_USAGE to combine with common usage views like WAREHOUSE_METERING_HISTORY and TABLE_STORAGE_METRICS to allocate usage to relevant business groups. Object Tags are best utilized when Snowflake objects are not shared across cost owners.
-
Query tags for granular workload attribution: Query tags can be set via session parameters (e.g., ALTER SESSION SET QUERY_TAG = 'your_tag';) or directly within SQL clients or ETL tools. This associates individual queries with specific departments, projects, or applications, even when using shared warehouses. This is extremely valuable for shared warehouses where multiple teams or applications use the same compute resource, allowing for granular showback. It is also easy to programmatically make changes to query tags within scripts or processes to allocate costs appropriately. Query tags can be found in the QUERY_HISTORY view of the SNOWFLAKE.ACCOUNT_USAGE schema.
Tagging models
In the initial setup of a business unit or use case, it is important to consider the model for tagging costs within the platform via shared or dedicated resources. These fall into three large buckets:
-
Resources used exclusively by a single cost center or department: An example of this is using object tags to associate warehouses with a department. You can use object tags to attribute the costs incurred by those warehouses to that department entirely.
-
Resources shared by users from multiple departments: An example of this is a warehouse shared by users from different departments. In this case, you use object tags to associate each user with a department. The costs of queries are attributed to the users. Using the object tags assigned to users, you can break down the costs by department.
-
Applications or workflows shared by users from different departments: An example of this is an application that issues queries on behalf of its users. In this case, each query executed by the application is assigned a query tag that identifies the team or cost center of the user for whom the query is being made.
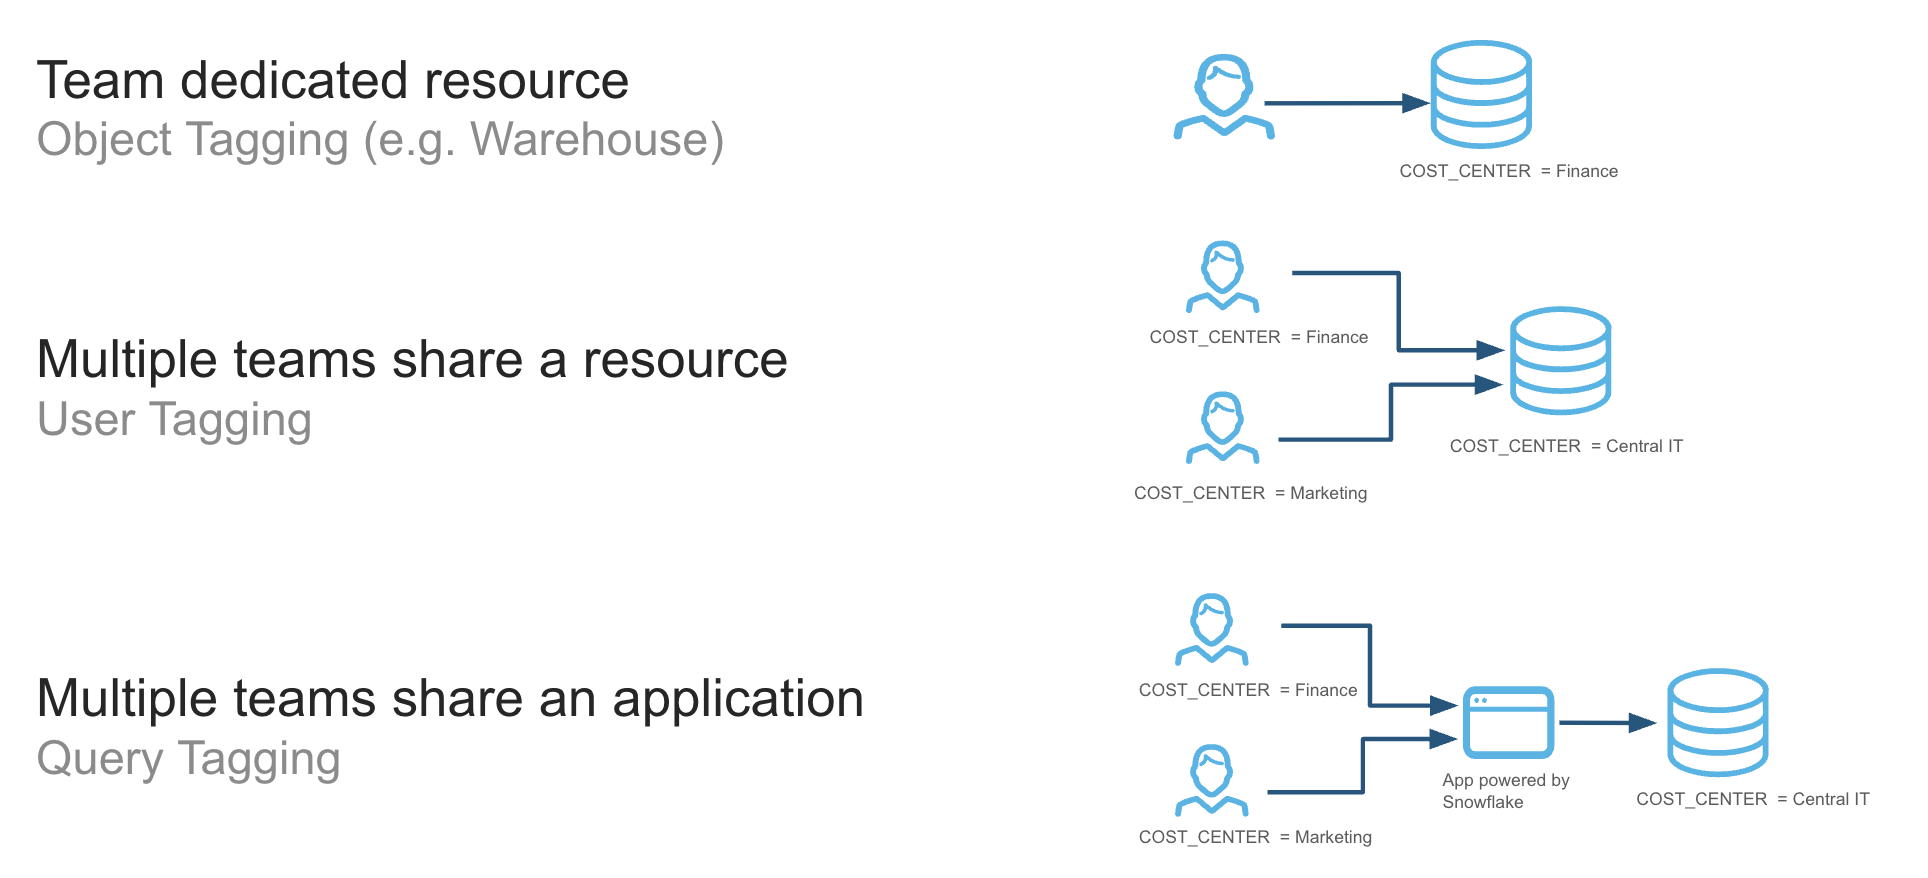
Each model has its pros and cons, including how to handle concepts such as idle time or whether to show/charge back attributed or billed credits. Review each model before deploying resources. If an organization is caught between models, a common approach is to start in a shared resource environment and graduate to dedicated resources as the workload increases.
Tag enforcement
Clear and consistent naming conventions for accounts, warehouses, databases, schemas, and tables facilitate immediate cost understanding. Enforcing robust tagging policies (e.g., requiring specific tags for new resource creation and using automated scripts to identify untagged resources) is crucial for accurate data interpretation and effective cost management. Without tag enforcement, it is difficult to accurately allocate all costs and can require manual effort, like extensive tag-mapping tables. Tag values are enforced within an account, but if a multi-account strategy is needed for your organization, a tag database can be replicated and leveraged across all accounts to ensure consistent values are used. For best-in-class visibility, it is recommended to have a tagging strategy and tag all resources in an organization to allocate costs to relevant owners.
Embed cost accountability into your organization's DNA
To effectively manage Snowflake spend and align business structure to technical resources, you should implement a system of showback or chargeback. This approach is crucial for promoting accountability and optimizing resource usage as there is a single owner for each object within the platform.
Showback
If cost accountability models have not been implemented previously, consider a showback model. This involves transparently reporting Snowflake costs to different departments or projects to raise awareness of their costs. By showing each team their monthly consumption (broken down by warehouse usage, query costs, and storage, etc.), it encourages a cost-conscious culture. This initial step helps teams understand the financial impact of their actions without the immediate pressure of budget cuts. Tools like Snowflake's built-in Cost Management UI & budget views, third-party cost management platforms, or custom dashboards can be used to provide these reports.
Chargeback
For more financially mature organizations, a chargeback model can be very effective for managing costs. This system directly bills departments for their Snowflake usage. This creates a powerful financial incentive for teams to optimize their workloads. To make this transition smooth and fair, you need to define clear rules for cost allocation. By implementing chargeback, you turn each department into a financial stakeholder, encouraging them to right-size their warehouses, suspend them during idle periods, and write more efficient queries. This shift in accountability leads to a more disciplined and cost-effective use of your Snowflake environment.
In either case, having a centralized dashboard or visual for all organizations to review intra-period is critical for financial accountability and next-step actions.
Deliver clear historical consumption insights
The most mature FinOps customers are those who programmatically and strategically drive consumption insights across the business. This involves three core elements:
-
Platform cost tracking: Pinpoint specific Snowflake credit consumption (compute, storage, serverless, AI, and data transfer), usage patterns, and efficiency opportunities to deconstruct credit usage, understand drivers, identify anomalies, and (eventually) drive forecasting operations.
-
Normalization of consumption: Once consumption has been attributed and aggregated to meaningful levels, normalizing it against relevant business and technical metrics contextualizes it in relation to organizational goals. It allows for the natural growth and seasonality of platform usage to be put into context with business and technical demand drivers.
-
Clear reporting: Presenting Snowflake cost data in an understandable format for various stakeholders is vital. This enables budgeting, forecasting, KPIs, and business value metrics directly tied to Snowflake credit consumption.
Track usage data for all platform resources
To deliver clear and actionable consumption insights, it is essential to leverage the rich usage data that Snowflake natively provides. The foundation for all cost visibility is the SNOWFLAKE database, which contains two key schemas for this purpose: ACCOUNT_USAGE (for granular, account-level data) and ORGANIZATION_USAGE (for a consolidated view across all accounts).
| Metric Category | Description | Key Metrics | Primary Data Sources |
|---|---|---|---|
| Compute & query metrics | Understand the cost of query execution, warehouse consumption, and overall compute health. These are often the most dynamic and largest portion of your spend. | - Credits used: total credits by warehouse - Query performance: execution time, bytes scanned, compilation time, parameterized query hash - Warehouse health: % idle time, queueing, spilling, concurrency | - ACCOUNT_USAGE.WAREHOUSE_METERING_HISTORY (hourly warehouse credit usage)- ACCOUNT_USAGE.QUERY_HISTORY (detailed query metrics and associated warehouses) |
| Storage metrics | Costs for compressed data, including active data, Time Travel, and Fail‑safe. | - Storage volume (avg monthly compressed GB/TB) - Inactive storage (Time Travel, Fail‑safe) - Storage growth rates - Table access (stale/unused) | - ACCOUNT_USAGE.TABLE_STORAGE_METRICS- ACCOUNT_USAGE.DATABASE_STORAGE_USAGE_HISTORY- ACCOUNT_USAGE.ACCESS_HISTORY |
| Serverless & AI metrics | Track credit consumption by Snowflake‑managed services and AI features. | - Credits used by service - Cost per credit‑consuming events | - ACCOUNT_USAGE.<Serverless Feature>_HISTORY- ORGANIZATION_USAGE.METERING_DAILY_HISTORY- AI views such as CORTEX_FUNCTIONS_USAGE_HISTORY, CORTEX_ANALYST_USAGE_HISTORY, DOCUMENT_AI_USAGE_HISTORY |
| Data transfer | Cost of moving data into (ingress) and out of (egress) Snowflake, especially cross‑region/cloud. | - Bytes transferred - Transfer cost by destination - Replication vs. egress | - ACCOUNT_USAGE.DATA_TRANSFER_HISTORY- ORGANIZATION_USAGE.DATA_TRANSFER_DAILY_HISTORY |
| Financial metrics | Translate credits to currency and provide org‑wide spend view. | - Overall dollar spend (daily) - Spend by service type | - ORGANIZATION_USAGE.USAGE_IN_CURRENCY_DAILY- ORGANIZATION_USAGE.RATE_SHEET_DAILY |
Normalize consumption with unit economic metrics
For organizations to achieve comprehensive financial visibility, it is recommended best practice to move beyond tracking aggregate spend and implement Unit Economics Metrics. Unit economics provides a powerful methodology for normalizing cloud consumption by tying platform costs to specific business or operational drivers. This per-unit approach helps you understand cost efficiency, measure the ROI of your initiatives, and make data-driven decisions about resource allocation and optimization. By translating abstract credit consumption into tangible metrics, you can empower technical and business teams with a shared language for discussing value and cost. These metrics are commonly tracked across time to show changes in efficiency or business impact.
Efficiency metrics (technical KPIs)
Efficiency Metrics are technical Key Performance Indicators (KPIs) that connect cloud costs directly to platform operations and workloads. They are crucial for engineering teams and platform owners to identify inefficiencies, optimize resource usage, and understand the cost drivers of the data platform itself. These metrics provide the granular, operational view needed to manage the platform's performance day-to-day. Some common examples include:
-
Cost per 1000 executable queries: Determines the average cost for a batch of one thousand queries. This metric is useful for understanding the overall cost profile of analytical activity on the platform and, when trended, how efficiency has changed across time.
-
Cost per TB scanned: Represents the average scanning cost of data. This metric can help understand the cost implications of table configuration (data ordering/clustering keys, Search Optimization) and query efficiency.
-
Cost per user: Measures the average cost to support each active user on the platform. This helps in understanding the cost implications of user growth and identifying expensive usage patterns.
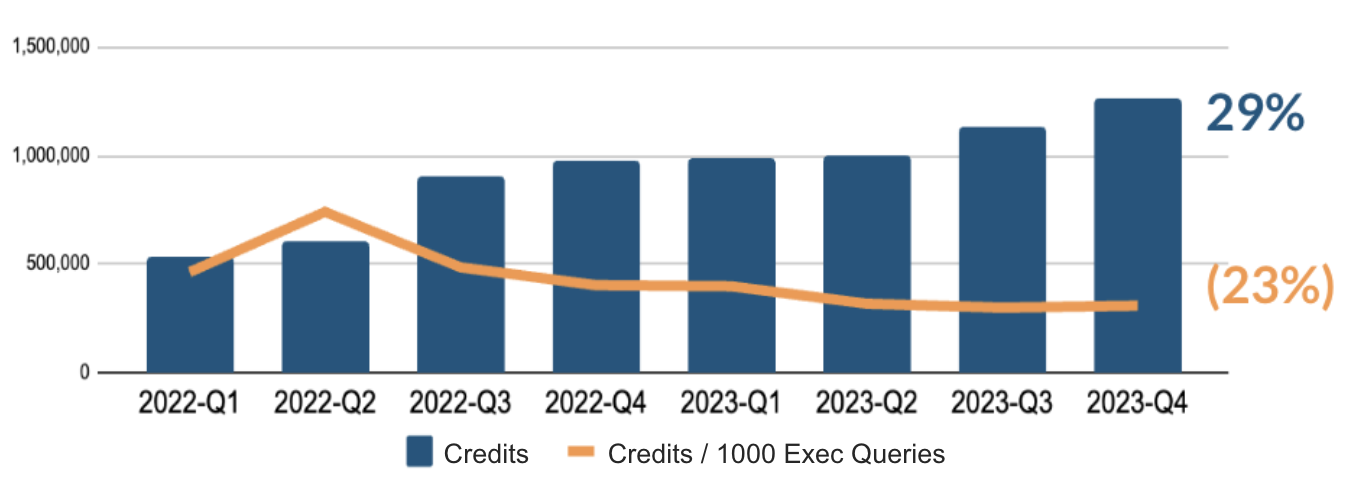
Customers can track credits (warehouse) per thousand queries within a use case to see how efficiency has evolved over time and determine if they are achieving economies of scale.
Business metrics (business KPIs)
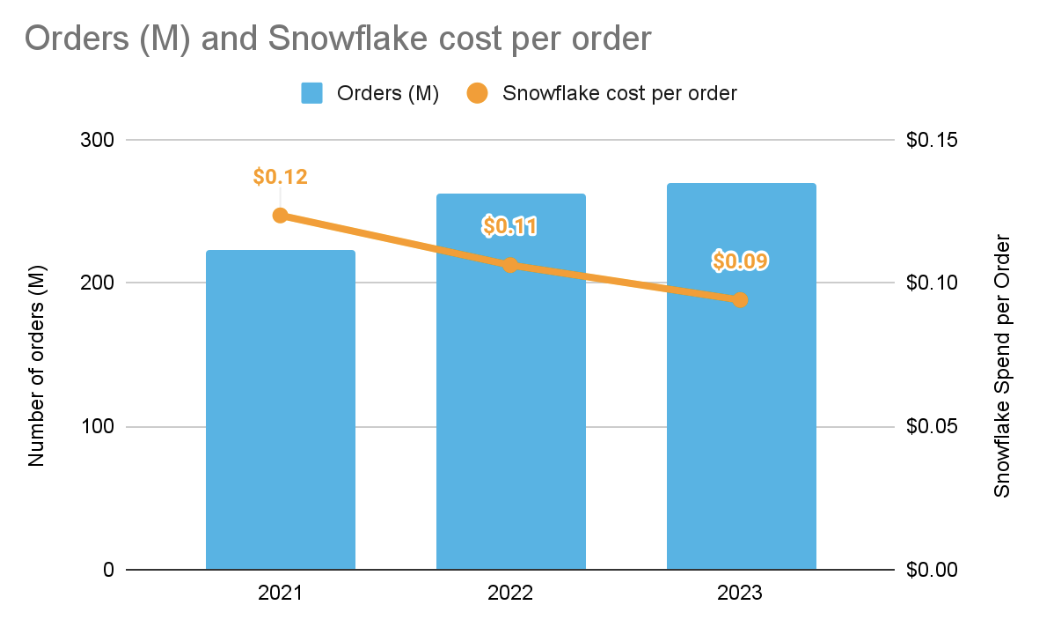
Business Metrics link cloud spending to meaningful business outcomes and value drivers. These KPIs are essential for executives, finance teams, and product managers to understand the return on investment (ROI) of cloud expenditure and to allocate costs accurately across different parts of the organization. They answer the critical question: "What business value are we getting for our cloud spend?" Examples include:
-
Cost per customer: Attributes a portion of the total platform cost to each of the company's end customers. This is a powerful metric for understanding profitability and cost-to-serve at a customer level.
-
Cost per project: Allocates cloud costs to specific internal projects, products, or initiatives. This enables accurate project-based accounting and helps assess the financial viability of new features or services.
-
"Bring Your Own Metric": Custom define unit economic metrics that are unique to your organization's business model. Examples could include Cost per Transaction, Cost per Shipment, or Cost per Ad Impression. Creating these tailored metrics ensures the most accurate alignment between cloud spend and core business value.
Visualize metrics with Snowsight tools and external BI tools
A critical component of cost governance is the effective visualization of spending and usage data. Raw data, while comprehensive, is often difficult to interpret and act upon. By translating cost and usage metrics into interactive dashboards and reports, you can empower stakeholders—from engineers to executives—to understand spending patterns, troubleshoot, and make informed decisions. A multi-layered approach can be used to track meaningful cost metrics.
-
Snowsight's built-in cost management capabilities: Snowsight provides pre-built visuals for usage and credit monitoring directly within the Snowflake Cost Management UI. It allows filtering by tags (e.g., view cost by department tag), credit consumption by object types, and cost insights to optimize the platform.
-
Creating custom dashboards or Streamlit apps for different stakeholder groups: Snowsight facilitates the creation of custom dashboards using ACCOUNT_USAGE and ORGANIZATION_USAGE views. Custom charts in the Dashboards feature and Streamlit apps can both be easily shared. Combined with cost allocation and tagging, this allows for tailored views for finance managers (aggregated spend), engineering managers (warehouse utilization), or data analysts (query performance).
-
Integrating with third-party BI tools for advanced analytics: Connecting to Snowflake from tools like Tableau, Power BI, Looker, or custom applications offers highly customizable and extensive control over cost data visualization. Cloud-specific third-party data programs (FinOps platforms) offer easier setup and more out-of-the-box Snowflake cost optimization insights.
-
Leverage Cortex Code (In Preview): This AI Assistant capability allows users to query cost and usage data in ACCOUNT_USAGE views using natural language natively in the Snowsight UI.
Investigate anomalous consumption activity
Cost Anomaly Detection is a critical component of visibility that leverages machine learning to continuously monitor credit consumption against historical spending patterns, automatically flagging significant deviations from the established baseline. This proactive monitoring is essential for preventing budget overruns and identifying inefficiencies, shifting the organization from a reactive to a proactive cost management posture to mitigate financial risk. As a best practice, you should initially review anomaly detection on the entire account to gain a broad view, then dive deeper into a more granular review for individual high-spend warehouses. This approach allows for more targeted analysis and assigns clear ownership for investigating any flagged anomalies. There are several methods for anomaly detection supported by Snowflake:
Cost Anomalies in Snowsight
Snowsight, Snowflake's primary web interface, offers a dedicated Cost Management UI that allows users to visually identify and analyze the details of any detected cost anomaly. The importance of this intuitive visual interface lies in its ability to make complex cost data accessible to a wide range of stakeholders, enabling rapid root cause analysis by correlating a cost spike with specific query history or user activity. One of the tabs in this UI is the Cost Anomaly Detection tab, which enables you to view cost anomalies at the organization or account level and explore the top warehouses or accounts driving this change. To foster a culture of cost awareness and accountability, it is a best practice to ensure there is an owner for an anomaly detected in the account and set up a notification (via email) in the UI itself to ensure that cost anomalies are quickly and accurately investigated.
Programmatic Cost Anomaly Detection
For deeper integration and automation, organizations can review anomalies programmatically using the SQL functions and views available within the SNOWFLAKE.LOCAL schema. This approach is important for enabling automation and scalability, allowing cost governance to be embedded directly into operational workflows, such as feeding anomaly data into third-party observability tools or triggering automated incident response playbooks. A key best practice is to utilize this programmatic access to build custom reports and dashboards that align with specific financial reporting needs and to create advanced, automated alerting mechanisms that pipe anomaly data into established operational channels, such as Slack or PagerDuty.
Custom Anomaly Detection & Notification
Although anomalies are detected at the account and organization level, if you desire to detect anomalies at lower levels (e.g. warehouse or table), it is recommended to leverage Snowflake’s Anomaly Detection ML class and pair it with a Snowflake alert to notify owners of more granular anomalies that occur within the ecosystem. This ensures all levels of Snowflake cost can be monitored in a proactive and effective way. As a best practice, notifications should be configured for a targeted distribution list that includes the budget owner, the FinOps team, and the technical lead responsible for the associated Snowflake resources, ensuring all stakeholders are immediately aware of a potential cost overrun and can coordinate a swift response.
Control
Overview
The Control principle of the Cost Optimization framework is designed to move organizations beyond cost reporting by establishing the necessary automated guardrails and governance policies to manage and secure Snowflake consumption proactively. This framework enforces financial governance by transforming cost visibility into tangible action, utilizing features like budgets and resource monitors to prevent uncontrolled growth and ensure consumption aligns strictly with organizational financial policies. Control is foundational for maximizing the value of the platform by ensuring disciplined and cost-effective resource utilization.
Recommendations
Implementing a comprehensive control framework, supported by features such as Resource Monitors, Budgets, and Tagging Policies, empowers organizations to enforce financial accountability and maintain budget predictability. By adopting these controls, teams can actively manage spend, quickly and automatically mitigate cost inefficiencies, and ensure the disciplined, cost-effective utilization of the entire Snowflake environment. The culmination of all of these controls leads to greater platform ROI and minimized financial risk. To meet this goal, consider the following recommendations based on industry best practices and Snowflake's capabilities:
Proactively monitor all platform usage
To effectively manage and control Snowflake spend, it is essential to establish and enforce cost guardrails. Implementing a budgeting system is a key FinOps practice that promotes cost accountability and optimizes resource usage by providing teams with visibility into their consumption and the ability to set alerts and automated actions. Budgeting helps to prevent unexpected cost overruns and encourages a cost-conscious culture.
Set budgets permissions
To establish effective budgets, it's crucial to define roles and privileges by configuring the role, team, or user responsible for the resources. This ensures that budget tracking aligns with specific business units or projects, enabling accurate cost attribution and accountability. By linking consumption to the relevant stakeholders, you can create a clear showback or chargeback model, which is vital for fostering a sense of ownership over spending. This configuration should be part of a broader, consistent tagging strategy to ensure all costs are properly allocated to departments, environments, or projects.
Create budget categories
Categorizing costs is fundamental for granular budget management. You can establish budgets based on the account or create custom categories using Object Tags. Custom tags, such as those for a data product or cost center, are critical for accurately apportioning costs across different departments, lines of business, or specific projects. This granular approach provides a detailed breakdown of where spending occurs, enabling more precise control and informed decision-making regarding resource allocation. Implementing robust tagging policies and naming conventions ensures consistency and facilitates the interpretation of cost data. Because budgets are soft limit objects, objects can be part of more than one budget if different perspectives need to be tracked for cost (e.g., cost center & workload level budgeting).
Implement a notification strategy
Effective budget management relies on timely communication. Setting up alerting through emails or webhooks to collaboration tools like Slack and Microsoft Teams provides proactive notification to key stakeholders when spending approaches or exceeds a defined threshold. These alerts provide teams with an opportunity to review and adjust their usage before it leads to significant cost overruns. This capability positions organizations for security success by mitigating potential threats through comprehensive monitoring and detection.
Notifications are not limited to just budgets; Snowflake alerts can also be configured to systematically notify administrators of unusual or costly patterns, such as those listed in the Control and Optimize sections of the Cost Pillar. This ensures that key drivers of Snowflake consumption can be tracked and remediated proactively, even as the platform’s usage grows.
Forecast consumption based on business needs
Forecasting Snowflake consumption should be a strategic business function, not a mere technical prediction. The goal is to establish a transparent basis for budgeting and optimizing ROI by linking consumption directly to measurable business outcomes. In a dynamic, usage-based environment where compute costs are the most volatile element of the bill, a robust framework must integrate quantitative analysis of historical usage with qualitative insights into future business drivers. The following framework outlines how to build and maintain a comprehensive consumption forecast.
Establish the Baseline
This phase focuses on understanding the source of spend and establishing granular cost accountability.
-
Identify demand drivers and unit economics: To understand what drives Snowflake spend, correlate historical credit, storage, and data transfer usage with key business metrics like cost per customer or per transaction. Use Snowflake's ACCOUNT_USAGE schema, including the WAREHOUSE_METERING_HISTORY and QUERY_HISTORY views, as the primary data sources for this analysis.
-
Granular cost attribution: Accurately tie costs back to business teams or workloads by implementing a mandatory tagging strategy for all warehouses and queries. Align these tags with your organization's financial structure to provide clear cost segmentation.
Build the predictive model
This phase integrates historical trends with strategic business inputs to create forward-looking projections.
-
Historical trend analysis: Analyze past usage for trends, seasonality, and outliers to inform future projections. Start with simple trend-based forecasting and progressively move to more sophisticated models, leveraging Snowflake’s built-in SNOWFLAKE.ML.FORECAST function for time-series forecasting.
-
Driver-based forecasting: Integrate planned business initiatives and new projects directly into the model. Collaborate with business leaders to gather strategic inputs such as projected customer growth, new product launches, or increased data ingestion from marketing campaigns.
-
Scenario modeling: Develop multiple forecast scenarios (e.g., "conservative," "base case," "aggressive") by applying varied growth factors to key business drivers. This enables flexible planning and helps mitigate financial risk.
Operationalize and optimize
This phase links the forecast to continuous monitoring, governance, and proactive cost controls.
-
Continuous monitoring and variance analysis: Regularly compare actual consumption against the forecast to identify and investigate significant variances. This feedback loop is crucial for refining the underlying model and adapting to evolving business needs.
-
Collaborative governance: Ensure a single source of truth for consumption data by establishing a regular FinOps review session with Finance, Engineering, and Business teams. Use customized dashboards to present data in business-friendly terms.
-
Implement predictive budget controls: Shift from reactive spending to a proactive model. Utilize Snowflake Resource Monitors and Budgets, which employ monthly-level time-series forecasting, to define credit quotas and trigger automated alerts or suspensions to prevent cost overruns.
Enforce cost guardrails for organizational resources
To effectively manage Snowflake expenditure and prevent unforeseen costs, it is crucial to implement a robust framework of resource controls. These controls act as automated guardrails, ensuring that resource consumption for compute, storage, and other services aligns with your financial governance policies. By proactively setting policies and remediating inefficiencies, you can maintain budget predictability and maximize the value of your investment in the platform.
Compute controls
Controlling compute consumption is often the most critical aspect of Snowflake cost management, as it typically represents the largest portion of spend. Snowflake offers several features to manage warehouse usage and prevent excessive costs.
-
Implement resource monitors: Resource monitors are a powerful feature for tracking and controlling credit consumption across virtual warehouses or for the entire account. Their primary importance lies in their ability to enforce strict budget limits, preventing cost overruns by automatically triggering actions, such as sending notifications and/or suspending warehouses when credit usage reaches a defined quota. For effective governance, it is a best practice to create multiple resource monitors at different granularities (e.g., per-department, per-project) with escalating actions, such as notifying administrators at 80% usage and suspending all assigned warehouses at 100% usage, to cap spending. It is also considered best practice to ensure there is a consistent action tied to the resource monitors based on your organization’s ways of working. For example, it is worth considering that set resource monitors perform actions like notify to specific admin(s) within your organization.
-
Reduce Runaway Queries: Runaway or hung queries can lead to significant cost overruns. Managing long-running queries is especially important for environments with ad-hoc users or complex analytical workloads, where a poorly written query can consume credits for hours.
-
Statement timeout policies automatically terminate any query that runs longer than a specified time limit. This serves as an essential guardrail to prevent individual queries from consuming excessive resources and impacting both cost and performance for other users. The best practice is to set the STATEMENT_TIMEOUT_IN_SECONDS parameter at different levels—for the account, warehouse, specific users, or individual sessions—to tailor controls to different workload patterns, such as allowing longer timeouts for ETL warehouses compared to BI warehouses. Queued timeout policies can also help remove queries that eclipse a reasonable time threshold and could have been run elsewhere by users trying to receive a response.
-
Policy-based automation can also cancel queries pre-emptively. An example is using stored procedures that leverage the SYSTEM$CANCEL_QUERY function to terminate statements that exceed predefined runtime thresholds or contain ill-advised logic, such as exploding joins. This approach allows you to more finely customize the types of queries you want to cancel, as you have full control over defining the stored procedure logic.
-
-
Auto-suspend policies: Auto-suspend policies are a foundational cost control for virtual warehouses, automatically suspending a warehouse after a defined period of inactivity. By default, all warehouses have auto-suspend enabled, however this feature can be disabled, so it’s important to monitor warehouse auto-suspend configuration and ensure proper access controls are set to restrict users from disabling the auto-suspend setting. The best practice for balancing cost versus performance is to reduce the auto-suspend policy to the minimum possible (generally above 60 seconds) without affecting query caching and performance (SLA) expectations.
Storage Controls
While storage costs are generally lower than compute costs, they can grow significantly over time. Understanding the different components of storage cost and implementing policies to manage the types of storage is key to keeping these costs in check.
-
Staged files: Staged files are files that have been prepped for bulk data loading/unloading (stored in compressed or uncompressed format). They can be stored in an external stage using cloud provider’s blob storage (such as Amazon S3) or an internal stage within the Snowflake platform. You are only charged for data stored in internal stages.
- To help control costs on staged files, as well as improve performance of data loads, you can ensure successfully ingested files are removed by using the PURGE = TRUE option of the COPY INTO <table> command. Alternatively, use the REMOVE command to remove the files in the stage.
-
Active Storage: Active Storage consists of the data in a table that can be actively queried against at the current point of time (i.e., without using Time-Travel commands). To control active storage costs, you can create a Storage Lifecyle Policy to automatically archive or delete data based on an expiration policy you create.
-
Time Travel: Time Travel data is data that is maintained for all historical changes of a table through its retention time, allowing for easy recovery of changed or deleted data.
-
Time Travel data retention is controlled using the DATA_RETENTION_TIME_IN_DAYS parameter, which can be set at a number of different object levels (i.e. Account, Database, Schema, Table), so it is important to monitor this setting to ensure you do not have excessive data retention where it is not needed.
-
Snowflake has a standard data retention period of one day. This is automatically enabled for all accounts, but for some tables, particularly large, high churn tables, this one day can still result in excessive costs. To reduce costs in these cases, you can create these tables as transient with zero Time Travel retention (i.e., DATA_RETENTION_TIME_IN_DAYS=0) and periodically insert a copy of the table contents into a permanent table.
-
-
Fail-safe: In addition to Time-Travel, Snowflake retains historical data for seven days after the Time-Travel retention period expires as Fail-Safe data. This data can be requested for worst-case scenario data recovery. Fail-safe applies to all tables that are created as the permanent table type (which is the default table type).
- However, for ETL or data modeling, it is common to have tables that are created on a short-term basis to support transformations. For these use cases, it is recommended that you use Temporary and Transient tables, which do not utilize fail-safe storage and thus do not incur additional storage costs.
-
Retained for clones: This is data that is stored because it is referenced by a clone, despite the data being deleted or outside the retention period of the base table that was cloned. To control costs related to these “stale” clones, it is recommended that you monitor RETAINED_FOR_CLONE_BYTES and drop clones that are no longer needed. You can leverage the Alerts and Notifications features to alert you when RETAINED_FOR_CLONE_BYTES exceeds a threshold, prompting you to take action.
Serverless Features
For serverless features, which do not use warehouse compute and therefore cannot leverage the Resource Monitor feature, we recommend setting up a budget. Budgets allow you to define a monthly spending limit on the compute costs for a Snowflake account or a custom group of Snowflake objects. When the spending limit is projected to be hit, a notification is sent. While Budgets do not explicitly allow you to suspend serverless features upon reaching a limit (the way that Resource Monitors do), Budgets can be configured to not only send emails, but also send notifications to a cloud message queue or other webhooks (such as Microsoft Teams, Slack, or PagerDuty). This then gives you the ability to trigger other actions for remediation.
Govern resource creation and administration
To prevent uncontrolled spend as organizations scale, it's essential to have a clear management strategy for Snowflake resources, most notably, virtual warehouses. This strategy should encompass a defined provisioning process, ongoing object management, and automated platform enforcement to foster agility while maintaining financial discipline.
Centralized vs. decentralized management
Organizations tend to adopt one of two primary approaches to managing Snowflake resources:
-
Centralized management: A dedicated team, such as a platform Center of Excellence (CoE), handles resource creation and administration policies. This ensures consistency, adheres to best practices, and facilitates robust cost control. This model is ideal for large enterprises where strict governance and chargeback are paramount.
-
Decentralized management: Individual business units or teams manage their own resources. This provides greater autonomy and speed but can lead to resource sprawl, inconsistent practices, and significant cost inefficiencies if not properly governed.
Striking the balance: the federated model
The most effective strategy often lies in a hybrid, or federated, model. This approach combines centralized governance (policies defined by a CoE) with decentralized execution (teams having the freedom to create resources within those guardrails). This balance enables agility while mitigating financial risk.
Core Principles for Governance
Regardless of the chosen model, these principles are essential for effective governance:
-
Limit resource creation: Restrict the ability to create or modify virtual warehouses and other high-cost resources to a small number of trusted roles to prevent uncontrolled growth.
-
Establish a transparent workflow: Create a clear, simple workflow for provisioning resources, especially for larger warehouses. For example, any request for a warehouse of medium size or larger should require a business justification and an assigned cost center.
-
Near real-time visibility: Triggered visibility is non-negotiable for monitoring resource creation and resizing. Configure alerts that notify FinOps or CoE teams whenever a new warehouse is created or an existing one is modified outside of a provisioning workflow. This allows for immediate review and prevents overprovisioning.
-
Enforce tagging: Make a mandatory tagging strategy a prerequisite for all resource creation. This ensures every credit spent can be accurately attributed to the correct department or project, enabling robust chargeback and accountability.
-
Automate deactivation: To prevent object sprawl, implement policies that identify and deactivate stale resources after a predetermined period of disuse.
Optimize
Overview
The Optimization principle of the Cost Optimization framework focuses on continuously improving the efficiency of your Snowflake resources. This includes optimizing compute, storage, data transfer, and managed services by understanding their usage and identifying areas for improvement. The frequency of optimization efforts should be guided by the metrics established in the Visibility principle and monitored through the Control principle. All recommendations within this Optimize principle are to be reviewed on a regular cadence and balanced with business and performance needs.
Recommendations
Snowflake offers numerous optimization controls within its platform. These features are designed to enhance efficiency and reduce administrative overhead for your various workloads. Coupled with operational best practices that utilize features in a healthy manner, you can balance performance goals with cost governance requirements to meet business objectives.
By implementing these recommendations, you will be able to:
-
Reduce administration time
-
Increase workload efficiency
-
Balance cost controls and guardrails to meet service level agreements and business objectives
-
Achieve healthy growth and economies of scale within your organization
To foster healthy growth and achieve economies of scale within your organization, we recommend the following, drawing upon industry best practices and Snowflake's capabilities.
Compute workload-aligned provisioning
Compute is the most significant part of any organization’s Snowflake spend, typically accounting for 80% or more of spend. A good warehouse design should incorporate the principles below:
-
Separate warehouses by workload (e.g., ELT versus analytics versus data science)
-
Workload size in bytes should match the t-shirt size of the warehouse in the majority of the workloads–larger warehouse size doesn’t always mean faster
-
Align warehouse size for optimal cost-performance settings
-
Utilize Multi-Cluster Warehouse configuration to solve for high concurrency
-
Utilize Query Acceleration Services to help with infrequent, large data scans
-
For memory-intensive workloads, use a warehouse type of Snowpark Optimized or higher memory resource constraint configurations as appropriate
-
Set appropriate auto-suspend settings - longer for high cache use, lower for no cache reuse
-
Set appropriate warehouse query timeout settings for the workload and the use cases it supports.
Using the principles above ensures that your compute costs are well managed and balanced with optimal benefits.
Separate warehouses by workload
Different workloads (e.g., data engineering, analytics, AI and applications) have varying characteristics. Separating these to be serviced by different virtual warehouses can help ensure relevant features in Snowflake can be utilized.
Some examples of this include:
-
Optimize dashboards and reports by reusing the warehouse SSD cache for repeated select queries. This can be achieved by configuring a longer warehouse autosuspend setting.
-
Loading large volumes of data using optimal file sizes and utilizing all available threads in a virtual warehouse
-
Processing large data sets for AI workloads using memory-optimized warehouses
Warehouse sizing
Mapping the workload to the right warehouse size and configuration is an important consideration of warehouse design. This should consider several factors like query completion time, complexity, data size, query volume, SLAs, queuing, and balancing overall cost objectives. Warehouse sizing involves a cost-benefit analysis that balances performance, cost, and human expectations. Humans often have expectations that their queries will not be queued or take a long time to complete, so it is recommended to have dedicated warehouses for teams.
Recommendations for choosing the right-sized warehouse include:
-
Follow the principles outlined above and understand that this is a continuous improvement process.
-
Choose a size based on the estimated or actual workload size and monitor.
-
Utilize Snowflake's extensive telemetry data, such as QUERY_HISTORY and WAREHOUSE_METERING_HISTORY, to validate that the warehouse size is impacting the metrics you care about in the direction you intend.
Optimal warehouse settings
While Snowflake strives for minimal knobs and self-managed tuning, there are situations where selecting the right settings for warehouses can help with optimal cost and/or performance. Some of the key warehouse settings include
-
Auto suspend
-
Multi-cluster settings
-
Warehouse resource constraints
-
Warehouse type
To maintain an optimal balance between cost and performance, regularly monitor your resource usage (e.g., weekly or monthly) and set up resource monitors to alert you to high credit consumption. When workload demands change, adjust your settings as needed.
Warehouse consolidation
If you find yourself with an excess of provisioned warehouses or a shift in workloads necessitating consolidation, apply the aforementioned principles. Begin with the least utilized warehouses and migrate their workloads to an existing warehouse that handles similar tasks.
The WAREHOUSE_LOAD_HISTORY view can help you assess the average number of queries running on a warehouse over a specific period. A useful benchmark is to aim for a warehouse running queries 80% of the time it's active. Continuously monitor your key metrics to ensure they still meet SLA goals and adjust warehouse settings as needed.
Leverage Managed Services
To achieve significant operational efficiency and predictable costs, prioritize the use of serverless and managed services. These services eliminate the need to manage underlying compute infrastructure, allowing your organization to pay for results rather than resource provisioning and scaling. Evaluate the following servterless features to reduce costs and enhance performance in your environment.
Storage optimization
Snowflake offers several serverless features that automatically manage and optimize your tables, reducing the need for manual intervention while improving query performance. The following features ensure your data is efficiently organized, allowing for faster and more cost-effective qeuerying without the burden of user management.
Automatic Clustering is a background process in Snowflake that organizes data within a table by sorting it according to predefined columns. This process is critical for optimizing query performance and reducing costs. Benefits include:
-
Improved query pruning: By sorting data, automatic clustering enables more effective pruning in SQL WHERE clauses, meaning less data needs to be scanned for a given query.
-
Faster joins: Clustering also results in quicker and more efficient join operations.
-
Cost-efficient queries: These benefits ultimately result in faster and more cost-effective query execution.
Considerations and Best Practices:
-
Careful tuning: It's essential to tune automatic clustering carefully. Overuse of clustering keys, use of highly selective keys, or frequent data manipulation language (DML) operations can significantly increase clustering costs.
-
Infrequently queried, frequently updated tables: Exercise caution with tables that are often updated but rarely queried, as clustering costs may outweigh performance improvements.
-
Cost estimation: Before enabling, estimate clustering costs for a table using Snowflake's system function for a preliminary cost/benefit analysis.
-
Strategic cluster key selection: Optimizing clustering key selection is vital to strike a balance between cost and performance.
Search Optimization Service (SOS) enhances the performance of point lookup searches by creating a persistent search access path. Its primary value lies in achieving better pruning for these specific query types, which is critical for applications requiring quick response times. They can be used in combination with auto-clustering and Snowflake Optima service.
Considerations for SOS:
-
Excessive indexed columns: Avoid having too many indexed columns, especially on high-churn tables, as maintenance costs can become substantial.
-
Inefficient cost-benefit ratio: Tables that are frequently updated but infrequently queried for point lookups can lead to an inefficient cost/benefit ratio.
-
Cost estimation: Before enabling, estimate SOS costs on a given table using a Snowflake system function to perform a preliminary cost/benefit analysis. Index selection is crucial for balancing performance and cost, a topic also addressed in the Workload Optimization section.
Materialized Views (MVs) are pre-computed query results stored as a separate table and automatically maintained by Snowflake.
Benefits of MVs:
-
Cost efficiency: It is often cheaper to update a materialized view than to repeatedly execute full scans of large, complex base tables.
-
Alternative table order: MVs can provide an alternative table order for queries that do not align with your existing clustering design.
Considerations for MVs:
-
Infrequently queried, frequently updated tables: Avoid creating materialized views on tables that are frequently updated but rarely queried, as automated maintenance costs will negate any potential query cost savings.
-
Clustering differences: Be aware of clustering differences between the base table and the materialized view, as this can lead to high maintenance costs.
Query Acceleration Service (QAS): QAS is a serverless feature that provides a burst of additional compute resources to accelerate specific parts of a query, rather than replacing an appropriately sized warehouse. It's particularly beneficial for large I/O operation queries, eliminating the need to manually scale warehouses up or down. QAS also helps speed up query execution when table clustering cannot be altered due to other workload dependencies. A cost-benefit analysis should always be performed to ensure that the credit consumption from QAS is justified by the performance improvement and the avoided cost of a larger warehouse.
Serverless tasks: Serverless tasks enable the execution of SQL statements or stored procedures on a user-defined schedule, eliminating the need for a user-managed virtual warehouse. This is a cost-effective solution for infrequent workloads where a warm cache offers minimal value, or for unpredictable workloads that don't utilize a minimum 60-second usage.
Data storage types & lifecycle management
Next to compute, storage often represents the second-highest cost component in Snowflake. Effective storage governance is a critical concern for many industries due to federal and global regulations. Snowflake's default settings prioritize maximum data protection, which may not always align with the requirements of every workload or environment. This section focuses on how to manage and configure storage-related settings appropriately, ensuring that storage costs remain reasonable and deliver business value.
Optimizing table volume and auditing usage
-
Review policy-driven data lifecycle management:
-
Time Travel & Fail-safe: Set the DATA_RETENTION_TIME_IN_DAYS parameter on a per-table or per-schema basis to the minimum required for your business needs. For transient data, use TRANSIENT tables to eliminate Fail-safe costs.
-
Retained for clone: Be mindful of cloning operations. While zero-copy cloning is cost-effective initially, any subsequent DML (Data Manipulation Language) operations on the clone will create new micro-partitions, increasing storage costs. It is recommended to drop clones when they are no longer needed.
-
-
Be aware of high-churn tables:
- If a table is updated consistently, inactive storage (Time Travel & Fail-safe data) can grow at a much faster rate than active storage. A high churn table is generally characterized as one that has 40% or more of its storage inactive. Therefore, aligning both the retention time and the use of an appropriate table type with business and recovery requirements is paramount to keeping costs under control. Review High Churn tables on a consistent basis to ensure their configuration is as desired.
-
Proactively clean up unused objects:
-
Large tables that are never queried: Establish a process to identify, rename, and eventually drop tables that have not been queried for an extended period. You can use the ACCESS_HISTORY account usage view to review the last time a table was selected from. Snowflake’s Cost Insights will also check weekly for unused tables on your behalf.
-
-
Perform catalog & stage management:
- Data archiving: For historical data that is rarely accessed, consider moving it to cooler tiers with storage lifecycle policies or deleting it altogether.
Optimizing Managed Data Structures and Access
-
You do not always need to define cluster keys for all tables (unlike many other relational database management systems) if Snowflake's natural data loading maintains consistent micro-partition min/max values relative to your query patterns. Additionally, you can disable Auto-Clustering on a table while keeping its cluster key definition without incurring extra costs.
-
Infrequently used materialized views and search optimization paths: Materialized Views and search optimization paths can incur unnecessary storage and compute costs if they are no longer actively utilized. Materialized Views are most effective for stable data tables with repeated complex aggregations or joins, while search optimization is designed for high-speed point lookup queries. Snowflake’s Cost Insights feature can help identify instances where these objects are rarely used, prompting a review to determine if their performance benefits still outweigh their associated costs.
Limit data transfer
Data egress, the transfer of data from one cloud provider or region to another, can incur substantial costs, particularly when handling large data volumes. Implementing appropriate tools and best practices is essential to minimize these data transfer expenses and maximize business value when data egress is necessary.
Tooling: Enable proactive cost management
Leverage Snowflake's native features to gain visibility and control over data transfer costs before they become a significant expense.
-
Egress Cost Optimizer (ECO): For providers of data products on the Snowflake Marketplace or private listings, enabling the Egress Cost Optimizer (ECO) at the organizational level is a critical best practice. ECO is an automated feature for listings with Cross-Cloud Auto-Fulfillment. It intelligently routes data through a Snowflake-managed cache, allowing you to pay a one-time egress cost for the initial data transfer. After that, expanding to new regions incurs zero additional egress costs for the same dataset. This is a powerful tool for scaling your data sharing without compounding data transfer fees.
-
Monitoring and alerts: To effectively manage data transfer costs, utilize Snowflake's DATA_TRANSFER_HISTORY telemetry view. This view provides detailed insights into data movement between different regions and clouds. Establish dashboards and alerts to meticulously track this usage, enabling prompt detection of any unexpected cost increases.
Architectural best practices: Design for minimal data movement
Minimizing data transfer costs for your workloads heavily depends on the architecture of your data pipelines and applications. Adhere to the following best practices to achieve this:
-
Unloading Data:
-
Compress data: When using the COPY INTO <location> command to unload data, always use a compression format (e.g., GZIP, BZIP2, or Brotli). This dramatically reduces the volume of data transferred and directly lowers egress costs.
-
Filter before unloading: Before unloading a large dataset, use SQL to filter and transform the data. Unload only the required columns and rows to minimize the volume of data that must leave the Snowflake environment.
-
-
Data replication: Replicating a database to a Snowflake account in a different geographical region or on a different cloud provider incurs data transfer fees. While useful for disaster recovery, this can become expensive if not managed carefully.
-
Targeted replication: If a full database replica is not required, use replication groups to replicate only the necessary databases or schemas. This granular approach ensures you only pay for the data you absolutely need to move.
-
Consider refresh cadence: your frequency of refresh will affect the amount of data that is replicated, since it acts like a snapshot rather than every incremental change. Incremental ETL practices are recommended even more with data that is being replicated vs full table reloads.
-
-
External network access and functions:
-
Minimize data egress: External functions and external network access, which call remote services (e.g., APIs), transfer data out of Snowflake. For best practice, filter data before sending it to the external service. Avoid writing functions that pass an entire large table as an input; instead, pass only a small, pre-filtered subset.
-
Co-locate services: If possible, deploy the remote service (like an AWS Lambda or Azure Function) in the same cloud and region as your Snowflake account to eliminate cross-region and cross-cloud egress fees.
-
-
Cross-cloud auto-fulfillment:
- Embrace the cache: As a data provider, enable Cross-Cloud Auto-Fulfillment for your listings. As mentioned under Tooling, this feature automates the replication process and works in conjunction with the Egress Cost Optimizer to ensure you pay a single, upfront cost for data transfer, even as your data product expands to new regions.
-
Cross-region/cross-cloud Iceberg storage:
- Centralize your catalog: While Snowflake supports Iceberg tables that are external to its managed storage, be mindful of where the data resides. If your Snowflake account and your Iceberg data are in different regions, querying the Iceberg table will result in egress costs from your cloud provider. For a well-architected solution, keep your Iceberg data and your Snowflake account in the same region to avoid these egress charges.
Workload optimization
Workload optimization focuses on identifying the efficiency of your data processing activities within Snowflake. This involves a holistic approach encompassing the review of query syntax, data pipelines, table structures, and warehouse configurations to minimize resource consumption and improve performance. By addressing inefficiencies across these areas, organizations can significantly reduce costs and accelerate data delivery.
Query syntax optimization
Inefficient queries often lead to excessive and hidden credit consumption. Organizations can identify performance bottlenecks and understand the cost impact of specific SQL patterns by using Snowflake features and adhering to SQL code best practices. This enables development teams to create more efficient and cost-effective code by highlighting poor performing queries. Refer to the Performance Optimization Pillar of the Snowflake Well-Architected Framework for details on how to do this.
Utilize query history & insights for highlevel monitoring
For broader visibility across all workloads, the Snowsight UI and the ACCOUNT_USAGE schema are indispensable.
-
When looking for opportunities to improve, it is best to look for queries that have excessive execution time across similarly run queries. The newly created Grouped Query History aggregates queries to their parameterized query hash and allows users to sort based on key performance indicators like total queries, total latency, bytes scanned, and drill down into the query execution across time. It is recommended to start with queries with outsized latency and query runs.
-
The Query History page in Snowsight provides a high-level, filterable view of past and currently running queries. It allows for you to drill into the Query Profile for individual query statistics and investigation, even while the query is running.
-
Snowflake's Query Insights feature (both a set of account usage tables and query profile attributes) are also in Snowsight and can easily surface queries that would benefit from optimization, such as queries with exploding joins or ineffective filtering criteria that Snowflake will surface on your behalf.
Leverage the query profile for deep-dive analysis
After identifying problematic queries, the Query Profile is an essential tool for understanding the execution plan of a query. It provides a detailed, step-by-step breakdown of every operator involved, from data scanning to final result delivery. To gain visibility into inefficiencies, analysts and developers should regularly use the Query Profile to identify common anti-patterns like:
-
Nodes with high execution time: Pinpoint specific operations (e.g., a complex join or a sort operation) that consume the majority of the query's execution time.
-
"Exploding" joins: Identify Cartesian products or other inefficient joins that create a much larger number of rows than expected.
-
Excessive table scanning: In the profile, compare Partitions scanned to Partitions total. A large number of scanned partitions on a clustered table often indicates an opportunity to improve table pruning by adding or refining cluster keys or modifying WHERE clause predicates.
-
Data spillage: Look for operators spilling data to local or remote disk. This indicates that the warehouse memory is insufficient for the operation, resulting in significant performance degradation. This might suggest a need to temporarily increase warehouse size for that specific workload or rewrite the query to consume less memory.
Programmatically deconstruct queries for automated analysis
For advanced use cases and automated monitoring, you can programmatically access query performance data. The GET_QUERY_OPERATOR_STATS function can be used to retrieve the granular, operator-level statistics for a given query ID, showing many of the steps and attributes available in the query profile view. This allows you to build automated checks that, for instance, flag any query where a full table scan accounts for more than 90% of the execution time or where data spillage exceeds a certain threshold. This approach helps scale performance visibility beyond manual checks.
Pipeline optimization
Snowflake pipeline optimization is about designing and managing data ingestion and transformation processes that are efficient, cost-effective, scalable, and low-maintenance, while balancing business value and SLAs (service levels for freshness and responsiveness). Key levers include architecture patterns (truncate & load versus incremental loads), use of serverless managed services (e.g., Snowpipe, Dynamic Tables), and auditing loading practices to maximize cost and performance benefits.
Batch loading
The COPY INTO (table or location) command is a foundational and flexible method for bulk data loading from an external stage into a Snowflake table. Its importance lies in its role as a powerful, built-in tool for migrating large volumes of historical data or loading scheduled batch files. The best practice is to use COPY INTO for one-time or large batch data loading jobs, which can then be supplemented with more continuous ingestion methods like Snowpipe for incremental data. Additional information regarding COPY INTO and general data loading best practices can be found in our documentation here. Some additional best practices are outlined below.
-
File and batch sizing: Optimal performance is achieved with files sized 100–250 MB compressed. Too few large files or too many very small files reduce load parallelism and reduce efficiency.
-
Parallelism: Size and configure your warehouse cluster to match the number and typical size of files to be loaded. (e.g., an XS warehouse has eight threads; to utilize it fully, you need at least eight files).
-
File organization: Partition files in external stages by logical paths (date, region, etc.) to allow selective/cost-effective loads and enable easy partition-level reloading.
-
Pattern filtering: Use COPY's pattern and files parameter to precisely select the right files for each load, particularly to avoid scanning entire stages.
-
Resource management: Use resource monitors and low auto-suspend settings on load warehouses to minimize idle compute costs. For more information here see our section on Resource Monitors.** **
Serverless ingestion
While named similarly, Snowpipe and Snowpipe Streaming are different serverless methods to ingest data. You would utilize one versus the other depending on your SLA requirements for data delivery, and based on how data is landing for consumption.
-
Snowpipe (file-based micro-batch ingestion): Use Snowpipe for continuous ingestion of files where near real-time availability is acceptable and ingestion frequency is moderate. File size guidance is the same as COPY INTO (100-250MB). This leverages serverless compute to avoid warehouse management overhead.
-
Snowpipe Streaming (rowset-based, real-time ingestion): Use Snowpipe Streaming for very low-latency (sub-five-second) ingestion, high throughput, and streaming sources (e.g., Kafka, Kinesis, and event hubs). You will want to ensure “exactly-once guarantees” with offset tokens for idempotency. Ideally, you would batch insert as much as possible to reduce API call overhead, but avoid building streaming applications just to load large "batch" files.
Data Transformation Optimization
In general, there are two major transformation strategies followed in Snowflake. One is “truncate & load,” which involves full data replacement and reloading, and one is incrementally loading new data into an object, possibly requiring an upsert operation. Below is some general guidance on when to use each.
-
Truncate & load: This is utilized when full data replacement is acceptable and the dataset volume/size allows for fast reloads. In this case, data change patterns are such that identifying incremental deltas is expensive or unreliable and downstream consumers can tolerate occasional brief periods of incomplete data (during load).
- Best practices: Schedule loads during off-peak or agreed “quiet” windows. Consider transient or temporary tables to stage incoming data, maximize parallelism during the load, and then do an atomic swap/rename to minimize downtime. Ensure that you carefully manage object dependencies, constraints, and statistical metadata refresh after reloads to ensure proper performance once data is loaded
-
Incremental loads: Incremental loads are best when datasets are large and a full reload is too costly, slow, or would create unacceptable latency. Change-data-capture (CDC), event streaming, or other means are available to reliably identify deltas (inserts, updates, deletes). Additionally, in these cases, downstream consumers require near-continuous data availability or very low data latency and freshness.
-
Best practices: Design pipelines to deduplicate, merge, and correctly apply CDC deltas using staging tables, Streams, and merge operations. Ideally, you use Stream objects on source tables to track changes efficiently if utilizing Streams or Tasks, and use Tasks to automate processing. Dynamic tables are also an option; please see below. Additionally, for batch files: organize files by partitioned paths and use file loading patterns that enable max parallelism (see COPY INTO guidance below).
-
Test workloads on Snowflake’s Generation 2 warehouses that incorporate software improvements for data manipulation.
-
A great example of truncate & load versus incremental can be seen in refresh strategies for Dynamic Tables (DTs). They are also a cost-effective and low-maintenance way to maintain data pipelines. Dynamic tables provide a powerful, automated way to build continuous data transformation pipelines with SQL, eliminating the need for manual task orchestration that was historically architected with streams & tasks in Snowflake. Streams & tasks still have their uses, but general guidance and ease of use see more Snowflake users leaning towards DTs for automated data pipelines since the pipeline definitions are defined in one object or in a chain of objects.
The key concepts of dynamic tables are defined in our documentation. However, best practices and determining when to use DTs versus other methods of pipeline tooling in Snowflake still warrant discussion, and are compared in Snowflake’s documentation.
In addition to Snowflake’s published best practices, consider the following
-
Default to AUTO refresh: Override only as needed for predictable SLAs.
-
Keep incremental refresh-friendly queries simple: Avoid complex nested joins, CTEs, and limit the number of outer joins per DT. The introduction of complexity for incremental refresh may result in longer times for execution, which in turn could force Snowflake in AUTO to perform a full refresh rather than incremental.
-
Incremental refresh is optimal when less than 5% of the rows change between refresh cycles, and source tables are well clustered by relevant keys.
-
For very complex/large transformations: Chain multiple DTs for better incrementalization, rather than building one massive DT.
-
Monitor actual lag and refresh metrics to adjust lag or warehouse sizing as cost and response time needs evolve.
-
Prefer a dedicated warehouse for DT refresh during pipeline development and cost analysis to isolate consumption, then consider sharing for production.
-
Use transient DTs for high-throughput, non-critical staging steps to keep storage costs down.
-
Avoid non-deterministic functions in incremental DTs (e.g., random, volatile UDFs, queries depending on CURRENT_USER).
More information on dynamic tables versus streams & tasks versus materialized views can be found in the Snowflake documentation here.
Table pruning optimization
Table scanning operations are one of the most resource-intensive aspects of query execution. Minimizing the scan of data partitions in a table (called partition pruning) can provide significant improvements to both performance and cost for data operations in Snowflake. The account usage views TABLE_QUERY_PRUNING_HISTORY and COLUMN_QUERY_PRUNING_HISTORY provide aggregated data on query execution, showing metrics such as partitions scanned and rows matched, which helps identify tables with poor pruning efficiency. By analyzing this data, you can determine the most frequently accessed columns that are leading to a high number of unnecessarily scanned micro-partitions. Common ways to optimize these access patterns are by using Automatic Clustering and Search Optimization.
To determine tables that can most benefit from re-ordering how data is stored, you can review Snowflake’s best practice on how to analyze the TABLE_QUERY_PRUNING_HISTORY and COLUMN_QUERY_PRUNING_HISTORY account usage views. Fundamentally, reducing the percentage of partitions in each table pruned to the percentage of rows returned in a query will lead to the most optimized cost and performance for any given workload.
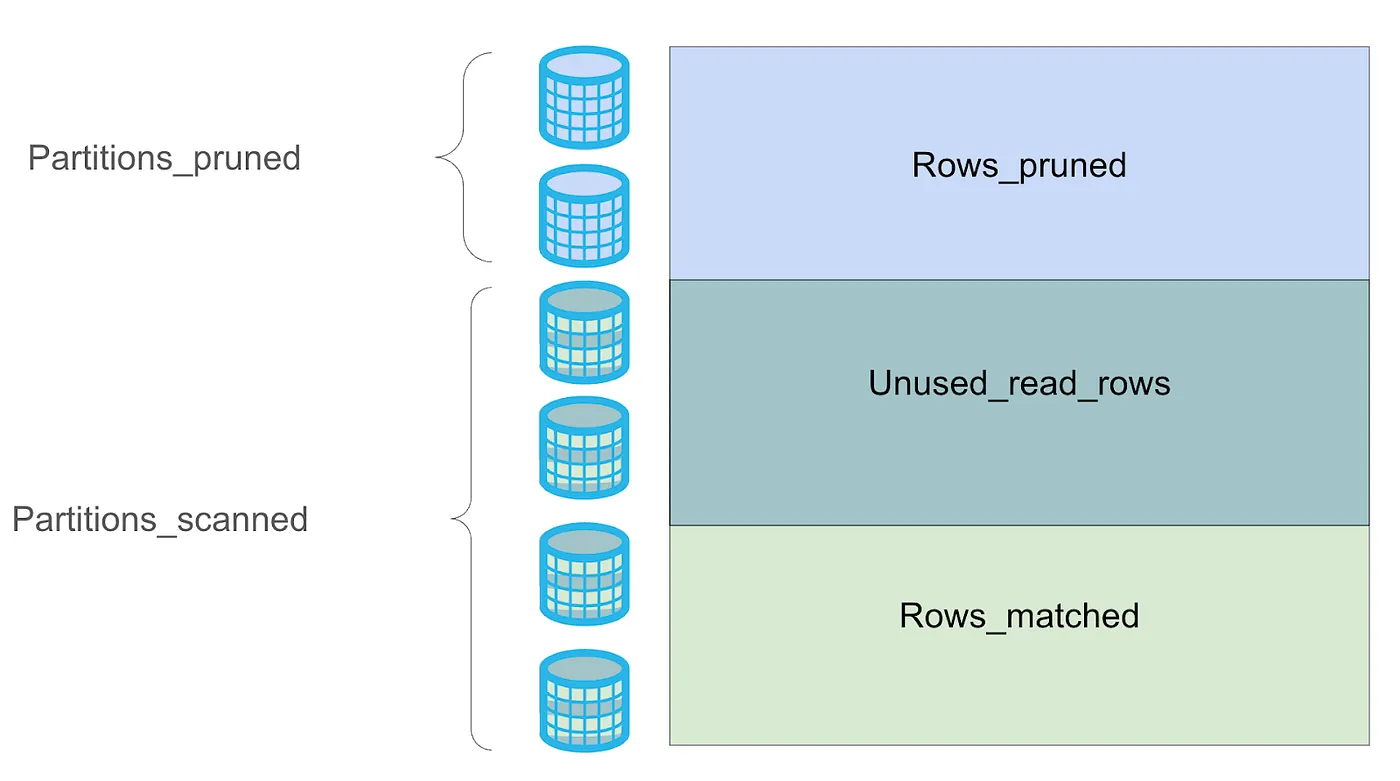
A table’s Ideal pruning state is scanning the same % of rows matched as partitions read, minimizing unused read rows.
Warehouse optimization
Warehouse concurrency, type, and sizing can impact the execution performance and cost of queries within Snowflake. Review the compute optimization section for more information into the tuning of the warehouse and its effect on cost and performance.
Improve continually
Optimization is a continuous process that ensures all workloads not only drive maximum business value but also do so in an optimal manner. By regularly reviewing, analyzing, and refining your Snowflake environment, you can identify inefficiencies, implement improvements, and adapt your platform to the ever-evolving business needs. The following set of steps will help you continue to improve your environment as you grow:
Step 1: Identify & investigate workloads to improve
Begin by regularly reviewing (usually on a weekly, bi-weekly, or monthly cadence) workloads that could benefit from optimization, using Snowflake's Cost Insights, deviations in unit economics or health metrics (from the Visibility principle), or objects hitting control limits (e.g., queries hitting warehouse timeouts from the Control principle). Once identified, investigate these findings through the Cost Management UI, Cost Anomaly detection, Query History, or custom dashboards with Account Usage Views to pinpoint the root cause. Then, using the recommendations in the Optimize Pillar, make improvements to the workload or object.
Step 2: Estimate & test
Before implementing changes, estimate the potential impact on cost and performance. Estimation encompasses both the expected amount of time required to make a change (for instance, consolidating warehouses will necessitate more coordination effort for teams using the resource than altering a configuration setting) as well as the hard cost of implementation. Snowflake provides helpful cost estimation functions for serverless features, such as auto clustering and search optimization service, to help make this a more data-driven process. If an estimation tool is not available, making changes in a development or test environment on a subset of the workload can provide an estimate and expected impact.
Step 3: Decide & implement
Based on your estimations and test results, decide whether to move forward with the change, ensuring the cost-benefit aligns with performance or business needs. If approved, proceed to productionize the change, integrating it into your live environment.
Step 4: Monitor & analyze
Finally, monitor and analyze the implemented changes to track and validate the change’s success over a period of time. This involves using the same investigation methods, like utilizing the Cost Management UI and Account Usage Views, and comparing cost and performance metrics before and after the change to articulate the business impact. Translate the technical improvements into tangible business benefits. For example, "Optimizing this query reduced monthly warehouse costs by $X and improved report generation time by Y minutes, allowing business users to make faster decisions." This helps to both demonstrate the value of your optimization efforts to stakeholders and business value to the company. Finally, course-correct as needed depending on the results of the monitoring
This continual improvement framework is the culmination of all subtopics within the Cost Optimization Pillar and provides a consistent way for you to grow healthily on Snowflake.
This content is provided as is, and is not maintained on an ongoing basis. It may be out of date with current Snowflake instances