Connect to Snowflake Data with Plotly and Build a Dashboard
Overview
In this guide you'll learn to connect to your Snowflake data via Plotly Studio. Then, you'll use Plotly Studio to build an interactive dashboard in under 5 minutes.
Prerequisites
A Snowflake Account with an accessible warehouse, database, schema, and table
What You’ll Learn
How to connect to your snowflake database and tables in Plotly How to build an interactive analytics dashboard
What You’ll Need
A snowflake account with knowledge of your username, password, account and warehouse names
What You’ll Build
A interactive analytics dashboard, also known as a Plotly Studio app
Getting Started
-
We are going to build a Plotly Studio app to visualize your data. So first, identify the database tables or table you would like to work with. Then, make note of your snowflake username, password, account and warehouse names because you will need them to connect your data to Plotly Studio.
-
Download Plotly Studio to your computer and install it.
Connect your Data to Plotly Studio
-
Launch Plotly Studio and click the
New Projectbutton -
Click the
Connect to Snowflakebutton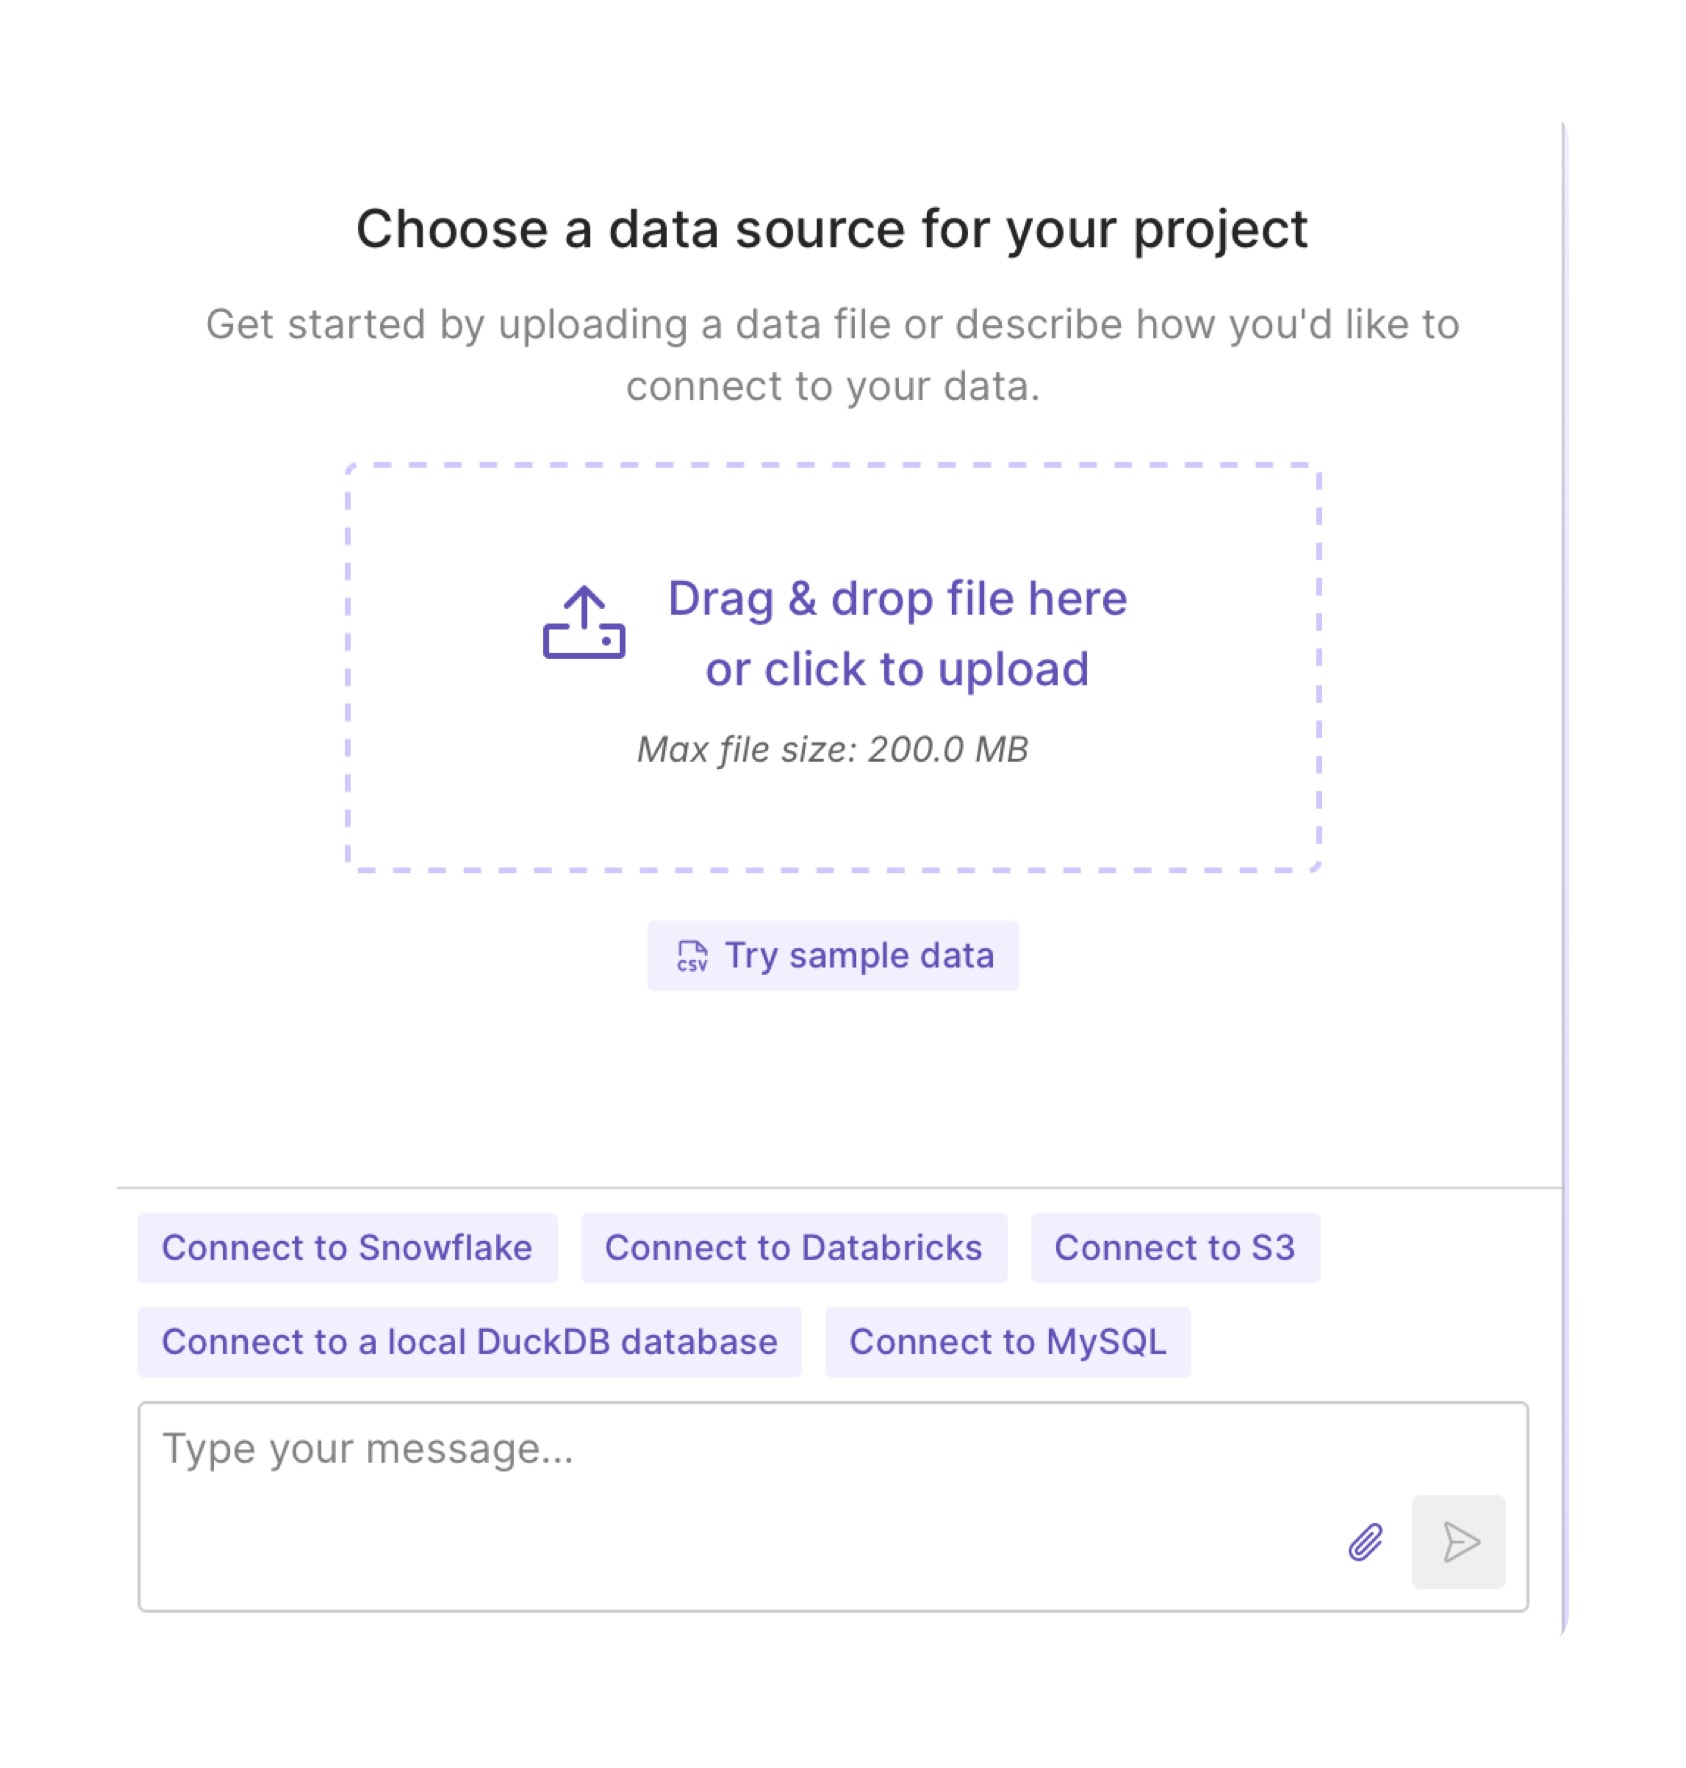
-
Once Plotly Studio instructs you, click the
Configure Credentialsbutton, fill out your credentials, and click theSave Credentialsbutton.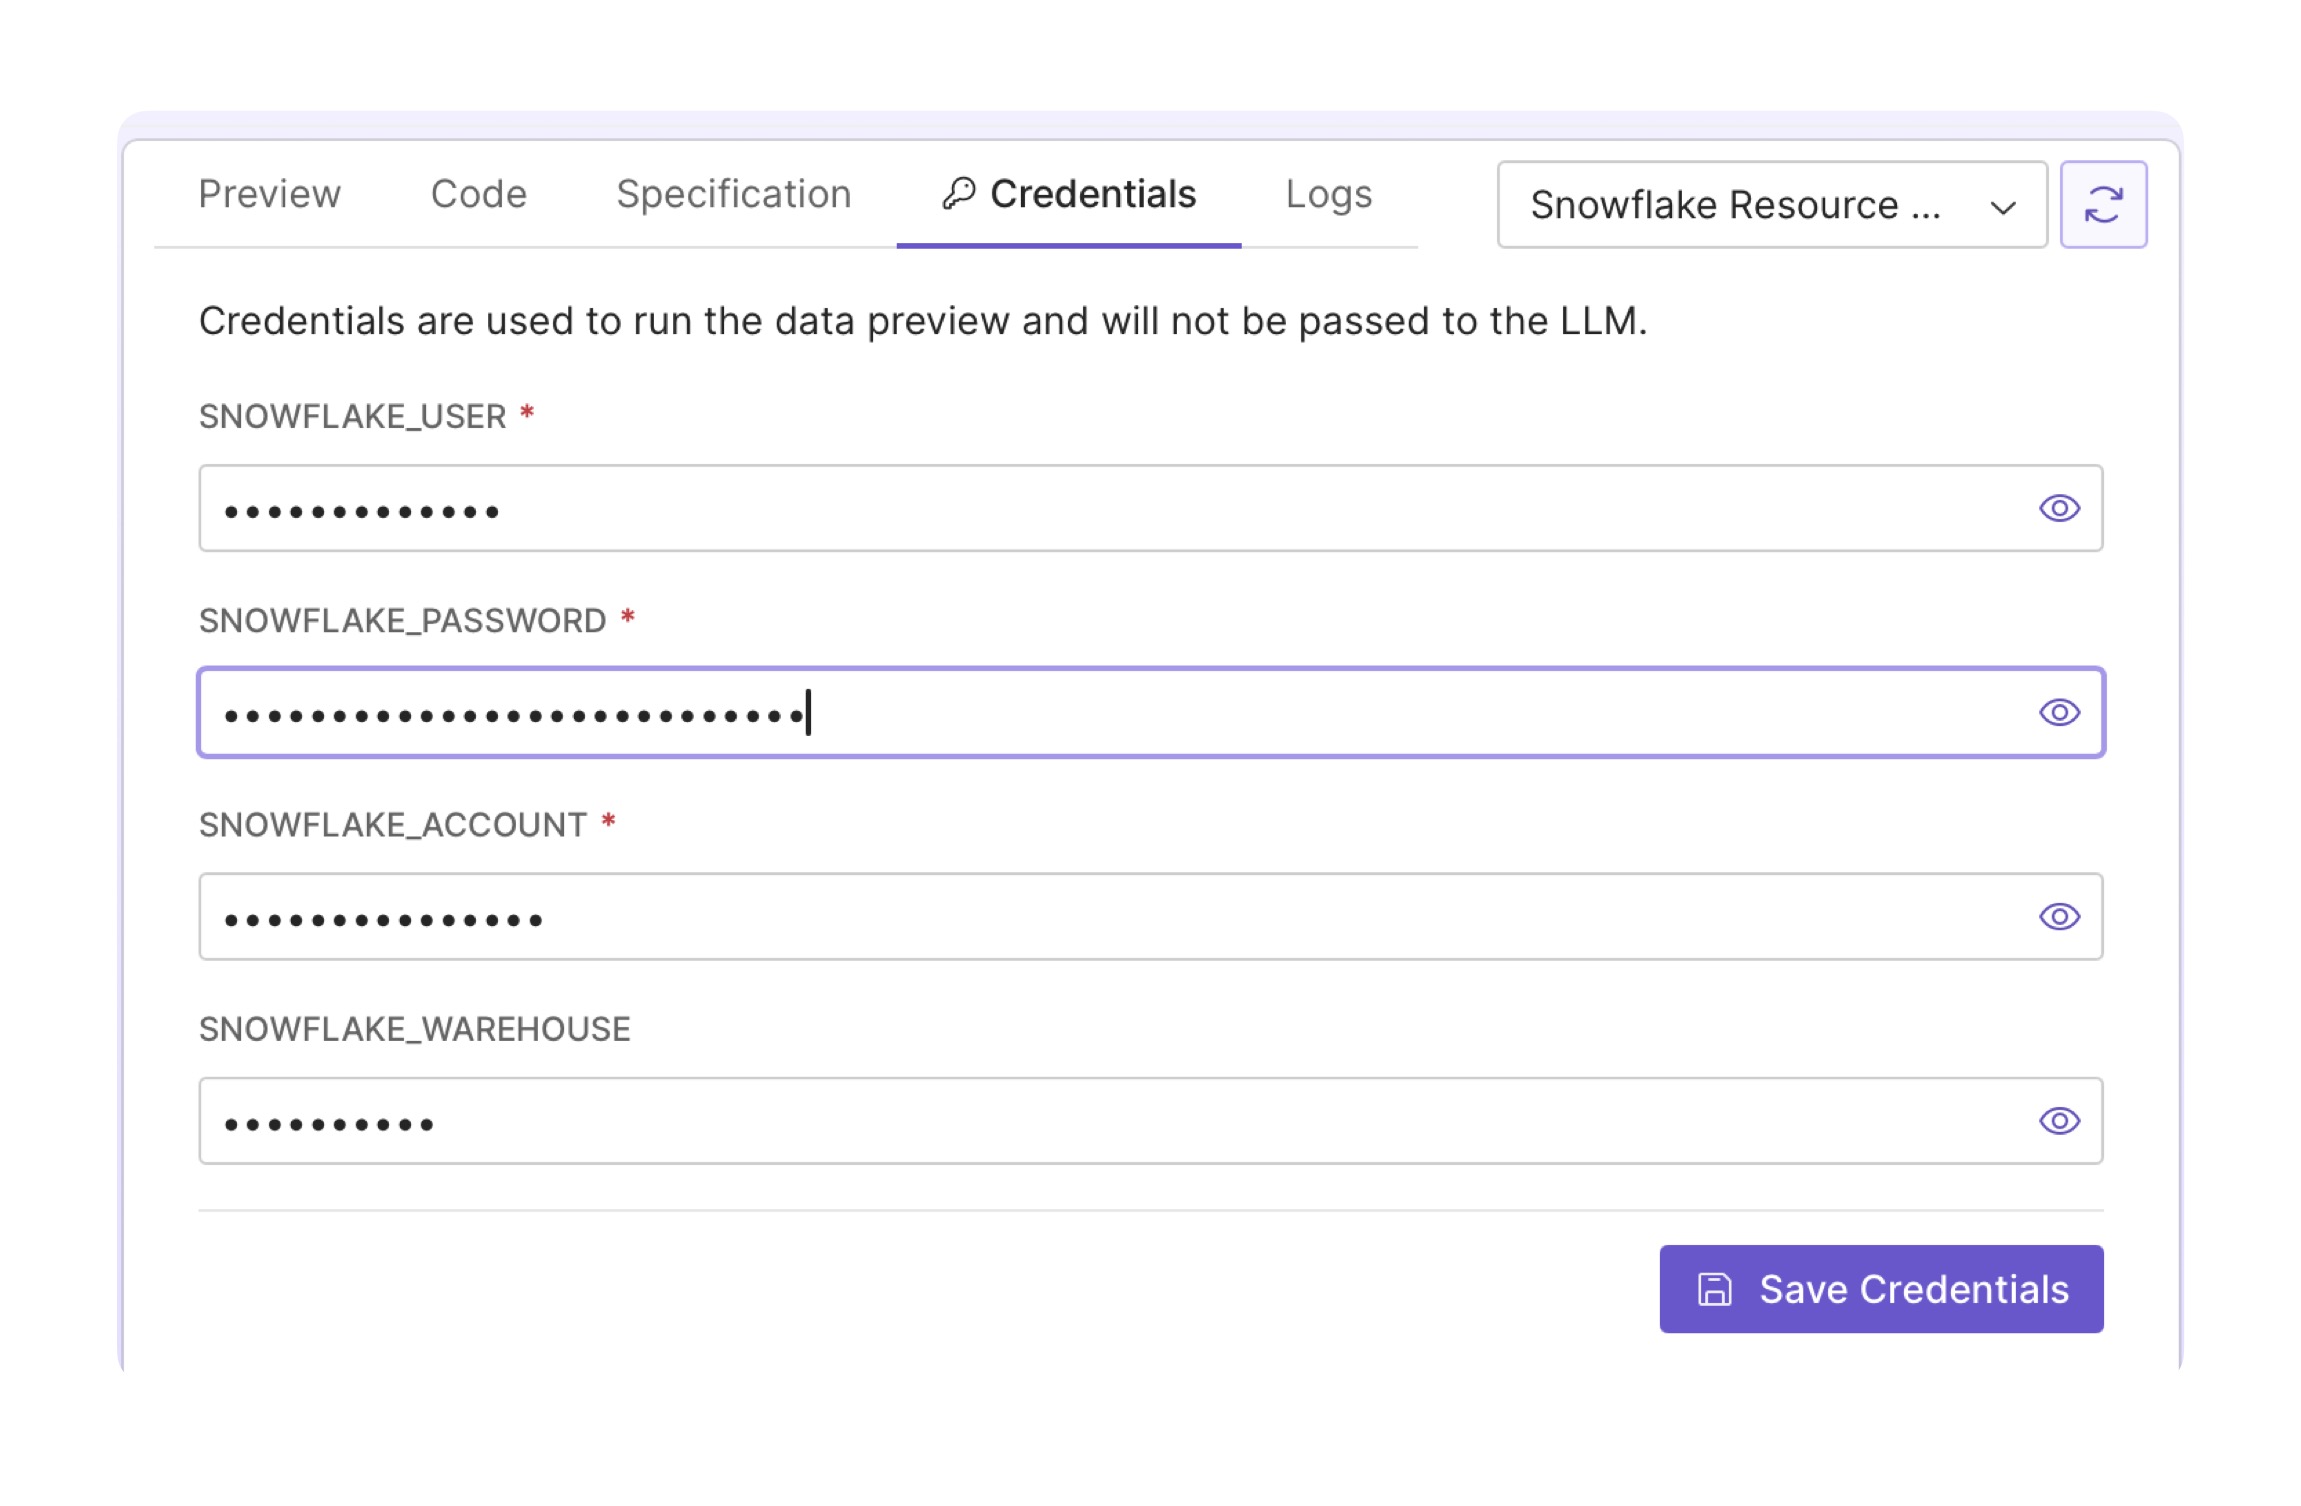
-
Using the chat feature on the left side of the screen, answer Plotly Studio's questions so you can connect to your table of interest. In most cases you will have to guide Plotly Studio by telling it that you would like to connect to your
table namewith yourdatabase name. In our example, we ask Plotly Studio the following: `Please connect to the "ALL_STOCKS_5YR" table that is located in the "DASH_TUTORIALS_FINANCE" database'.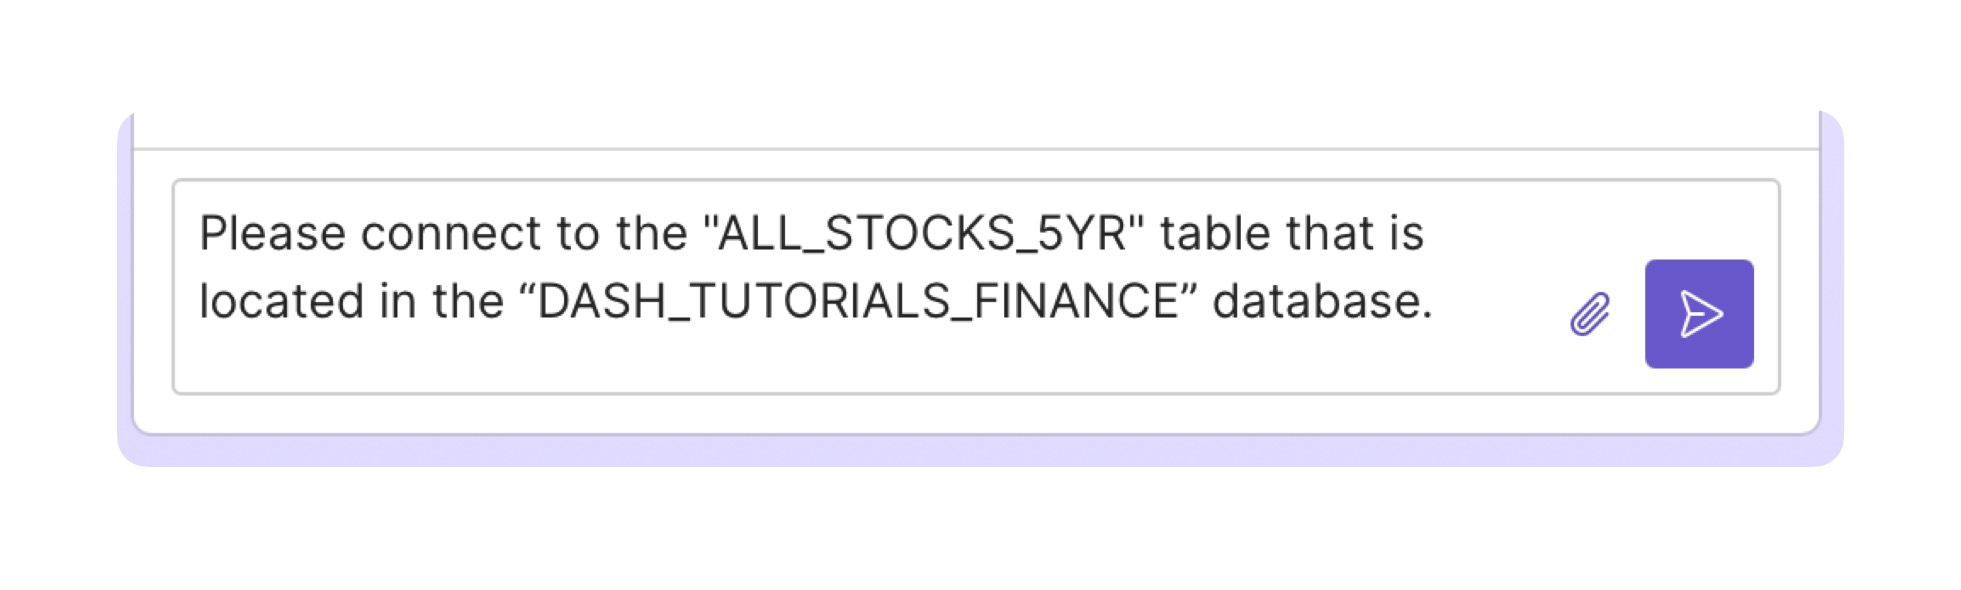
-
Once you see a preview of you table, cick the
Continuebutton to start building your dashbaord.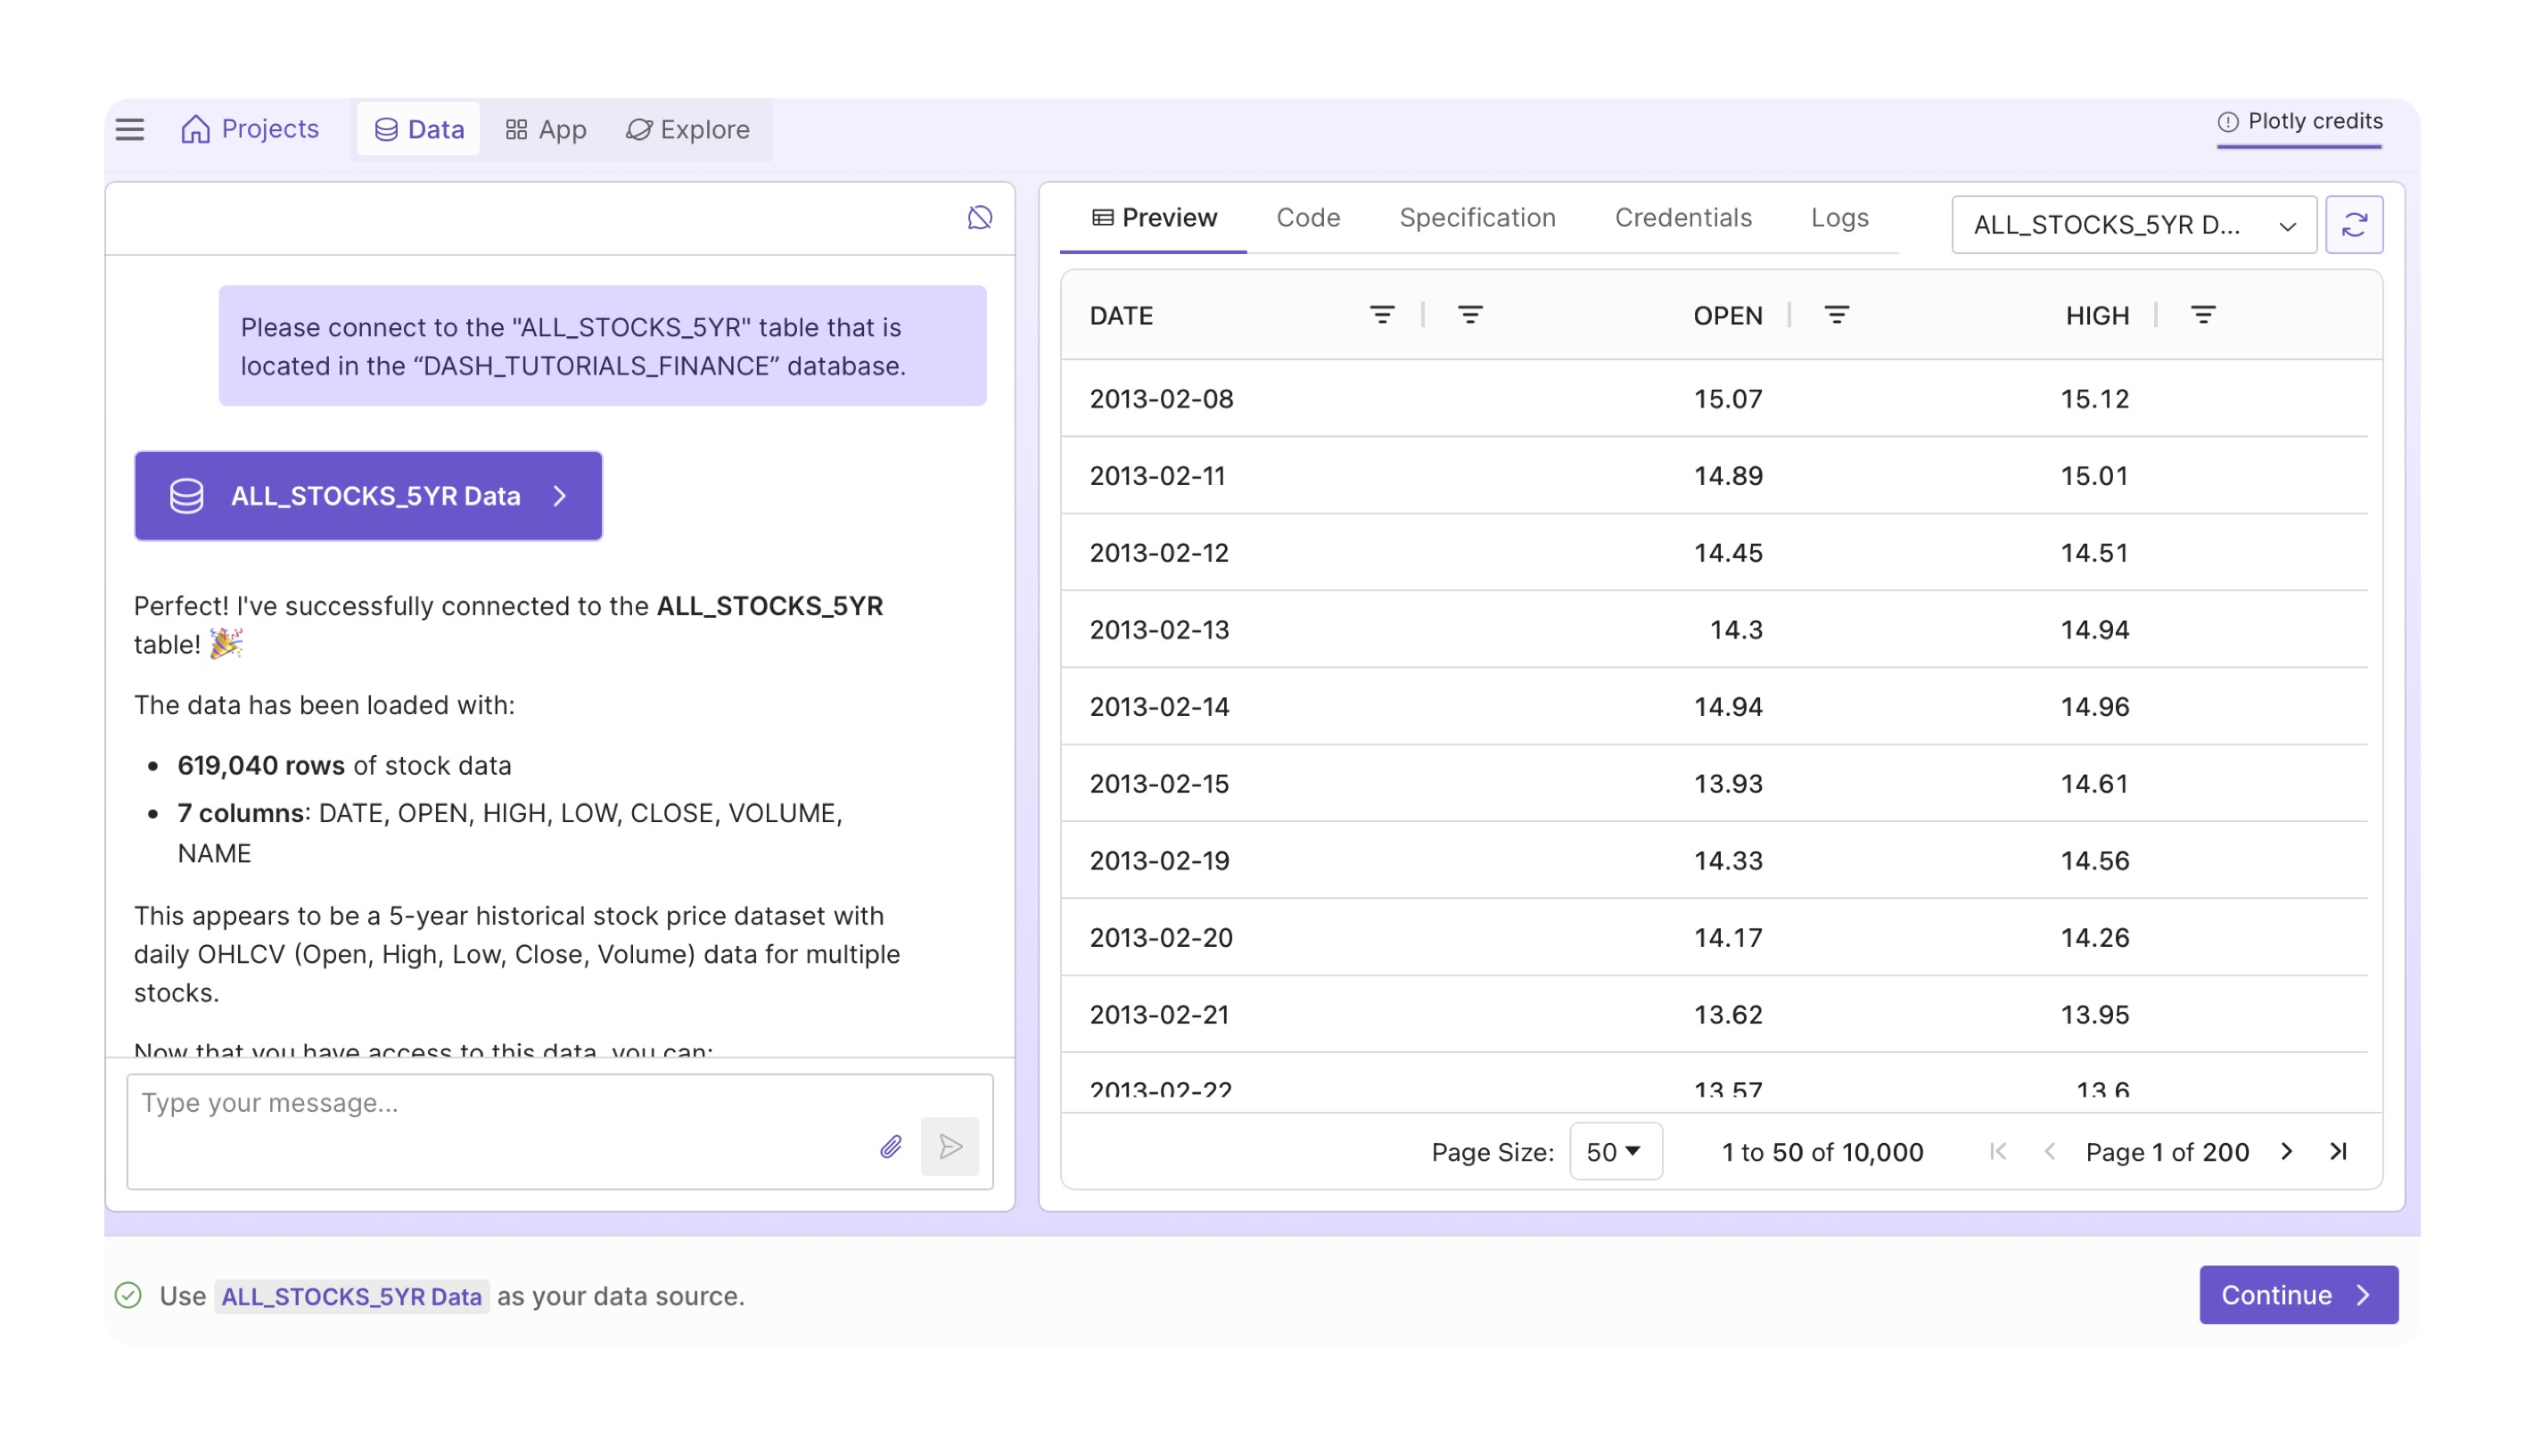
Build your Dashboard
-
Click the
Generate Chartsbutton to generate the first set of charts.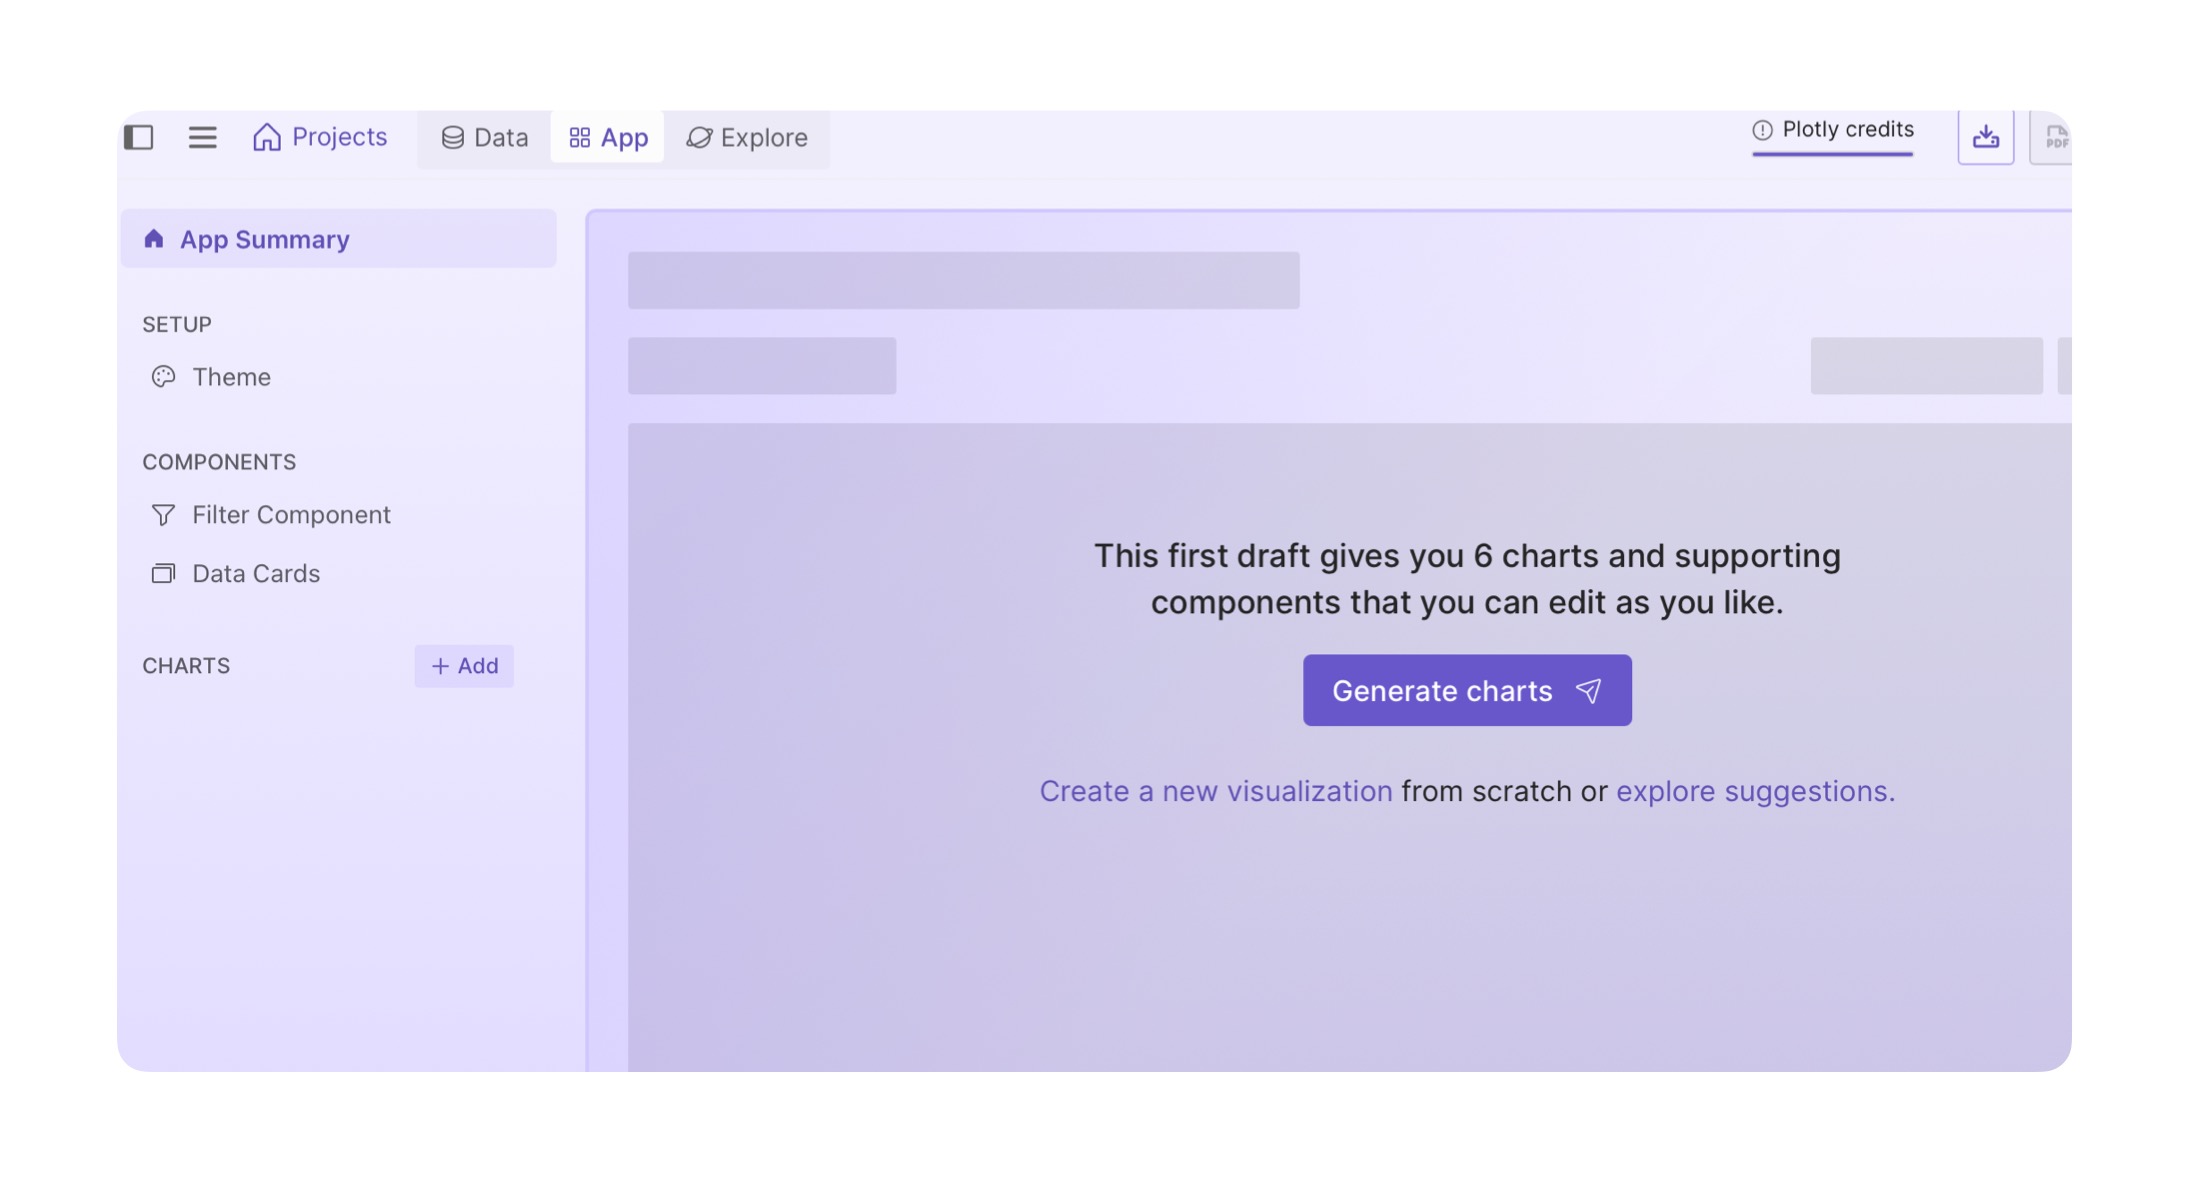
-
You'll see the charts generating with the spinner icon next to each chart, located on the left side of the screen. Once the spinner disappears, you can enter the chart and review it.
-
You can also edit the chart or the corresponding controls by updating the prompt in the
Editable Promptsection, then clicking the purple submit button.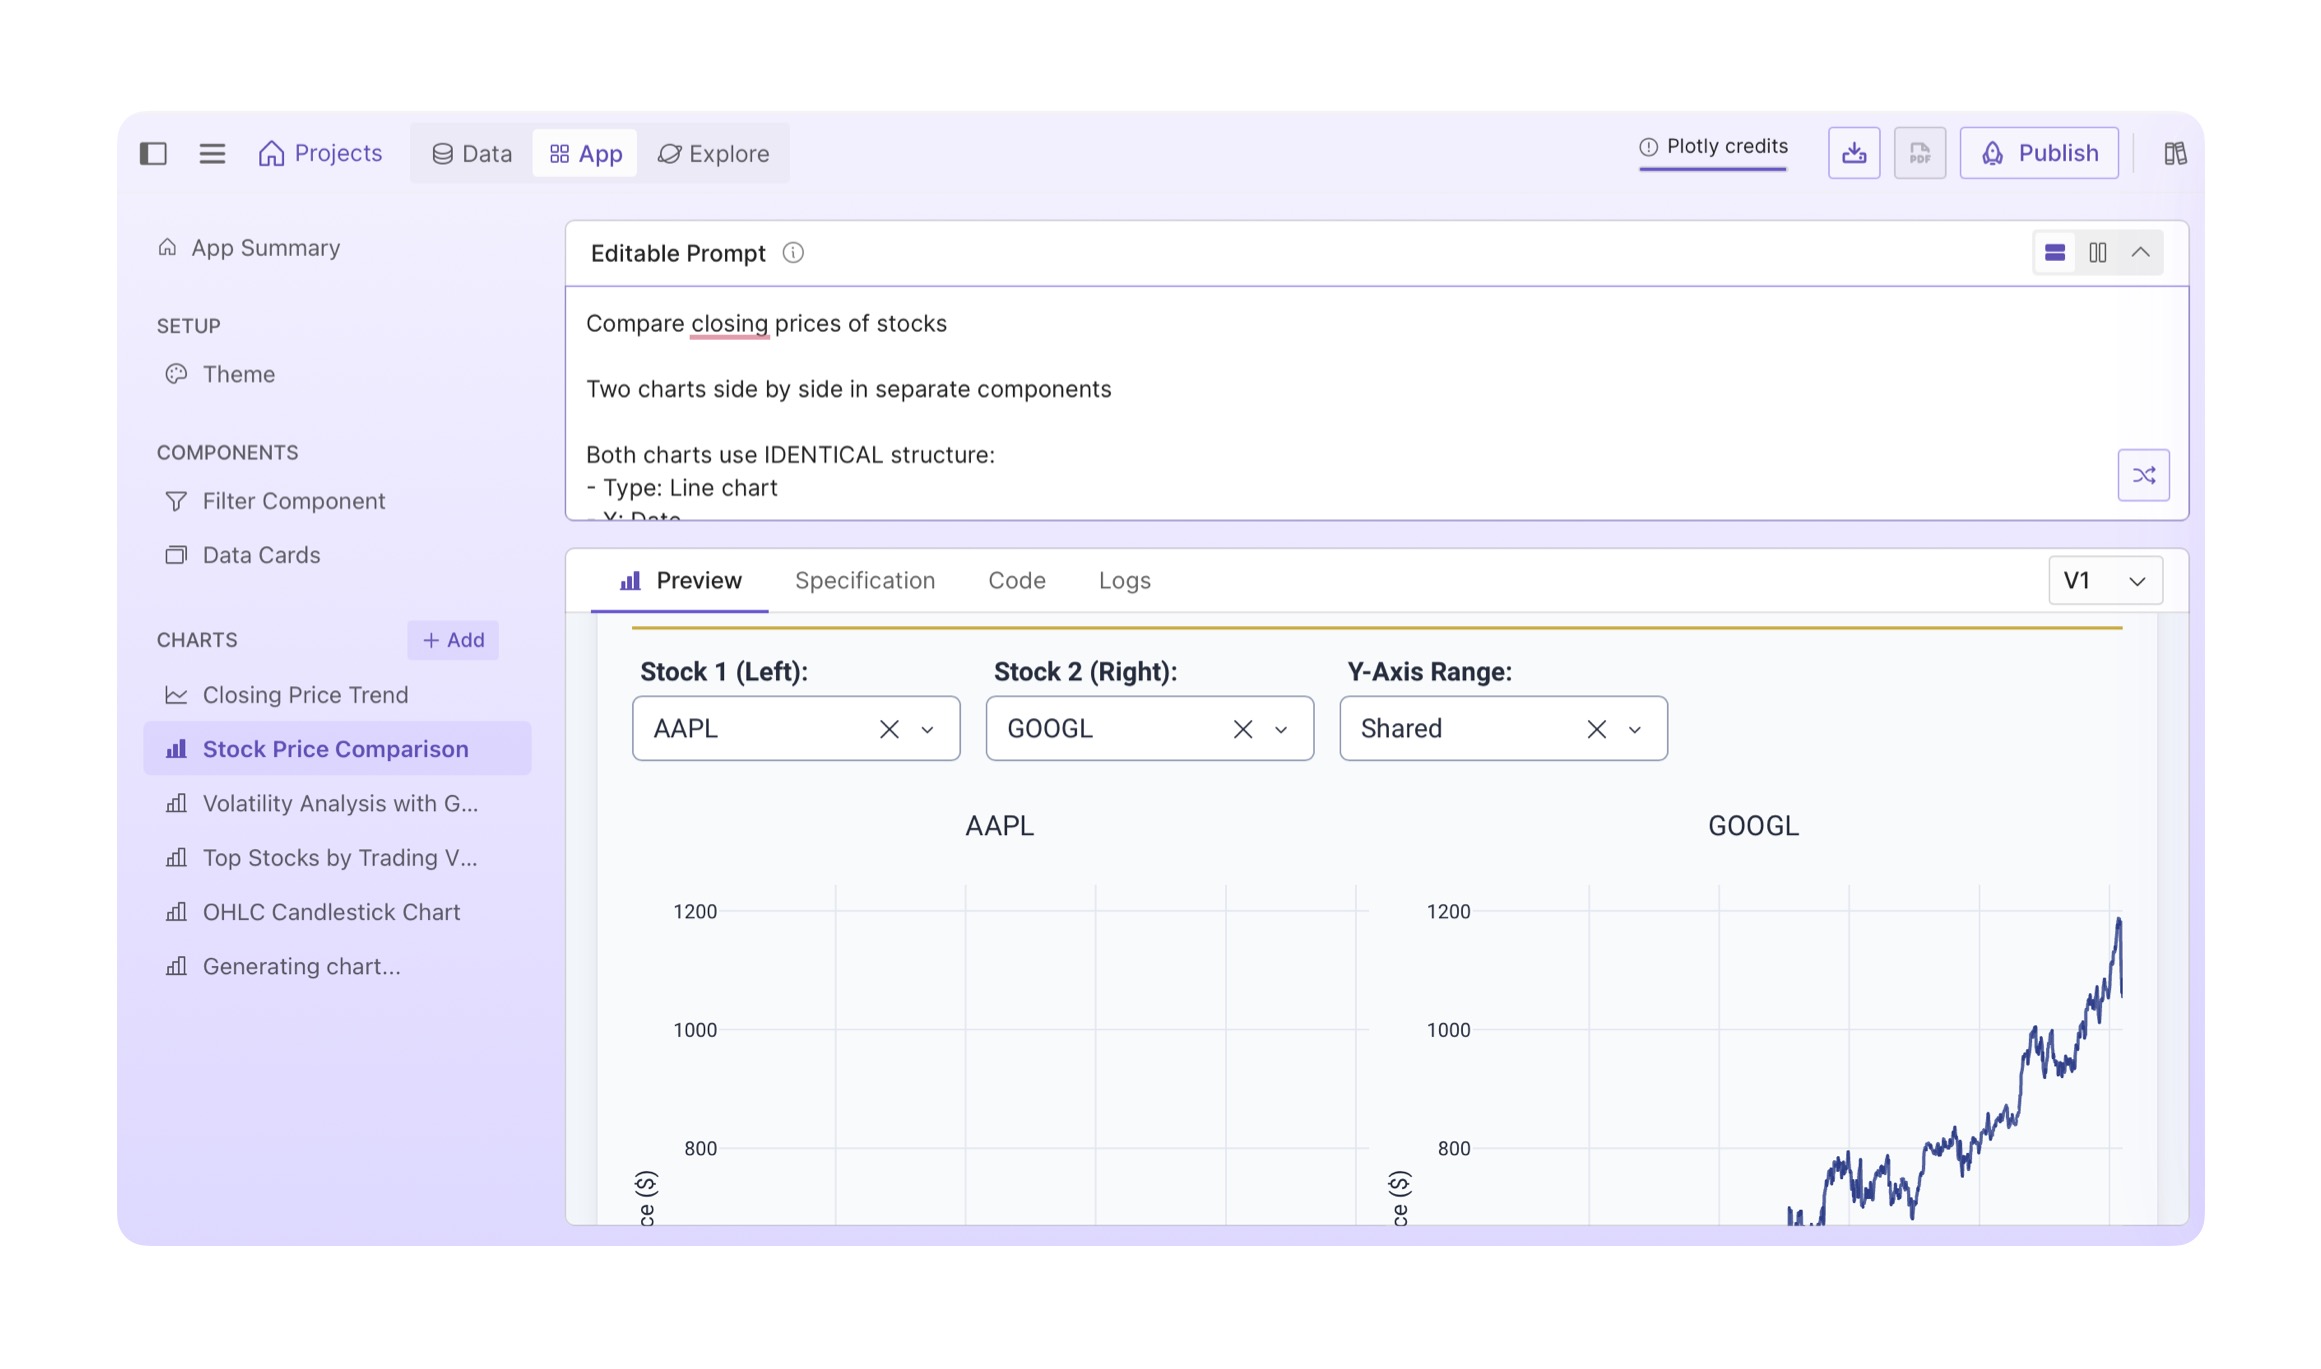
-
If you'd like suggestions for various other charts, simply go to the
Exploretab, located in the top left. And once you find a chart suggestion that interests you, click theGeneratebutton.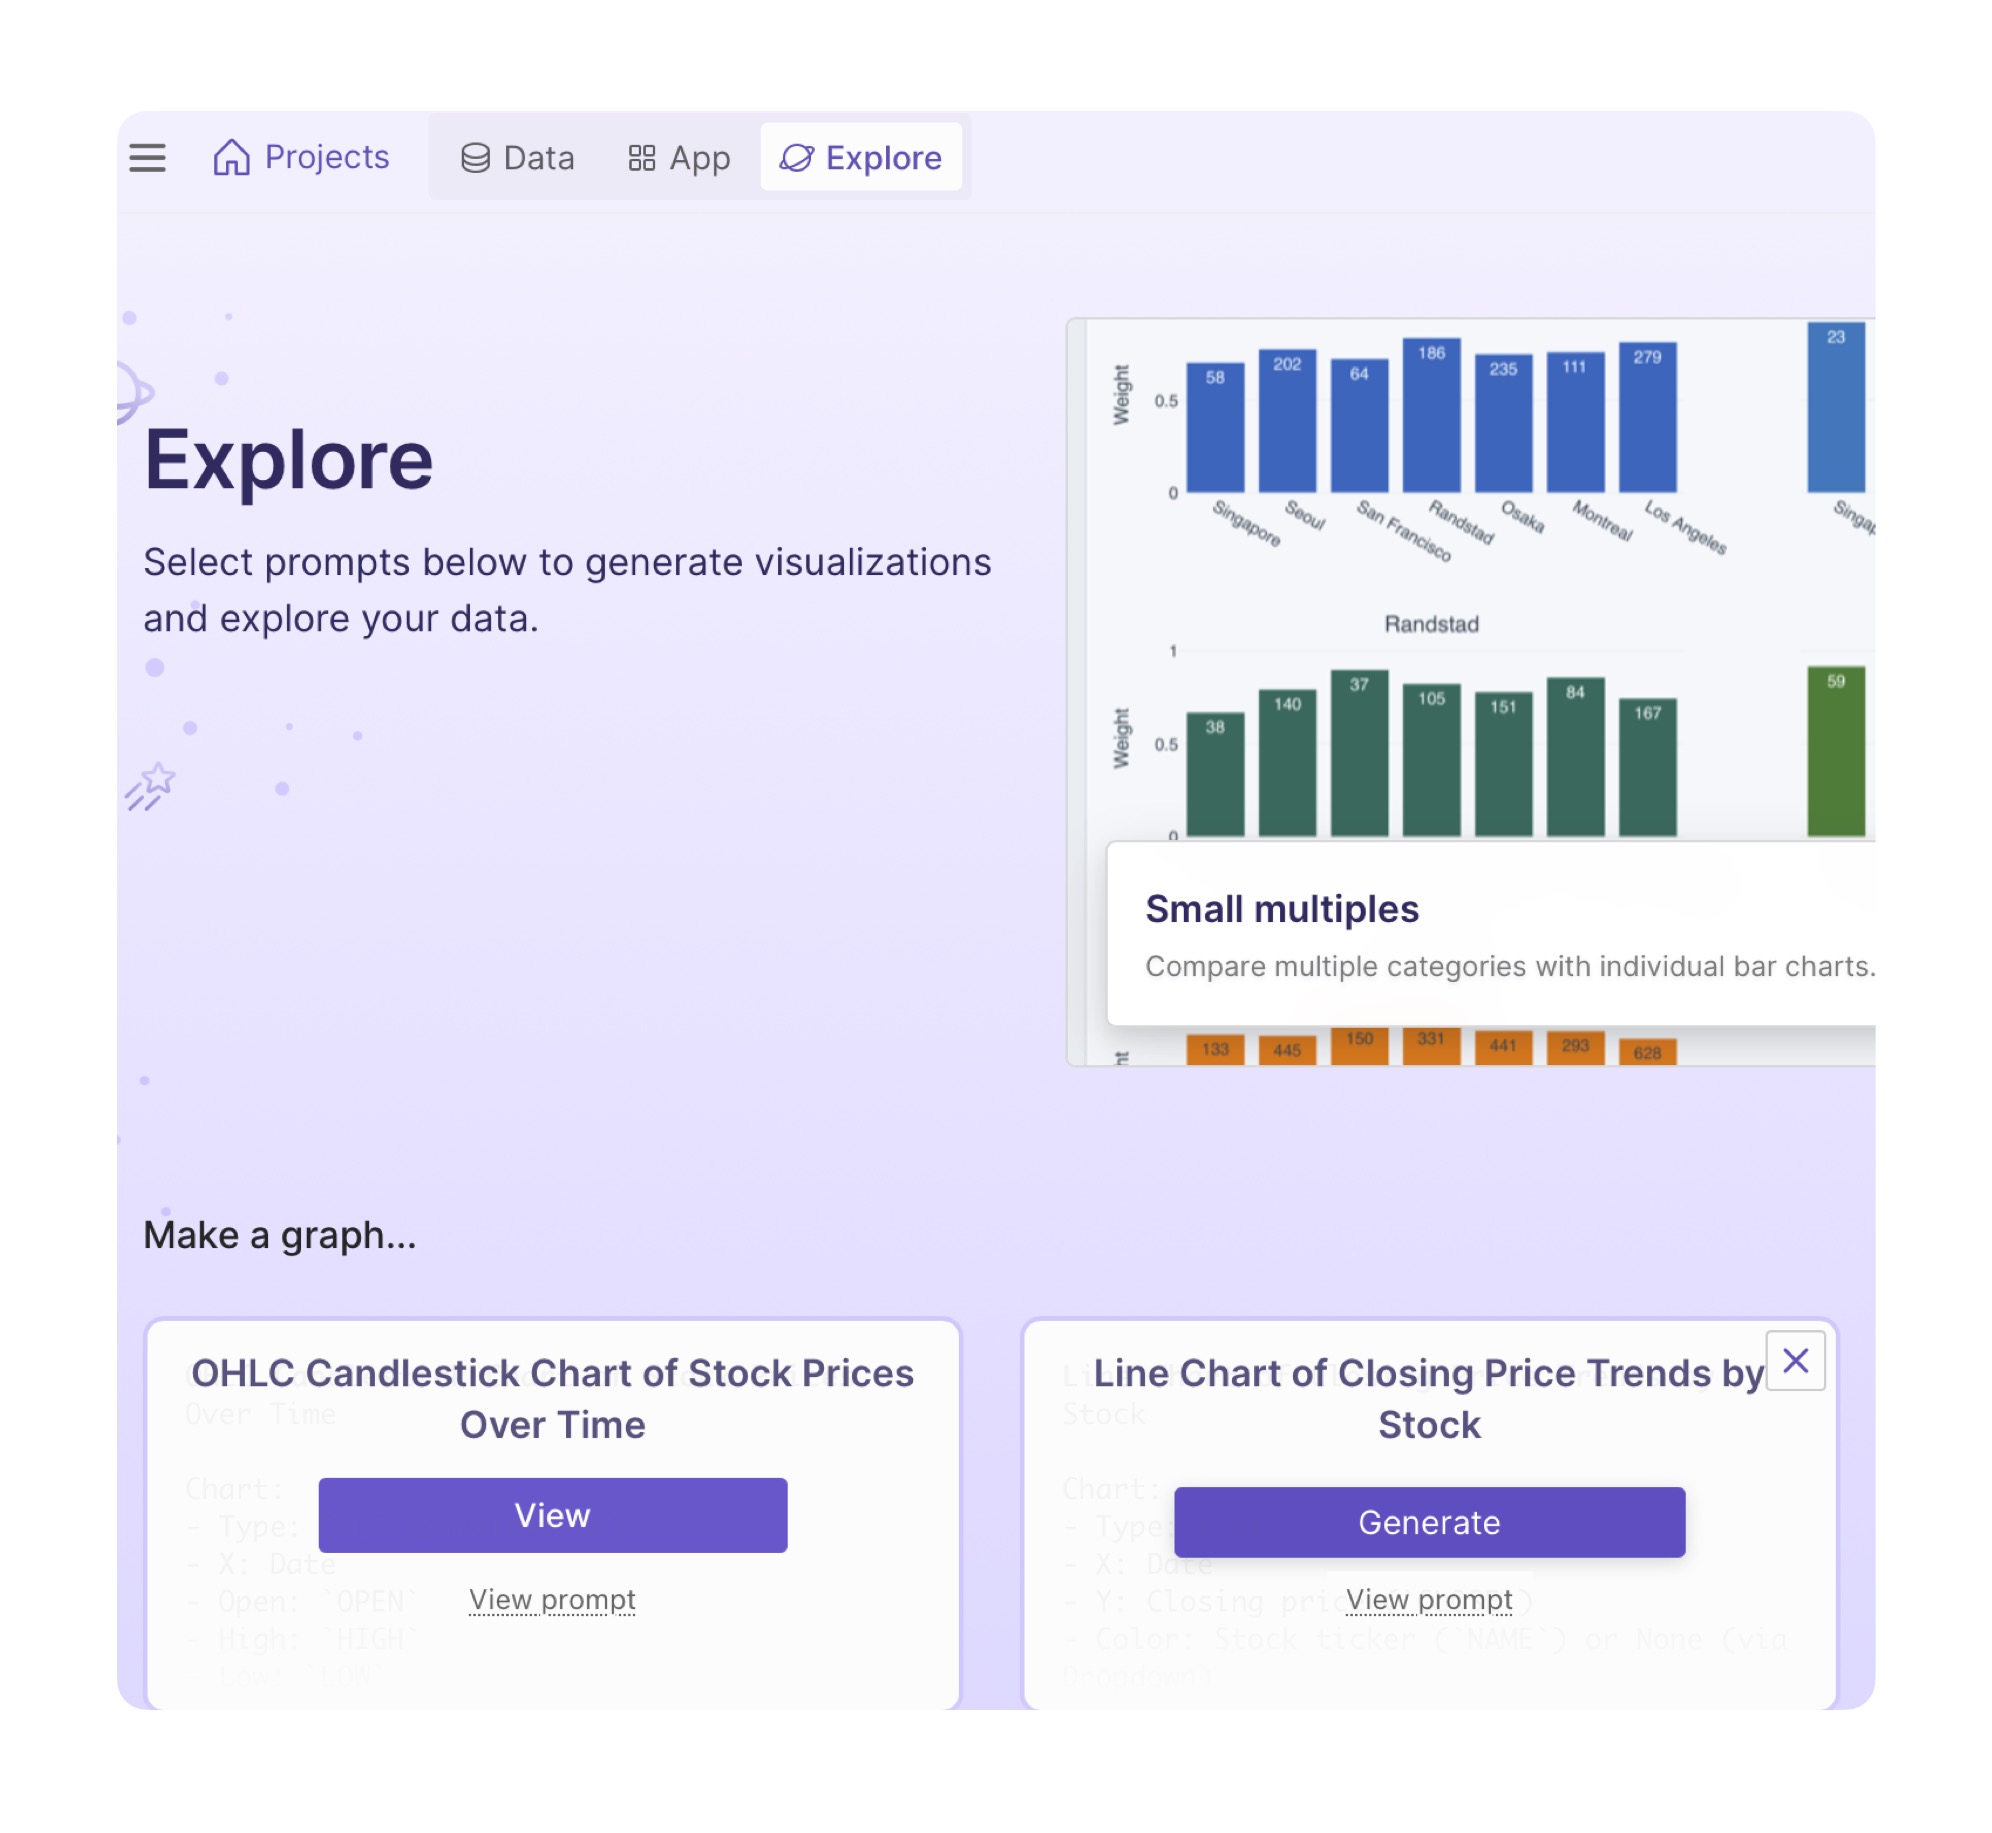
-
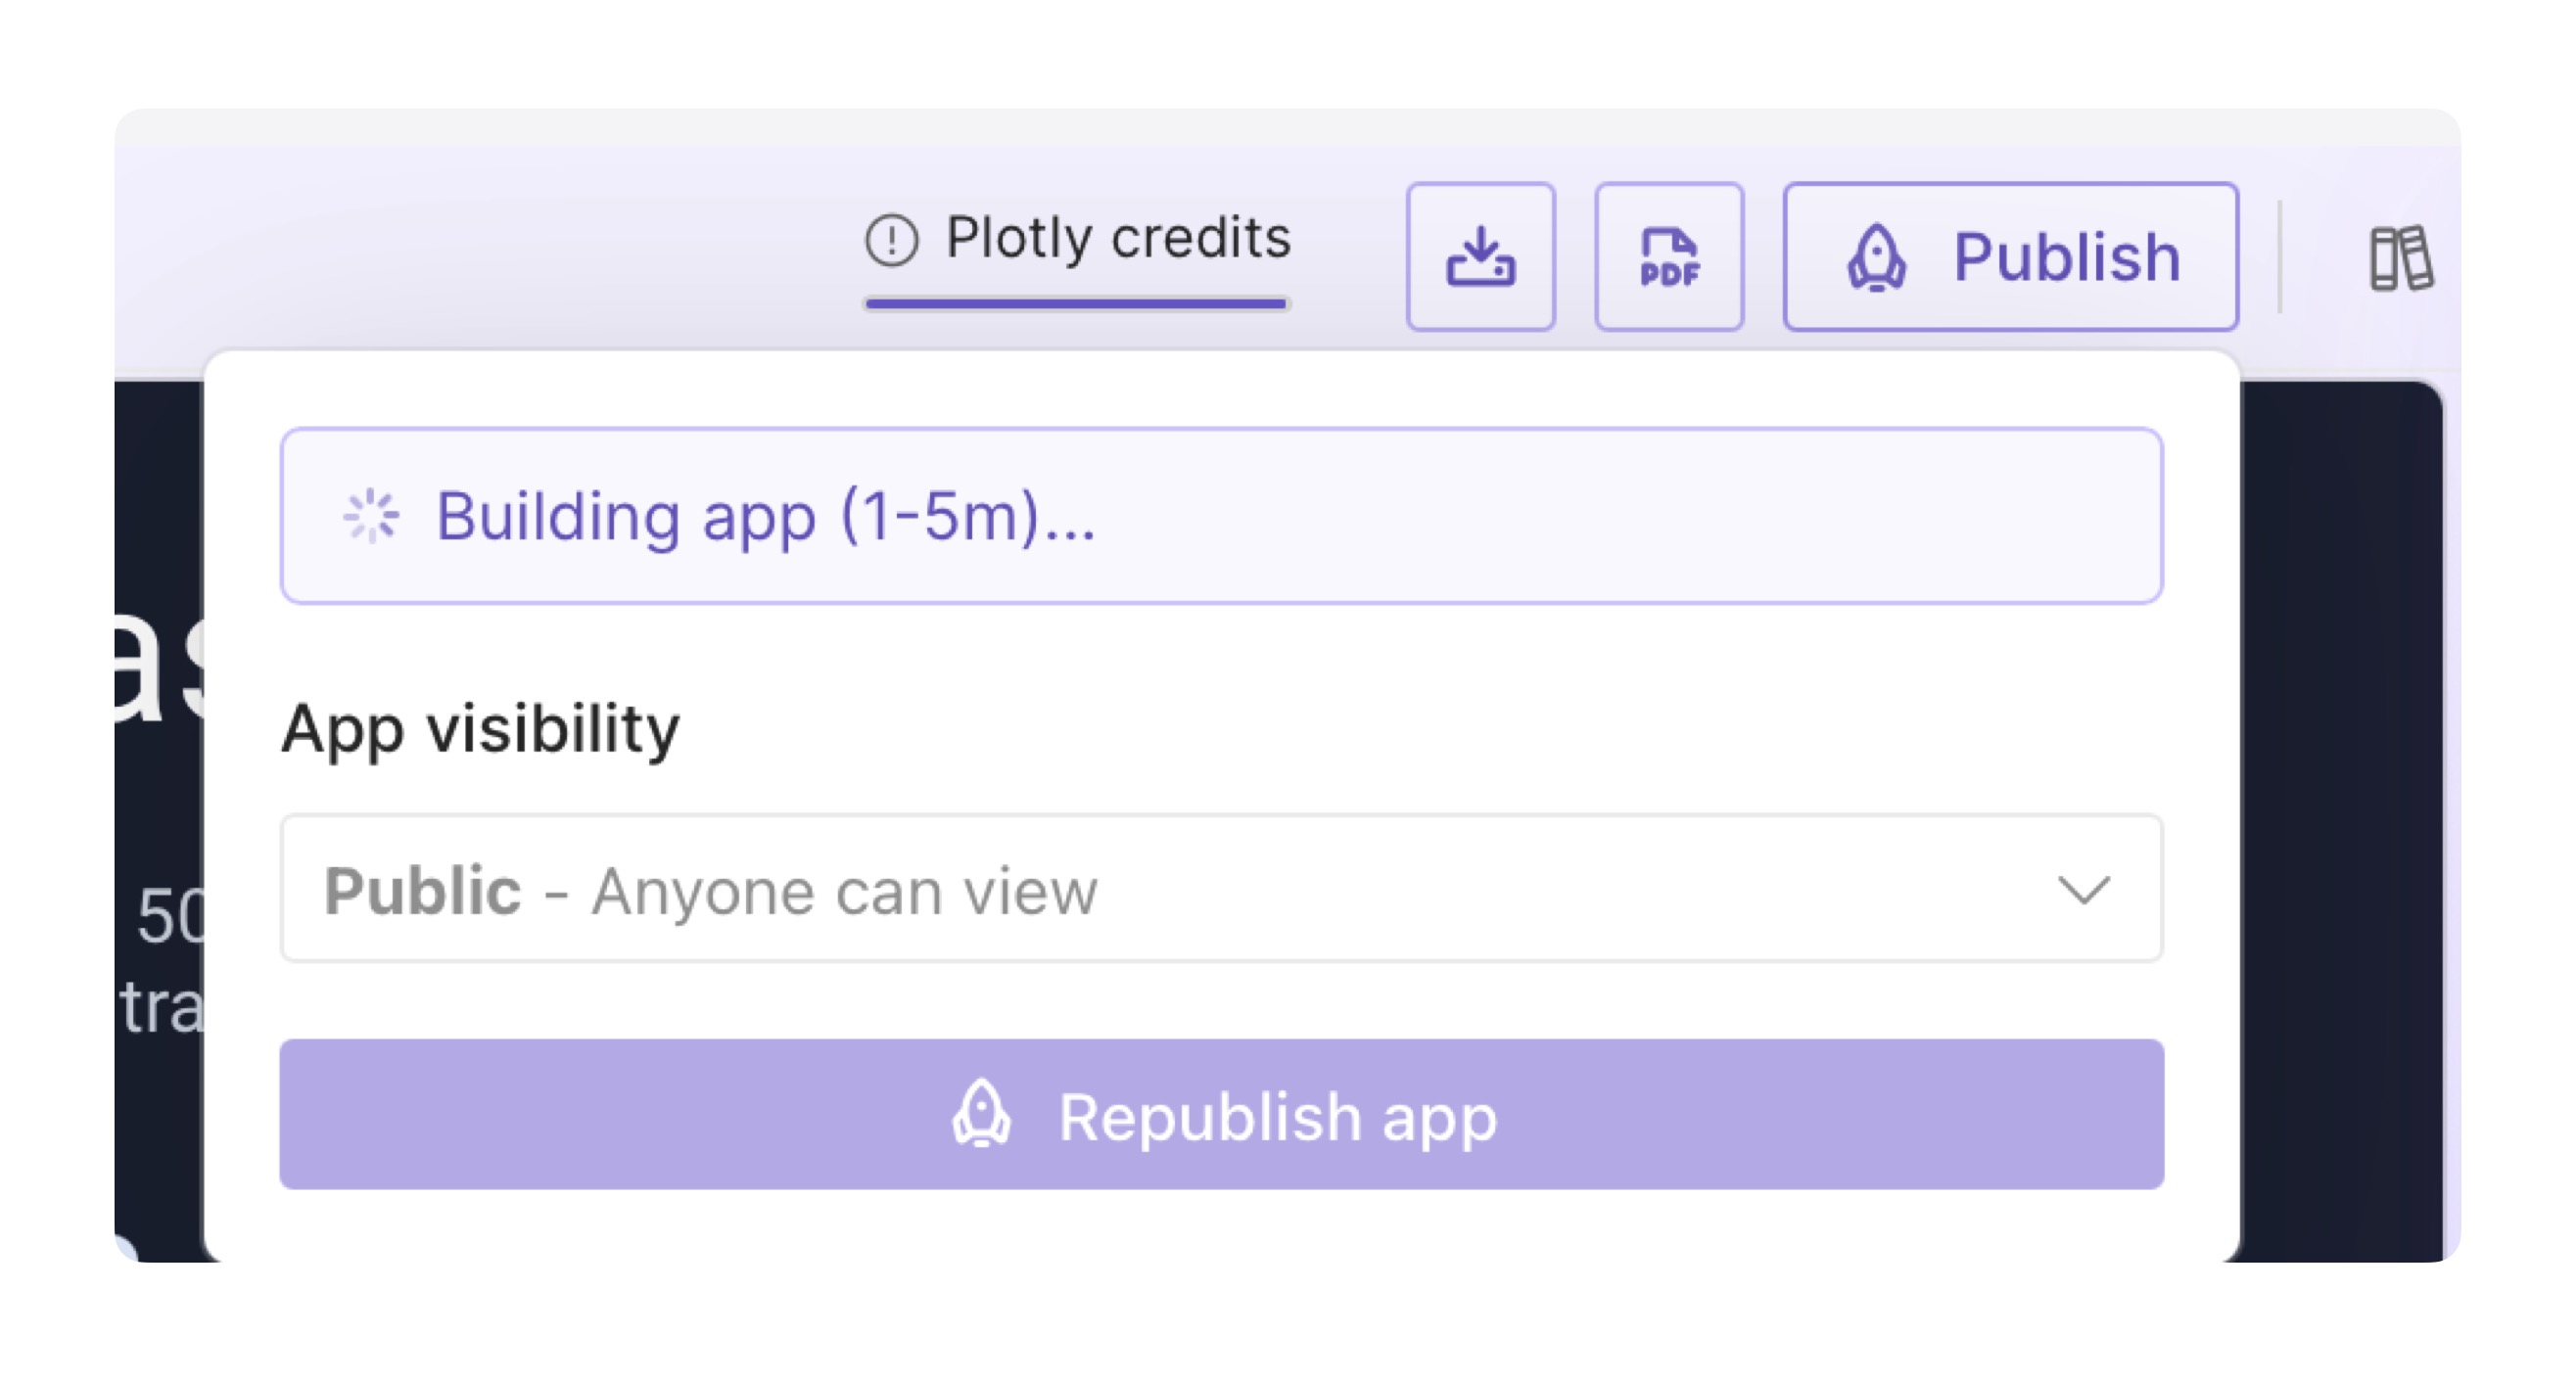
Go back to the
Apptab and review your app. Once you're happy with your app, click thePublishbutton, located in the top right. This will publish the app to the Cloud.
-
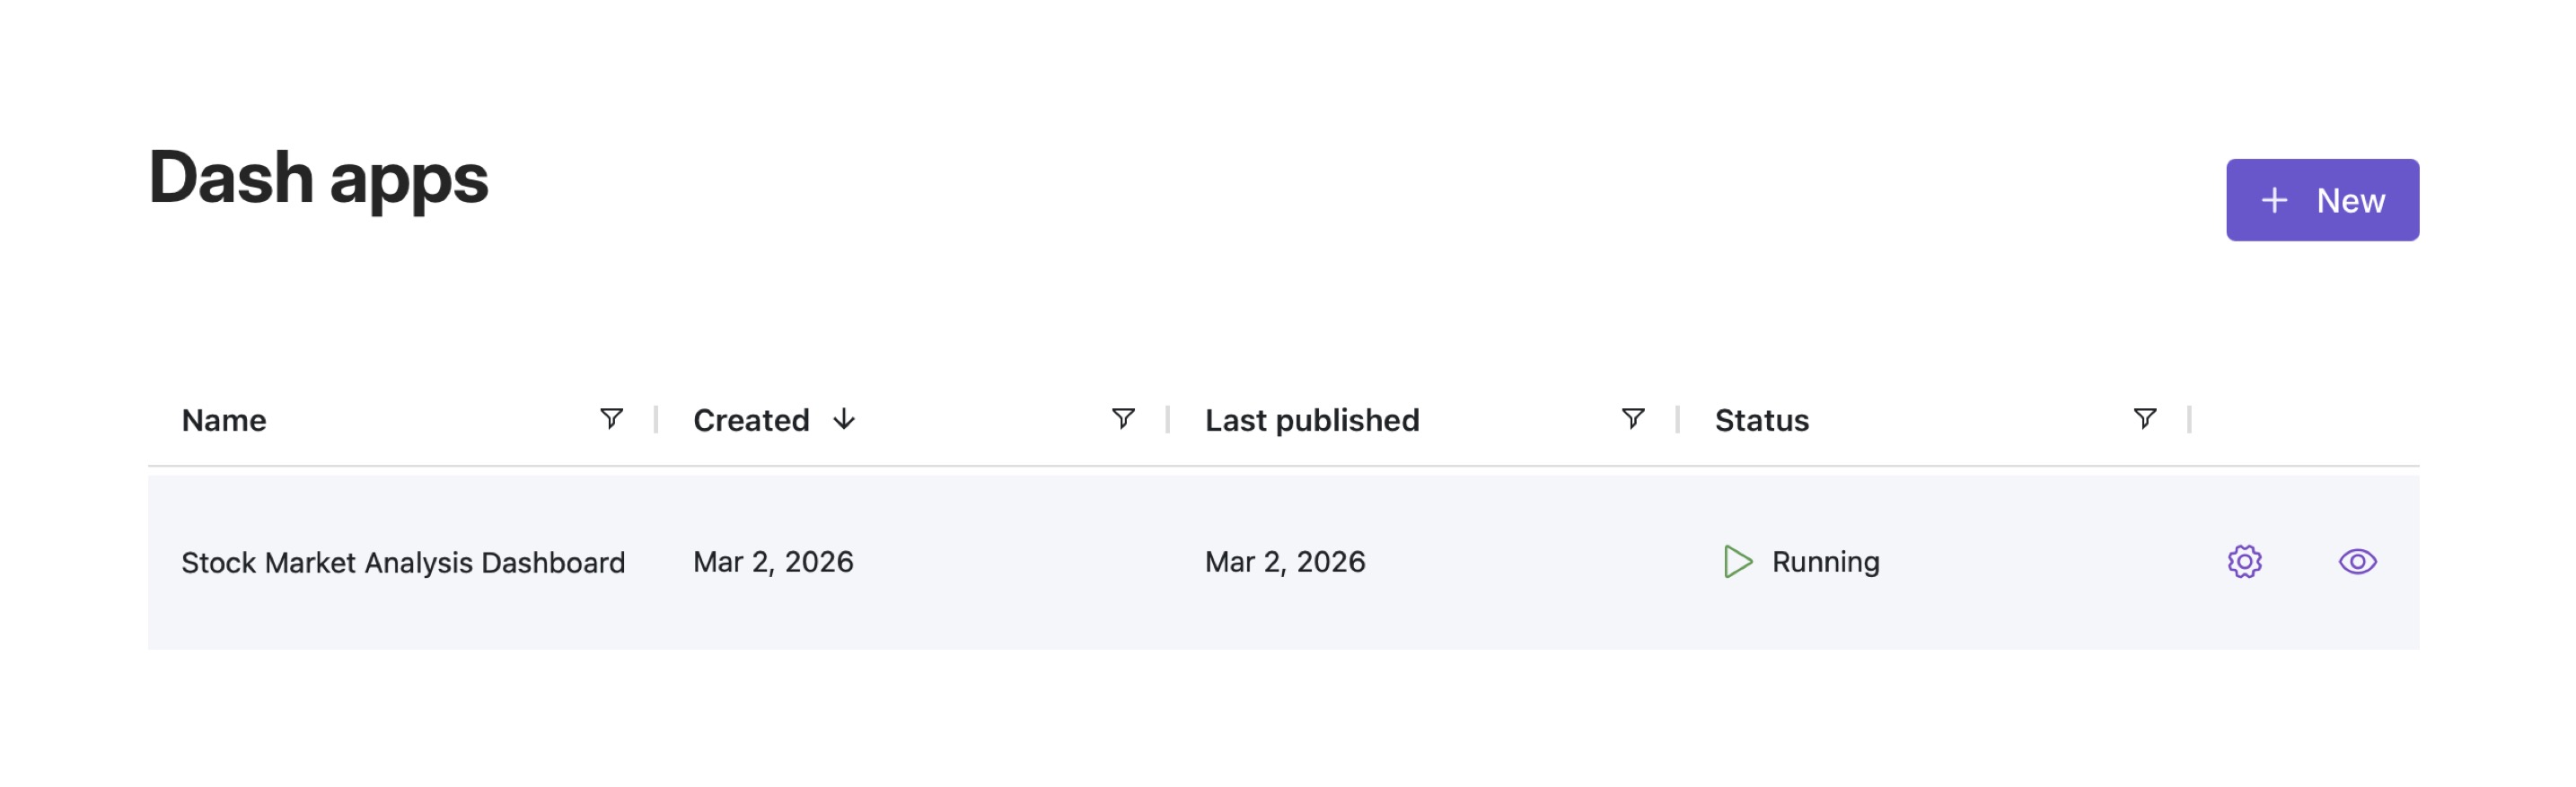
Share your app by going to Plotly Cloud and clicking the eye icon next to your app name.
This content is provided as is, and is not maintained on an ongoing basis. It may be out of date with current Snowflake instances