Data Vault Techniques on Snowflake: Snowsight Dashboards for Data Vault 

Snowflake continues to set the standard for data in the cloud by taking away the need to perform maintenance tasks on your data platform and giving you the freedom to choose your data model methodology for the cloud. A key component of any business is not only the ability to decide on strategic goals but also to execute those goals. The success of the execution is defined by measure, what to measure, and how to measure it. Snowsight is a graphical user interface with the ability to build simple custom dashboards over the measures of your data.
Not only can you build your own dashboards over your Snowflake account metrics, but you can also define dashboards over your own custom test framework. In this blog post, we will do just that: define the automated test framework for Data Vault, and then use the outcome of that framework to build some custom dashboards.
This is part two of the series. Here is the upcoming blog catalogue:
- Immutable Store, Virtual End-Dates
- Snowsight dashboards for Data Vault
- Point-in-time constructs and join trees
- Querying REALLY big satellite tables
- Streams and Tasks on views
- Conditional multi-table INSERT, and where to use it
- Row access policies and multi-tenancy
- Hub locking on Snowflake
- Virtual warehouses and charge-back
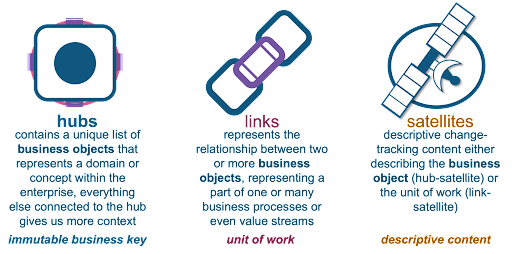
Below is a reminder of the data vault table types:
We will extend the orchestration animation we introduced in the previous blog post with a test suite.
What Are We Testing?
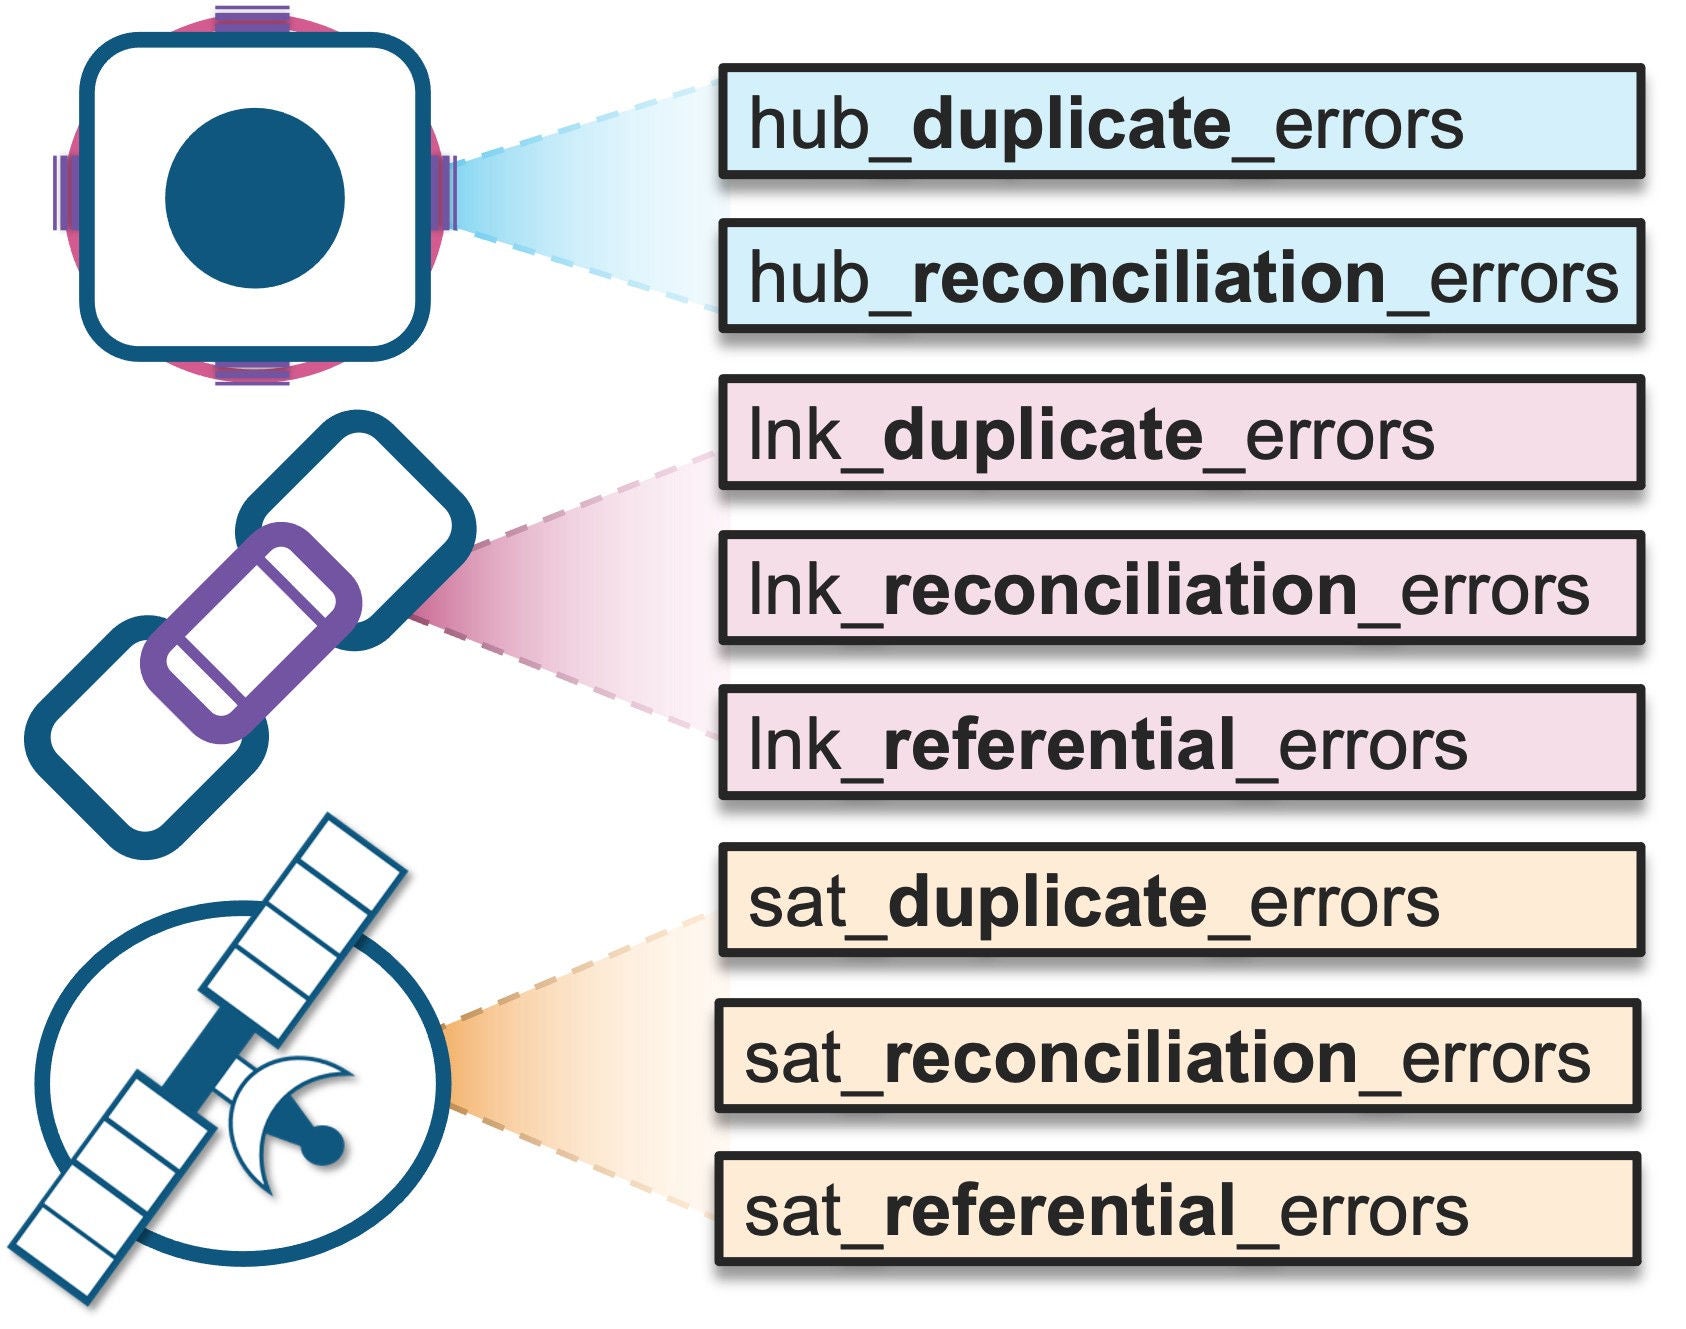
The test framework is intended to run immediately after the respective data vault tables have been loaded. These are categorized as:
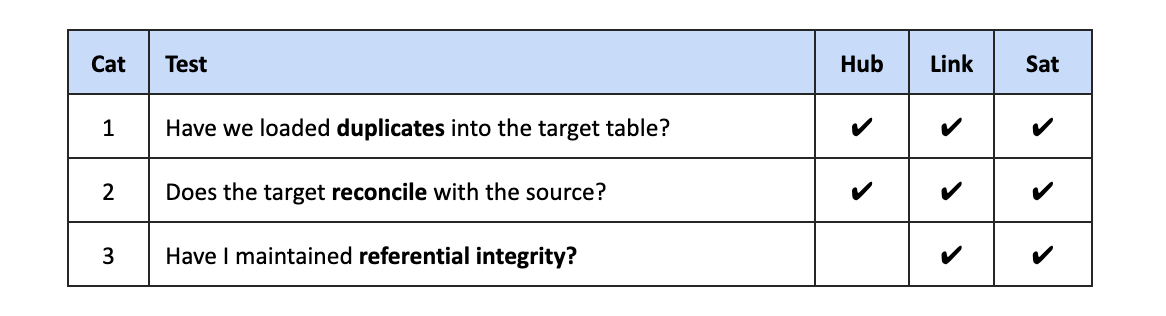
- A hub and link table are unique lists. The satellite table must be unique by the parent key and load date, where the parent key is either the hub-hash-key for a hub table or a link-hash-key for the link table.
- A source file/table is modeled into respective hubs, links, and satellites, and therefore should reconcile after each load.
- The hash-key in a hub-satellite table must exist in the parent hub table. The hash-key in a link-satellite table must exist in the parent link table. Furthermore, a hub-hash-key in a link table must exist in the respective parent hub table(s).
The reason these tests are necessary is because within Snowflake you can define primary keys, foreign keys, and uniqueness constraints—but Snowflake does not enforce them. Why bother allowing for these definitions in the first place? Two answers:
- It makes it easier to migrate from legacy data platforms
- This metadata is useful for data modeling tools to use as a base for reverse engineering and for BI tools to know the implied relationships between tables
Snowflake has taken the view that applying such constraints in fact constrains the time to value of analytics. If you can guarantee referential integrity without defining index structures, then you have slimmed down the need for maintenance of your platform. Data model constraints are instead built into prudent data pipelines themselves. The outcome of the tests is to build confidence in what we have deployed.
Test Patterns
Like the standard set of Data Vault table types, we can define a standard set of test scenarios (as above) and tables to store those test outcomes.
What are they and what do they contain?
In addition to testing for data integrity issues, we can also store:
- New key count: an indication of growth persisted by using a stream on each hub, link, and satellite table
- Staged key count: staged content whose metrics are stored in Snowflake’s metadata cache*
- Distinct key count: unique list of staged keys. This is optional because this query requires a full partition scan of the staged content.
- Total key count after load: data vault table metrics stored in Snowflake’s metadata cache*
*Snowflake’s metadata cache is always up to date and does not require the use of a virtual warehouse to retrieve this metric.
With the metrics established, let’s now jump into dashboarding!
Snowsight Dashboards
Snowsight is Snowflake’s new graphical user experience that became generally available in March 2022. Along with auto-complete and a generally smooth interactive experience, the Snowsight interface allows a Snowflake account owner to:
- Develop Snowflake native SQL in worksheets and manage worksheets under folders
- Load and unload small(ish) data to and from Snowflake
- Monitor and analyze queries and visually interface with stored procedures, data pipelines, user-defined functions, and more
- Monitor Snowflake account usage and (if enabled) organization usage
- Graphically create and deploy account-level objects such as users, roles, virtual warehouses, tasks, and so on
- Create and manage database and schemata and their objects
- Create and manage data sharing and look to the data marketplace for shared data
- Lodge support tickets directly through the interface
You can build custom Snowsight dashboards to monitor various aspects of your account and use the same interface to interrogate your own data objects. Let’s see how by using the test framework.
Basic counts
A simple query to get the counts for all data vault tables; note the :daterange filter.
Simple counts tile
Error detection
If errors were to occur, they can easily be visualized. Below is a simulated error.
Error chart tile shows an error trend
A duplicate record error in the hub table indicates that multiple threads were attempting to load to that same hub table at the same time. Hub loaders are idempotent, but if two or more loaders are loading to the same table at the same time, the one thread will not be aware of the other thread attempting the same load to the same table. In another blog post, we will show how we can easily resolve this in Snowflake.

Error count tile shows the problem growing
Heat grid
A heat grid will color-code the metric with the highest number and visually show growth of a metric you pick; in this example, we are lining up hub_account against hub_customer tables where we can see hub_account is growing faster than hub_customer.
Heat grid tile for measuring table growth
Using custom filters
Earlier, we showed one of the Snowsight filters that is available by default: daterange. However, we can also create our own.
Using a custom filter, selecting a hub table
How to create a custom filter
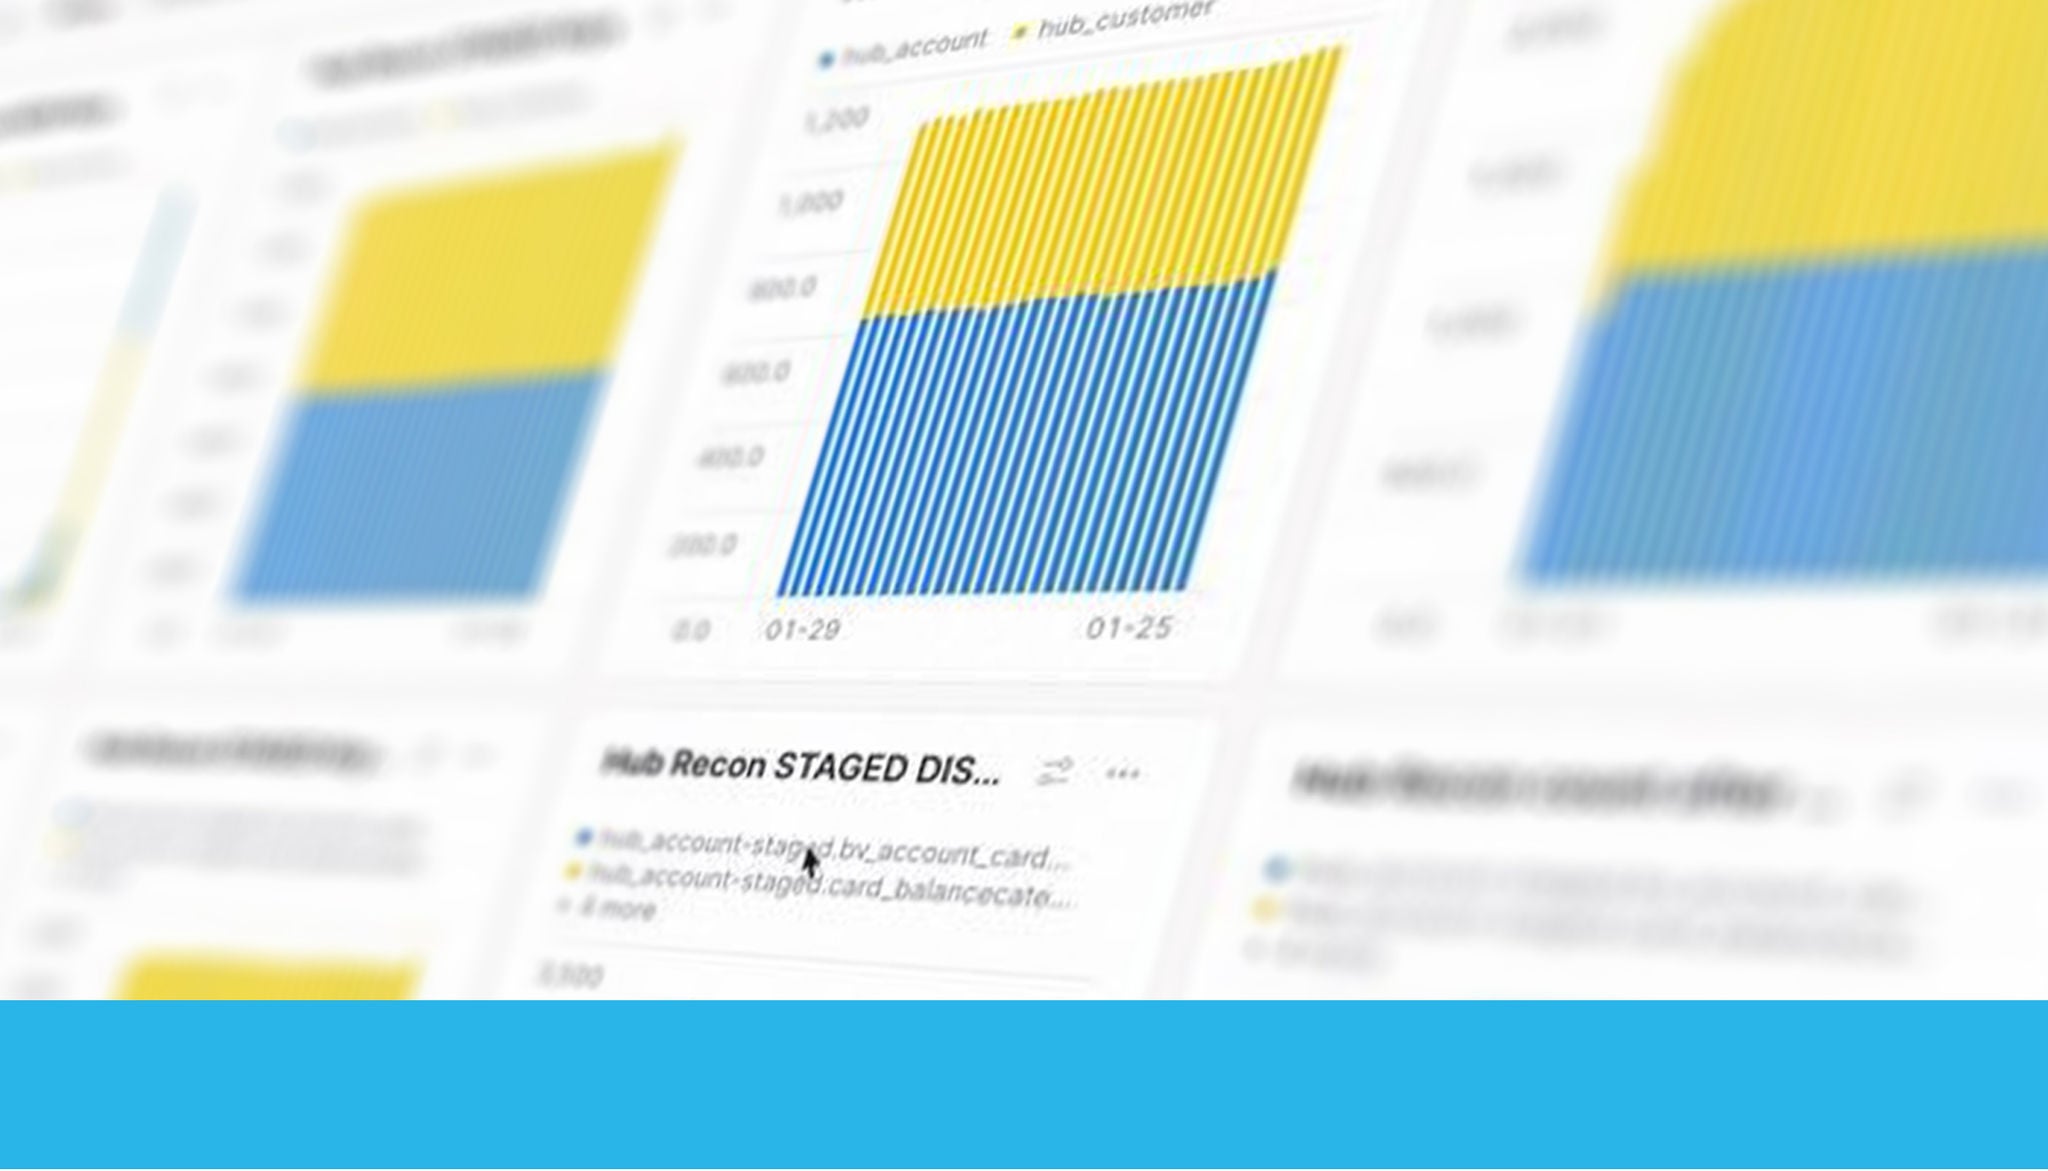
Bringing all the dashboards together
Finally, the above tiles are coagulated into multiple dashboards for grouping like tiles together.
Summary of all dashboards
Keep in mind, Snowsight is not intended to replace BI reporting software with its respective robust feature set. Snowsight gives you basic reporting capabilities without needing to set up additional software.
For example, BI tools used to monitor account usage on Snowflake include:
- Power BI: https://bit.ly/36EY9gw
- Tableau: https://tabsoft.co/3MjsuAo
- Looker: https://bit.ly/3L8Z6N9
- Qlik: https://bit.ly/3OxbRTy
- Sigma: https://bit.ly/3ECkoAe
- ThoughtSpot: https://bit.ly/38fpVQU


