
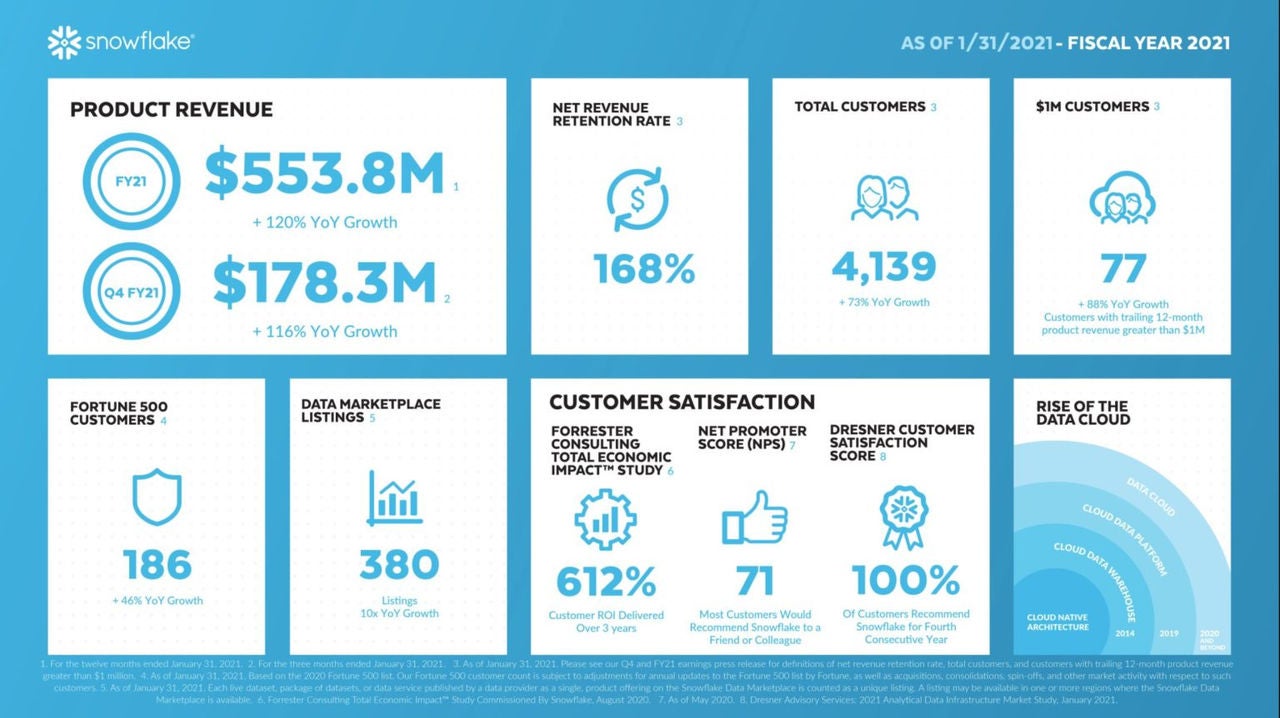
- Product revenue of $178.3 million in the fourth quarter, representing 116% year-over-year growth
- Remaining performance obligations of $1.3 billion, representing 213% year-over-year growth
- 4,139 total customers
- Net revenue retention rate of 168%
- 77 customers with trailing 12-month product revenue greater than $1 million
SAN MATEO, Calif. – Snowflake (NYSE: SNOW), the Data Cloud company, today announced financial results for its fourth quarter and full year of fiscal 2021, ended January 31, 2021.
Revenue for the quarter was $190.5 million, representing 117% year-over-year growth. Product revenue for the quarter was $178.3 million, representing 116% year-over-year growth. Remaining performance obligations were $1.3 billion, representing 213% year-over-year growth. Net revenue retention rate was 168% as of January 31, 2021. The company now has 4,139 total customers and 77 customers with trailing 12-month product revenue greater than $1 million. See the section titled “Key Business Metrics” for definitions of product revenue, remaining performance obligations, net revenue retention rate, total customers, and customers with trailing 12-month product revenue greater than $1 million.
“We finished our fiscal year with strong performance and reported triple-digit product revenue growth,” said Snowflake CEO, Frank Slootman. “Remaining performance obligations showed a robust increase year-on-year, reflecting strength in sales across the board. Coupled with this rapid growth, we saw improving operating efficiency while expanding our footprint globally. These results indicate that customers across multiple industries rely on the Snowflake Data Cloud to mobilize their data and enable breakthrough data strategies.”
Fourth Quarter Fiscal 2021 GAAP and Non-GAAP Results:
The following table summarizes our financial results for the fourth quarter of fiscal 2021:
|
Fourth Quarter Fiscal 2021 GAAP Results |
|
Fourth Quarter Fiscal 2021 Non-GAAP Results(1) |
||
|
Amount (millions) |
Year/Year Growth |
|
|
|
Product revenue |
$178.3 |
116% |
|
|
|
|
|
|
|
|
|
|
Amount (millions) |
Margin |
|
Amount (millions) |
Margin |
Product gross profit |
$114.5 |
64% |
|
$125.3 |
70% |
Operating loss |
($200.4) |
(105%) |
|
($46.0) |
(24%) |
Net cash provided by operating activities |
$19.6 |
|
|
|
|
Free cash flow |
|
|
|
$7.3 |
4% |
Adjusted free cash flow |
|
|
|
$17.3 |
9% |
(1) We report non-GAAP financial measures in addition to, and not as a substitute for, or superior to, financial measures calculated in accordance with GAAP. See the section entitled “Statement Regarding Use of Non-GAAP Financial Measures” for an explanation of non-GAAP financial measures, and the table entitled “GAAP to Non-GAAP Reconciliations” for a reconciliation of GAAP to non-GAAP financial measures.
Note: Fiscal year ends January 31. Numbers are rounded for presentation purposes.
Full-Year Fiscal 2021 GAAP and Non-GAAP Results:
The following table summarizes our financial results for the full-year fiscal 2021:
|
Full-Year Fiscal 2021 GAAP Results |
|
Full-Year Fiscal 2021 Non-GAAP Results(1) |
||
|
Amount (millions) |
Year/Year Growth |
|
|
|
Product revenue |
$553.8 |
120% |
|
|
|
|
|
|
|
|
|
|
Amount (millions) |
Margin |
|
Amount (millions) |
Margin |
Product gross profit |
$360.0 |
65% |
|
$380.4 |
69% |
Operating loss |
($543.9) |
(92%) |
|
($224.9) |
(38%) |
Net cash used in operating activities |
($45.4) |
|
|
|
|
Free cash flow |
|
|
|
($85.7) |
(14%) |
Adjusted free cash flow |
|
|
|
($71.6) |
(12%) |
(1) We report non-GAAP financial measures in addition to, and not as a substitute for, or superior to, financial measures calculated in accordance with GAAP. See the section entitled “Statement Regarding Use of Non-GAAP Financial Measures” for an explanation of non-GAAP financial measures, and the table entitled “GAAP to Non-GAAP Reconciliations” for a reconciliation of GAAP to non-GAAP financial measures.
Note: Fiscal year ends January 31. Numbers are rounded for presentation purposes.
Financial Outlook:
Our guidance includes GAAP and non-GAAP financial measures.
The following table summarizes our guidance for the first quarter of fiscal 2022:
|
First Quarter Fiscal 2022 GAAP Guidance |
|
First Quarter Fiscal 2022 Non-GAAP Guidance(1) |
||
|
Amount (millions) |
Year/Year Growth |
|
|
|
Product revenue |
$195 - $200 |
92 - 96% |
|
|
|
|
|
|
|
|
|
|
|
|
|
|
Margin |
Operating loss |
|
|
|
|
(23%) |
|
|
|
|
|
|
|
Amount (millions) |
|
|
|
|
Weighted-average shares used to compute diluted net loss per share attributable to common stockholders - basic and diluted |
289 |
|
|
|
|
(1) We report non-GAAP financial measures in addition to, and not as a substitute for, or superior to, financial measures calculated in accordance with GAAP. See the section entitled “Statement Regarding Use of Non-GAAP Financial Measures” for an explanation of non-GAAP financial measures.
The following table summarizes our guidance for the full-year fiscal 2022:
|
Full-Year Fiscal 2022 GAAP Guidance |
|
Full-Year Fiscal 2022 Non-GAAP Guidance(1) |
||
|
Amount (millions) |
Year/Year Growth |
|
|
|
Product revenue |
$1,000 - $1,020 |
81 - 84% |
|
|
|
|
|
|
|
|
|
|
|
|
|
|
Margin |
Product gross profit |
|
|
|
|
71% |
Operating loss |
|
|
|
|
(19%) |
Adjusted free cash flow |
|
|
|
|
0% |
|
|
|
|
|
|
|
Amount (millions) |
|
|
|
|
Weighted-average shares used to compute diluted net loss per share attributable to common stockholders - basic and diluted |
295 |
|
|
|
|
(1) We report non-GAAP financial measures in addition to, and not as a substitute for, or superior to, financial measures calculated in accordance with GAAP. See the section entitled “Statement Regarding Use of Non-GAAP Financial Measures” for an explanation of non-GAAP financial measures.
A reconciliation of non-GAAP guidance measures to corresponding GAAP guidance measures is not available on a forward-looking basis without unreasonable effort due to the uncertainty regarding, and the potential variability of, expenses that may be incurred in the future. Stock-based compensation expense-related charges, including employer payroll tax-related items on employee stock transactions, are impacted by the timing of employee stock transactions, the future fair market value of our common stock, and our future hiring and retention needs, all of which are difficult to predict and subject to constant change. We have provided a reconciliation of GAAP to non-GAAP financial measures in the financial statement tables for our historical non-GAAP financial results included in this press release. Our fiscal year ends January 31, and numbers are rounded for presentation purposes.
Conference Call Details
We will host a conference call today, beginning at 2 p.m. Pacific Time on March 3, 2021. Investors and participants can register for the call in advance by visiting http://www.directeventreg.com/registration/event/3553798. After registering, a confirmation will be sent via email, including dial-in details and unique conference call access codes required for call entry.
The call will also be webcast live on the Snowflake Investor Relations website.
An audio replay of the conference call and webcast will be available two hours after its completion and will be accessible for 30 days on the Snowflake Investor Relations website.
Investor Presentation Details
An investor presentation providing additional information and analysis can be found at https://investors.snowflake.com.
Statement Regarding Use of Non‑GAAP Financial Measures
We report the following non-GAAP financial measures, which have not been prepared in accordance with generally accepted accounting principles in the United States (GAAP), in addition to, and not as a substitute for, or superior to, financial measures calculated in accordance with GAAP.
- Product gross profit and Operating income (loss). Our non-GAAP product gross profit and operating income (loss) measures exclude the effect of stock-based compensation expense-related charges, including employer payroll tax-related items on employee stock transactions, amortization of acquired intangibles, and expenses associated with acquisitions and strategic investments. We believe the presentation of operating results that exclude these non-cash or non-recurring items provides useful supplemental information to investors and facilitates the analysis of our operating results and comparison of operating results across reporting periods.
- Free cash flow and Adjusted free cash flow. Free cash flow is defined as net cash provided by (used in) operating activities reduced by purchases of property and equipment and capitalized internal-use software development costs. Adjusted free cash flow is defined as free cash flow plus cash paid on employer payroll tax-related items on employee stock transactions. Free cash flow margin and adjusted free cash flow margin are calculated as free cash flow or adjusted free cash flow as a percentage of revenue. We believe these measures provide useful supplemental information to investors because they are indicators of the strength and performance of our core business operations.
We use these non-GAAP financial measures internally for financial and operational decision-making purposes and as a means to evaluate period-to-period comparisons. Non-GAAP financial measures are not meant to be considered in isolation or as a substitute for comparable GAAP financial measures and should be read only in conjunction with our condensed consolidated financial statements prepared in accordance with GAAP. Our presentation of non-GAAP financial measures may not be comparable to similar measures used by other companies. We encourage investors to carefully consider our results under GAAP, as well as our supplemental non-GAAP information and the reconciliation between these presentations, to more fully understand our business. Please see the tables included at the end of this release for the reconciliation of GAAP to non-GAAP results.
Key Business Metrics
- Product Revenue. Product revenue is a key metric for us because we recognize revenue based on platform consumption, which is inherently variable at our customers’ discretion, and not based on the amount and duration of contract terms. Product revenue includes compute, storage, and data transfer resources, which are consumed by customers on our platform as a single, integrated offering. Customers have the flexibility to consume more than their contracted capacity during the contract term and may have the ability to roll over unused capacity to future periods, generally on the purchase of additional capacity at renewal. Our consumption-based business model distinguishes us from subscription-based software companies that generally recognize revenue ratably over the contract term and may not permit rollover. Because customers have flexibility in the timing of their consumption, which can exceed their contracted capacity or extend beyond the original contract term in many cases, the amount of product revenue recognized in a given period is an important indicator of customer satisfaction and the value derived from our platform. Product revenue excludes our professional services and other revenue.
- Remaining Performance Obligations. Remaining performance obligations (RPO) represent the amount of contracted future revenue that has not yet been recognized, including both deferred revenue and non-cancelable contracted amounts that will be invoiced and recognized as revenue in future periods. RPO excludes performance obligations from on-demand arrangements and certain time and materials contracts that are billed in arrears. RPO is not necessarily indicative of future product revenue growth because it does not account for the timing of customers’ consumption or their consumption of more than their contracted capacity. Moreover, RPO is influenced by a number of factors, including the timing of renewals, the timing of purchases of additional capacity, average contract terms, seasonality, and the extent to which customers are permitted to roll over unused capacity to future periods, generally upon the purchase of additional capacity at renewal.
- Total Customers. We count the total number of customers at the end of each period. For purposes of determining our customer count, we treat each end-customer account that has at least one corresponding capacity contract or order form as a unique customer, and a single organization with multiple divisions, segments, or subsidiaries may be counted as multiple customers. For purposes of determining our customer count, we do not include customers that consume our platform only under on-demand arrangements. Our customer count is subject to adjustments for acquisitions, consolidations, spin-offs, and other market activity.
- Net Revenue Retention Rate. To calculate net revenue retention rate, we first specify a measurement period consisting of the trailing two years from our current period end. Next, we define as our measurement cohort the population of customers under capacity contracts that used our platform at any point in the first month of the first year of the measurement period. We then calculate our net revenue retention rate as the quotient obtained by dividing our product revenue from this cohort in the second year of the measurement period by our product revenue from this cohort in the first year of the measurement period. Any customer in the cohort that did not use our platform in the second year remains in the calculation and contributes zero product revenue in the second year. Our net revenue retention rate is subject to adjustments for acquisitions, consolidations, spin-offs, and other market activity. Since we will continue to attribute the historical product revenue to the consolidated contract, consolidation of capacity contracts within a customer’s organization typically will not impact our net revenue retention rate unless one of those customers was not a customer at any point in the first month of the first year of the measurement period.
- Customers with Trailing 12-Month Product Revenue Greater than $1 Million. To calculate the number of customers with trailing 12-month product revenue greater than $1 million, we count the number of customers under capacity arrangements that contributed more than $1 million in product revenue in the trailing 12 months. Our customer count is subject to adjustments for acquisitions, consolidations, spin-offs, and other market activity.
Use of Forward‑Looking Statements
This release contains forward-looking statements within the meaning of Section 27A of the Securities Act of 1933, as amended, and Section 21E of the Securities Exchange Act of 1934, as amended, regarding our performance, including but not limited to statements in the section titled “Financial Outlook.” The forward-looking statements contained in this release and the accompanying oral presentation are subject to known and unknown risks, uncertainties, assumptions, and other factors that may cause actual results or outcomes to be materially different from any future results or outcomes expressed or implied by the forward-looking statements. These risks, uncertainties, assumptions, and other factors include, but are not limited to, those related to our business and financial performance, the effects of COVID-19 or other public health crises on our business, results of operations, and financial condition, our ability to attract and retain customers, our ability to develop new products and services and enhance existing products and services, our ability to respond rapidly to emerging technology trends, our ability to execute on our business strategy, including our strategy related to the Data Cloud, our ability to increase and predict customer consumption of our platform, our ability to compete effectively, and our ability to manage growth.
Further information on these and additional risks, uncertainties, and other factors that could cause actual outcomes and results to differ materially from those included in or contemplated by the forward-looking statements contained in this release are included under the caption “Risk Factors” and elsewhere in our Form 10-Q for the fiscal quarter ended October 31, 2020 and other filings and reports we make with the Securities and Exchange Commission from time to time, including our Form 10-K that will be filed for the fiscal year ended January 31, 2021.
Moreover, we operate in a very competitive and rapidly changing environment, and new risks may emerge from time to time. It is not possible for us to predict all risks, nor can we assess the impact of all factors on our business or the extent to which any factor, or combination of factors, may cause actual results or outcomes to differ materially from those contained in any forward-looking statements we may make. Forward-looking statements speak only as of the date the statements are made and are based on information available to us at the time those statements are made and/or management's good faith belief as of that time with respect to future events. Except as required by law, we undertake no obligation, and do not intend, to update these forward-looking statements, to review or confirm analysts’ expectations, or to provide interim reports or updates on the progress of the current financial quarter.
About Snowflake
Snowflake delivers the Data Cloud — a global network where thousands of organizations mobilize data with near-unlimited scale, concurrency, and performance. Inside the Data Cloud, organizations unite their siloed data, easily discover and securely share governed data, and execute diverse analytic workloads. Wherever data or users live, Snowflake delivers a single and seamless experience across multiple public clouds. Snowflake’s platform is the engine that powers and provides access to the Data Cloud, creating a solution for data warehousing, data lakes, data engineering, data science, data application development, and data sharing. Join Snowflake customers, partners, and data providers already taking their businesses to new frontiers in the Data Cloud at Snowflake.com.
Source: Snowflake Inc.
| Snowflake Inc. | |||||||||||||||
| Condensed Consolidated Statements of Operations | |||||||||||||||
| (in thousands, except share and per share data) | |||||||||||||||
| (unaudited) | |||||||||||||||
|
Three Months Ended January 31, |
|
Twelve Months Ended January 31, | ||||||||||||
|
2021 |
|
2020 |
|
2021 |
|
2020 | ||||||||
|
|
|
|
|
|
|
|
||||||||
Revenue |
$ |
190,465 |
|
|
$ |
87,692 |
|
|
$ |
592,049 |
|
|
$ |
264,748 |
|
Cost of revenue |
82,904 |
|
|
34,522 |
|
|
242,588 |
|
|
116,557 |
|
||||
Gross profit |
107,561 |
|
|
53,170 |
|
|
349,461 |
|
|
148,191 |
|
||||
Operating expenses: |
|
|
|
|
|
|
|
||||||||
Sales and marketing |
154,050 |
|
|
80,444 |
|
|
479,317 |
|
|
293,577 |
|
||||
Research and development |
93,997 |
|
|
29,709 |
|
|
237,946 |
|
|
105,160 |
|
||||
General and administrative |
59,911 |
|
|
28,129 |
|
|
176,135 |
|
|
107,542 |
|
||||
Total operating expenses |
307,958 |
|
|
138,282 |
|
|
893,398 |
|
|
506,279 |
|
||||
Operating loss |
(200,397 |
) |
|
(85,112 |
) |
|
(543,937 |
) |
|
(358,088 |
) |
||||
Interest income |
1,853 |
|
|
2,299 |
|
|
7,507 |
|
|
11,551 |
|
||||
Other income (expense), net |
951 |
|
|
(186 |
) |
|
(610 |
) |
|
(1,005 |
) |
||||
Loss before income taxes |
(197,593 |
) |
|
(82,999 |
) |
|
(537,040 |
) |
|
(347,542 |
) |
||||
Provision for income taxes |
1,342 |
|
|
255 |
|
|
2,062 |
|
|
993 |
|
||||
Net loss |
$ |
(198,935 |
) |
|
$ |
(83,254 |
) |
|
$ |
(539,102 |
) |
|
$ |
(348,535 |
) |
Net loss per share attributable to common stockholders - basic and diluted |
$ |
(0.70 |
) |
|
$ |
(1.67 |
) |
|
$ |
(3.81 |
) |
|
$ |
(7.77 |
) |
Weighted-average shares used to compute net loss per share attributable to common stockholders - basic and diluted |
284,121,777 |
|
|
49,992,181 |
|
|
141,613,196 |
|
|
44,847,442 |
|
||||
| Snowflake Inc. | ||||||
| Condensed Consolidated Balance Sheets | ||||||
| (in thousands) | ||||||
| (unaudited) | ||||||
|
January 31, 2021 |
|
January 31, 2020 | |||
| Assets |
|
|
|
|||
Current assets: |
|
|
|
|||
Cash and cash equivalents |
$ |
820,177 |
|
$ |
127,206 |
|
Short-term investments |
3,087,887 |
|
306,844 |
|
||
Accounts receivable, net |
294,017 |
|
179,459 |
|
||
Deferred commissions, current |
32,371 |
|
26,358 |
|
||
Prepaid expenses and other current assets |
66,200 |
|
25,327 |
|
||
Total current assets |
4,300,652 |
|
665,194 |
|
||
Long-term investments |
1,165,275 |
|
23,532 |
|
||
Property and equipment, net |
68,968 |
|
27,136 |
|
||
Operating lease right-of-use assets |
186,818 |
|
195,976 |
|
||
Goodwill |
8,449 |
|
7,049 |
|
||
Intangible assets, net |
16,091 |
|
4,795 |
|
||
Deferred commissions, non-current |
86,164 |
|
69,516 |
|
||
Other assets |
89,322 |
|
19,522 |
|
||
Total assets |
$ |
5,921,739 |
|
$ |
1,012,720 |
|
| Liabilities, Redeemable Convertible Preferred Stock and Stockholders’ Equity (Deficit) |
|
|
|
|||
Current liabilities: |
|
|
|
|||
Accounts payable |
$ |
5,647 |
|
$ |
8,488 |
|
Accrued expenses and other current liabilities |
125,315 |
|
62,817 |
|
||
Operating lease liabilities, current |
19,650 |
|
18,092 |
|
||
Deferred revenue, current |
638,652 |
|
327,058 |
|
||
Total current liabilities |
789,264 |
|
416,455 |
|
||
Operating lease liabilities, non-current |
184,887 |
|
193,175 |
|
||
Deferred revenue, non-current |
4,194 |
|
2,907 |
|
||
Other liabilities |
6,923 |
|
8,466 |
|
||
Redeemable convertible preferred stock |
— |
|
936,474 |
|
||
Stockholders’ equity (deficit) |
4,936,471 |
|
(544,757 |
) |
||
Total liabilities, redeemable convertible preferred stock, and stockholders’ equity (deficit) |
$ |
5,921,739 |
|
$ |
1,012,720 |
|
| Snowflake Inc. | |||||||||||||||
| Condensed Consolidated Statements of Cash Flows | |||||||||||||||
| (in thousands) | |||||||||||||||
| (unaudited) | |||||||||||||||
|
Three Months Ended January 31, |
|
Twelve Months Ended January 31, | ||||||||||||
|
2021 |
|
2020 |
|
2021 |
|
2020 | ||||||||
| Cash flows from operating activities: |
|
|
|
|
|
|
|
||||||||
Net loss |
$ |
(198,935 |
) |
|
$ |
(83,254 |
) |
|
$ |
(539,102 |
) |
|
$ |
(348,535 |
) |
Adjustments to reconcile net loss to net cash provided by (used in) operating activities: |
|
|
|
|
|
|
|
||||||||
Depreciation and amortization |
3,215 |
|
|
1,265 |
|
|
9,826 |
|
|
3,522 |
|
||||
Non-cash operating lease costs |
8,635 |
|
|
7,978 |
|
|
33,475 |
|
|
27,712 |
|
||||
Amortization of deferred commissions |
7,608 |
|
|
5,578 |
|
|
28,841 |
|
|
16,986 |
|
||||
Stock-based compensation, net of amounts capitalized |
143,651 |
|
|
20,974 |
|
|
301,441 |
|
|
78,399 |
|
||||
Net amortization (accretion) of premiums (discounts) on investments |
7,513 |
|
|
(310 |
) |
|
8,630 |
|
|
(5,459 |
) |
||||
Other |
507 |
|
|
200 |
|
|
4,580 |
|
|
1,476 |
|
||||
Changes in operating assets and liabilities, net of effect of acquisitions: |
|
|
|
|
|
|
|
||||||||
Accounts receivable |
(125,510 |
) |
|
(78,676 |
) |
|
(116,289 |
) |
|
(116,869 |
) |
||||
Deferred commissions |
(24,183 |
) |
|
(33,591 |
) |
|
(51,444 |
) |
|
(68,595 |
) |
||||
Prepaid expenses and other assets |
(32,869 |
) |
|
(1,955 |
) |
|
(62,349 |
) |
|
(10,811 |
) |
||||
Accounts payable |
928 |
|
|
(9,450 |
) |
|
(2,878 |
) |
|
1,116 |
|
||||
Accrued expenses and other liabilities |
35,775 |
|
|
20,626 |
|
|
58,252 |
|
|
34,994 |
|
||||
Operating lease liabilities |
(7,863 |
) |
|
(7,403 |
) |
|
(31,281 |
) |
|
(13,455 |
) |
||||
Deferred revenue |
201,142 |
|
|
115,226 |
|
|
312,881 |
|
|
222,961 |
|
||||
Net cash provided by (used in) operating activities |
19,614 |
|
|
(42,792 |
) |
|
(45,417 |
) |
|
(176,558 |
) |
||||
| Cash flows from investing activities: |
|
|
|
|
|
|
|
||||||||
Purchases of property and equipment |
(11,019 |
) |
|
(4,079 |
) |
|
(35,037 |
) |
|
(18,583 |
) |
||||
Capitalized internal-use software development costs |
(1,279 |
) |
|
(1,325 |
) |
|
(5,293 |
) |
|
(4,265 |
) |
||||
Cash paid for acquisitions, net of cash acquired |
— |
|
|
— |
|
|
(6,035 |
) |
|
(6,314 |
) |
||||
Purchases of intangible assets |
(2,190 |
) |
|
— |
|
|
(8,374 |
) |
|
— |
|
||||
Purchases of investments |
(3,624,832 |
) |
|
(105,375 |
) |
|
(4,859,852 |
) |
|
(622,854 |
) |
||||
Sales of investments |
148,365 |
|
|
10,691 |
|
|
177,070 |
|
|
14,087 |
|
||||
Maturities and redemptions of investments |
329,348 |
|
|
84,438 |
|
|
700,876 |
|
|
776,424 |
|
||||
Net cash (used in) provided by investing activities |
(3,161,607 |
) |
|
(15,650 |
) |
|
(4,036,645 |
) |
|
138,495 |
|
||||
| Cash flows from financing activities: |
|
|
|
|
|
|
|
||||||||
Proceeds from issuance of redeemable convertible preferred stock, net of issuance costs |
— |
|
|
— |
|
|
478,573 |
|
|
24,121 |
|
||||
Proceeds from initial public offering and private placements, net of underwriting discounts |
— |
|
|
— |
|
|
4,242,284 |
|
|
— |
|
||||
Proceeds from early exercised stock options |
— |
|
|
271 |
|
|
159 |
|
|
6,213 |
|
||||
Proceeds from exercise of stock options |
22,278 |
|
|
6,387 |
|
|
53,378 |
|
|
27,526 |
|
||||
Proceeds from repayment of a nonrecourse promissory note |
— |
|
|
— |
|
|
2,090 |
|
|
— |
|
||||
Repurchases of early exercised stock options and restricted common stock |
— |
|
|
— |
|
|
(30 |
) |
|
(391 |
) |
||||
Payments of deferred purchase consideration for acquisitions |
— |
|
|
— |
|
|
(1,164 |
) |
|
— |
|
||||
Net cash provided by financing activities |
22,278 |
|
|
6,658 |
|
|
4,775,290 |
|
|
57,469 |
|
||||
Effect of exchange rate changes on cash, cash equivalents and restricted cash |
(11 |
) |
|
— |
|
|
(11 |
) |
|
— |
|
||||
Net (decrease) increase in cash, cash equivalents and restricted cash |
(3,119,726 |
) |
|
(51,784 |
) |
|
693,217 |
|
|
19,406 |
|
||||
Cash, cash equivalents and restricted cash at beginning of period |
3,954,919 |
|
|
193,760 |
|
|
141,976 |
|
|
122,570 |
|
||||
Cash, cash equivalents and restricted cash at end of period |
$ |
835,193 |
|
|
$ |
141,976 |
|
|
$ |
835,193 |
|
|
$ |
141,976 |
|
| Snowflake Inc. | |||||||||||||||||||||||||
| GAAP to Non-GAAP Reconciliations | |||||||||||||||||||||||||
| (in thousands, except percentages) | |||||||||||||||||||||||||
| (unaudited) | |||||||||||||||||||||||||
|
Three Months Ended January 31, 2021 | ||||||||||||||||||||||||
|
GAAP amounts |
|
GAAP amounts as a % of revenue |
|
Stock-based compensation expense-related charges(1) |
|
Amortization of acquired intangibles |
|
Expenses associated with acquisitions and strategic investments |
|
Non-GAAP amounts |
|
Non-GAAP amounts as a % of revenue |
||||||||||||
| Revenue: |
|
|
|
|
|
|
|
|
|
|
|
|
|
||||||||||||
Product revenue |
$ |
178,288 |
|
|
94 | % |
|
|
|
|
|
|
|
|
|
|
|||||||||
Professional services and other revenue |
12,177 |
|
|
6 | % |
|
|
|
|
|
|
|
|
|
|
||||||||||
Revenue |
190,465 |
|
|
100 | % |
|
|
|
|
|
|
|
|
|
|
||||||||||
| Year over Year % Growth | 117 | % |
|
|
|
|
|
|
|
|
|
|
|
|
|||||||||||
|
|
|
|
|
|
|
|
|
|
|
|
|
|
||||||||||||
| Cost of Revenue: |
|
|
|
|
|
|
|
|
|
|
|
|
|
||||||||||||
Cost of product revenue |
63,770 |
|
|
33 | % |
|
$ |
(10,171 |
) |
|
$ |
(566 |
) |
|
$ |
— |
|
|
$ |
53,033 |
|
|
28 | % | |
Cost of professional services and other revenue |
19,134 |
|
|
11 | % |
|
(8,702 |
) |
|
— |
|
|
— |
|
|
10,432 |
|
|
5 | % | |||||
Total cost of revenue |
82,904 |
|
|
44 | % |
|
(18,873 |
) |
|
(566 |
) |
|
— |
|
|
63,465 |
|
|
33 | % | |||||
|
|
|
|
|
|
|
|
|
|
|
|
|
|
||||||||||||
| Gross profit (loss): |
|
|
|
|
|
|
|
|
|
|
|
|
|
||||||||||||
Product gross profit |
114,518 |
|
|
|
|
10,171 |
|
|
566 |
|
|
— |
|
|
125,255 |
|
|
|
|||||||
Professional services and other gross profit (loss) |
(6,957 |
) |
|
|
|
8,702 |
|
|
— |
|
|
— |
|
|
1,745 |
|
|
|
|||||||
Total gross profit |
107,561 |
|
|
56 | % |
|
18,873 |
|
|
566 |
|
|
— |
|
|
127,000 |
|
|
67 | % | |||||
| Product gross margin | 64 | % |
|
|
|
6 | % |
|
— | % |
|
— | % |
|
70 | % |
|
|
|||||||
| Professional services and other gross margin | (57 | %) |
|
|
|
71 | % |
|
— | % |
|
— | % |
|
14 | % |
|
|
|||||||
| Total gross margin | 56 | % |
|
|
|
11 | % |
|
— | % |
|
— | % |
|
67 | % |
|
|
|||||||
|
|
|
|
|
|
|
|
|
|
|
|
|
|
||||||||||||
| Operating expenses: |
|
|
|
|
|
|
|
|
|
|
|
|
|
||||||||||||
Sales and marketing |
154,050 |
|
|
81 | % |
|
(52,438 |
) |
|
— |
|
|
— |
|
|
101,612 |
|
|
54 | % | |||||
Research and development |
93,997 |
|
|
49 | % |
|
(53,440 |
) |
|
— |
|
|
— |
|
|
40,557 |
|
|
21 | % | |||||
General and administrative |
59,911 |
|
|
31 | % |
|
(28,713 |
) |
|
(352 |
) |
|
(44 |
) |
|
30,802 |
|
|
16 | % | |||||
Total operating expenses |
307,958 |
|
|
161 | % |
|
(134,591 |
) |
|
(352 |
) |
|
(44 |
) |
|
172,971 |
|
|
91 | % | |||||
Operating loss |
$ |
(200,397 |
) |
|
(105 | %) |
|
$ |
153,464 |
|
|
$ |
918 |
|
|
$ |
44 |
|
|
$ |
(45,971 |
) |
|
(24 | %) |
| Operating margin | (105 | %) |
|
|
|
81 | % |
|
— | % |
|
— | % |
|
(24 | %) |
|
|
|||||||
|
|
|
|
|
|
|
|
|
|
|
|
|
|
||||||||||||
| (1) Stock-based compensation expense-related charges included approximately $9.6 million of employer payroll tax-related expenses on employee stock transactions. | |||||||||||||||||||||||||
|
Three Months Ended January 31, 2020 | ||||||||||||||||||||||||
|
GAAP amounts |
|
GAAP amounts as a % of revenue |
|
Stock-based compensation expense-related charges(1) |
|
Amortization of acquired intangibles |
|
Expenses associated with acquisitions and strategic investments |
|
Non-GAAP amounts |
|
Non-GAAP amounts as a % of revenue |
||||||||||||
| Revenue: |
|
|
|
|
|
|
|
|
|
|
|
|
|
||||||||||||
Product revenue |
$ |
82,432 |
|
|
94 | % |
|
|
|
|
|
|
|
|
|
|
|||||||||
Professional services and other revenue |
5,260 |
|
|
6 | % |
|
|
|
|
|
|
|
|
|
|
||||||||||
Revenue |
87,692 |
|
|
100 | % |
|
|
|
|
|
|
|
|
|
|
||||||||||
| Year over Year % Growth | 139 | % |
|
|
|
|
|
|
|
|
|
|
|
|
|||||||||||
|
|
|
|
|
|
|
|
|
|
|
|
|
|
||||||||||||
| Cost of Revenue: |
|
|
|
|
|
|
|
|
|
|
|
|
|
||||||||||||
Cost of product revenue |
28,777 |
|
|
33 | % |
|
$ |
(472 |
) |
|
$ |
(281 |
) |
|
$ |
— |
|
|
$ |
28,024 |
|
|
32 | % | |
Cost of professional services and other revenue |
5,745 |
|
|
6 | % |
|
(496 |
) |
|
— |
|
|
— |
|
|
5,249 |
|
|
6 | % | |||||
Total cost of revenue |
34,522 |
|
|
39 | % |
|
(968 |
) |
|
(281 |
) |
|
— |
|
|
33,273 |
|
|
38 | % | |||||
|
|
|
|
|
|
|
|
|
|
|
|
|
|
||||||||||||
| Gross profit (loss): |
|
|
|
|
|
|
|
|
|
|
|
|
|
||||||||||||
Product gross profit |
53,655 |
|
|
|
|
472 |
|
|
281 |
|
|
— |
|
|
54,408 |
|
|
|
|||||||
Professional services and other gross profit (loss) |
(485 |
) |
|
|
|
496 |
|
|
— |
|
|
— |
|
|
11 |
|
|
|
|||||||
Total gross profit |
53,170 |
|
|
61 | % |
|
968 |
|
|
281 |
|
|
— |
|
|
54,419 |
|
|
62 | % | |||||
| Product gross margin | 65 | % |
|
|
|
1 | % |
|
— | % |
|
— | % |
|
66 | % |
|
|
|||||||
| Professional services and other gross margin | (9 | %) |
|
|
|
9 | % |
|
— | % |
|
— | % |
|
— | % |
|
|
|||||||
| Total gross margin | 61 | % |
|
|
|
1 | % |
|
— | % |
|
— | % |
|
62 | % |
|
|
|||||||
|
|
|
|
|
|
|
|
|
|
|
|
|
|
||||||||||||
| Operating expenses: |
|
|
|
|
|
|
|
|
|
|
|
|
|
||||||||||||
Sales and marketing |
80,444 |
|
|
92 | % |
|
(5,424 |
) |
|
(16 |
) |
|
— |
|
|
75,004 |
|
|
86 | % | |||||
Research and development |
29,709 |
|
|
34 | % |
|
(4,929 |
) |
|
— |
|
|
— |
|
|
24,780 |
|
|
28 | % | |||||
General and administrative |
28,129 |
|
|
32 | % |
|
(9,758 |
) |
|
— |
|
|
— |
|
|
18,371 |
|
|
21 | % | |||||
Total operating expenses |
138,282 |
|
|
158 | % |
|
(20,111 |
) |
|
(16 |
) |
|
— |
|
|
118,155 |
|
|
135 | % | |||||
Operating loss |
$ |
(85,112 |
) |
|
(97 | %) |
|
$ |
21,079 |
|
|
$ |
297 |
|
|
$ |
— |
|
|
$ |
(63,736 |
) |
|
(73 | %) |
| Operating margin | (97 | %) |
|
|
|
24 | % |
|
— | % |
|
— | % |
|
(73 | %) |
|
|
|||||||
|
|
|
|
|
|
|
|
|
|
|
|
|
|
||||||||||||
| (1) Stock-based compensation expense-related charges included approximately $0.1 million of employer payroll tax-related expenses on employee stock transactions. | |||||||||||||||||||||||||
|
Twelve Months Ended January 31, 2021 | ||||||||||||||||||||||||
|
GAAP amounts |
|
GAAP amounts as a % of revenue |
|
Stock-based compensation expense-related charges(1) |
|
Amortization of acquired intangibles |
|
Expenses associated with acquisitions and strategic investments |
|
Non-GAAP amounts |
|
Non-GAAP amounts as a % of revenue |
||||||||||||
| Revenue: |
|
|
|
|
|
|
|
|
|
|
|
|
|
||||||||||||
Product revenue |
$ |
553,794 |
|
|
94 | % |
|
|
|
|
|
|
|
|
|
|
|||||||||
Professional services and other revenue |
38,255 |
|
|
6 | % |
|
|
|
|
|
|
|
|
|
|
||||||||||
Revenue |
592,049 |
|
|
100 | % |
|
|
|
|
|
|
|
|
|
|
||||||||||
| Year over Year % Growth | 124 | % |
|
|
|
|
|
|
|
|
|
|
|
|
|||||||||||
|
|
|
|
|
|
|
|
|
|
|
|
|
|
||||||||||||
| Cost of Revenue: |
|
|
|
|
|
|
|
|
|
|
|
|
|
||||||||||||
Cost of product revenue |
193,835 |
|
|
33 | % |
|
$ |
(18,724 |
) |
|
$ |
(1,696 |
) |
|
$ |
— |
|
|
$ |
173,415 |
|
|
29 | % | |
Cost of professional services and other revenue |
48,753 |
|
|
8 | % |
|
(16,104 |
) |
|
— |
|
|
— |
|
|
32,649 |
|
|
6 | % | |||||
Total cost of revenue |
242,588 |
|
|
41 | % |
|
(34,828 |
) |
|
(1,696 |
) |
|
— |
|
|
206,064 |
|
|
35 | % | |||||
|
|
|
|
|
|
|
|
|
|
|
|
|
|
||||||||||||
| Gross profit (loss): |
|
|
|
|
|
|
|
|
|
|
|
|
|
||||||||||||
Product gross profit |
359,959 |
|
|
|
|
18,724 |
|
|
1,696 |
|
|
— |
|
|
380,379 |
|
|
|
|||||||
Professional services and other gross profit (loss) |
(10,498 |
) |
|
|
|
16,104 |
|
|
— |
|
|
— |
|
|
5,606 |
|
|
|
|||||||
Total gross profit |
349,461 |
|
|
59 | % |
|
34,828 |
|
|
1,696 |
|
|
— |
|
|
385,985 |
|
|
65 | % | |||||
| Product gross margin | 65 | % |
|
|
|
4 | % |
|
— | % |
|
— | % |
|
69 | % |
|
|
|||||||
| Professional services and other gross margin | (27 | %) |
|
|
|
42 | % |
|
— | % |
|
— | % |
|
15 | % |
|
|
|||||||
| Total gross margin | 59 | % |
|
|
|
6 | % |
|
— | % |
|
— | % |
|
65 | % |
|
|
|||||||
|
|
|
|
|
|
|
|
|
|
|
|
|
|
||||||||||||
| Operating expenses: |
|
|
|
|
|
|
|
|
|
|
|
|
|
||||||||||||
Sales and marketing |
479,317 |
|
|
81 | % |
|
(104,537 |
) |
|
(12 |
) |
|
— |
|
|
374,768 |
|
|
63 | % | |||||
Research and development |
237,946 |
|
|
40 | % |
|
(103,954 |
) |
|
— |
|
|
— |
|
|
133,992 |
|
|
23 | % | |||||
General and administrative |
176,135 |
|
|
30 | % |
|
(72,647 |
) |
|
(1,069 |
) |
|
(296 |
) |
|
102,123 |
|
|
17 | % | |||||
Total operating expenses |
893,398 |
|
|
151 | % |
|
(281,138 |
) |
|
(1,081 |
) |
|
(296 |
) |
|
610,883 |
|
|
103 | % | |||||
Operating loss |
$ |
(543,937 |
) |
|
(92 | %) |
|
$ |
315,966 |
|
|
$ |
2,777 |
|
|
$ |
296 |
|
|
$ |
(224,898 |
) |
|
(38 | %) |
| Operating margin | (92 | %) |
|
|
|
54 | % |
|
— | % |
|
— | % |
|
(38 | %) |
|
|
|||||||
|
|
|
|
|
|
|
|
|
|
|
|
|
|
||||||||||||
| (1) Stock-based compensation expense-related charges included approximately $14.2 million of employer payroll tax-related expenses on employee stock transactions. | |||||||||||||||||||||||||
|
Twelve Months Ended January 31, 2020 | ||||||||||||||||||||||||
|
GAAP amounts |
|
GAAP amounts as a % of revenue |
|
Stock-based compensation expense-related charges(1) |
|
Amortization of acquired intangibles |
|
Expenses associated with acquisitions and strategic investments |
|
Non-GAAP amounts |
|
Non-GAAP amounts as a % of revenue |
||||||||||||
| Revenue: |
|
|
|
|
|
|
|
|
|
|
|
|
|
||||||||||||
Product revenue |
$ |
252,229 |
|
|
95 | % |
|
|
|
|
|
|
|
|
|
|
|||||||||
Professional services and other revenue |
12,519 |
|
|
5 | % |
|
|
|
|
|
|
|
|
|
|
||||||||||
Revenue |
264,748 |
|
|
100 | % |
|
|
|
|
|
|
|
|
|
|
||||||||||
| Year over Year % Growth | 174 | % |
|
|
|
|
|
|
|
|
|
|
|
|
|||||||||||
|
|
|
|
|
|
|
|
|
|
|
|
|
|
||||||||||||
| Cost of Revenue: |
|
|
|
|
|
|
|
|
|
|
|
|
|
||||||||||||
Cost of product revenue |
96,622 |
|
|
36 | % |
|
$ |
(1,919 |
) |
|
$ |
(849 |
) |
|
$ |
— |
|
|
$ |
93,854 |
|
|
35 | % | |
Cost of professional services and other revenue |
19,935 |
|
|
8 | % |
|
(1,732 |
) |
|
— |
|
|
— |
|
|
18,203 |
|
|
7 | % | |||||
Total cost of revenue |
116,557 |
|
|
44 | % |
|
(3,651 |
) |
|
(849 |
) |
|
— |
|
|
112,057 |
|
|
42 | % | |||||
|
|
|
|
|
|
|
|
|
|
|
|
|
|
||||||||||||
| Gross profit (loss): |
|
|
|
|
|
|
|
|
|
|
|
|
|
||||||||||||
Product gross profit |
155,607 |
|
|
|
|
1,919 |
|
|
849 |
|
|
— |
|
|
158,375 |
|
|
|
|||||||
Professional services and other gross loss |
(7,416 |
) |
|
|
|
1,732 |
|
|
— |
|
|
— |
|
|
(5,684 |
) |
|
|
|||||||
Total gross profit |
148,191 |
|
|
56 | % |
|
3,651 |
|
|
849 |
|
|
— |
|
|
152,691 |
|
|
58 | % | |||||
| Product gross margin | 62 | % |
|
|
|
1 | % |
|
— | % |
|
— | % |
|
63 | % |
|
|
|||||||
| Professional services and other gross margin | (59 | %) |
|
|
|
14 | % |
|
— | % |
|
— | % |
|
(45 | %) |
|
|
|||||||
| Total gross margin | 56 | % |
|
|
|
1 | % |
|
1 | % |
|
— | % |
|
58 | % |
|
|
|||||||
|
|
|
|
|
|
|
|
|
|
|
|
|
|
||||||||||||
| Operating expenses: |
|
|
|
|
|
|
|
|
|
|
|
|
|
||||||||||||
Sales and marketing |
293,577 |
|
|
111 | % |
|
(20,922 |
) |
|
(58 |
) |
|
— |
|
|
272,597 |
|
|
103 | % | |||||
Research and development |
105,160 |
|
|
40 | % |
|
(15,786 |
) |
|
— |
|
|
— |
|
|
89,374 |
|
|
34 | % | |||||
General and administrative |
107,542 |
|
|
41 | % |
|
(38,257 |
) |
|
— |
|
|
(328 |
) |
|
68,957 |
|
|
26 | % | |||||
Total operating expenses |
506,279 |
|
|
192 | % |
|
(74,965 |
) |
|
(58 |
) |
|
(328 |
) |
|
430,928 |
|
|
163 | % | |||||
Operating loss |
$ |
(358,088 |
) |
|
(136 | %) |
|
$ |
78,616 |
|
|
$ |
907 |
|
|
$ |
328 |
|
|
$ |
(278,237 |
) |
|
(105 | %) |
| Operating margin | (136 | %) |
|
|
|
30 | % |
|
1 | % |
|
— | % |
|
(105 | %) |
|
|
|||||||
|
|
|
|
|
|
|
|
|
|
|
|
|
|
||||||||||||
| (1) Stock-based compensation expense-related charges included approximately $0.2 million of employer payroll tax-related expenses on employee stock transactions. | |||||||||||||||||||||||||
|
Three Months Ended January 31, |
|
Twelve Months Ended January 31, | ||||||||||||
|
2021 |
|
2020 |
|
2021 |
|
2020 | ||||||||
|
|
|
|
|
|
|
|
||||||||
Revenue |
$ |
190,465 |
|
|
$ |
87,692 |
|
|
$ |
592,049 |
|
|
$ |
264,748 |
|
|
|
|
|
|
|
|
|
||||||||
GAAP net cash provided by (used in) operating activities |
$ |
19,614 |
|
|
$ |
(42,792 |
) |
|
$ |
(45,417 |
) |
|
$ |
(176,558 |
) |
Less: purchases of property and equipment |
(11,019 |
) |
|
(4,079 |
) |
|
(35,037 |
) |
|
(18,583 |
) |
||||
Less: capitalized internal-use software development costs |
(1,279 |
) |
|
(1,325 |
) |
|
(5,293 |
) |
|
(4,265 |
) |
||||
Non-GAAP free cash flow |
7,316 |
|
|
(48,196 |
) |
|
(85,747 |
) |
|
(199,406 |
) |
||||
Add: cash paid for employer payroll tax-related items on employee stock transactions |
9,940 |
|
|
105 |
|
|
14,136 |
|
|
217 |
|
||||
Non-GAAP adjusted free cash flow |
$ |
17,256 |
|
|
$ |
(48,091 |
) |
|
$ |
(71,611 |
) |
|
$ |
(199,189 |
) |
| Non-GAAP free cash flow margin | 4 | % |
|
(55 | %) |
|
(14 | %) |
|
(75 | %) | ||||
| Non-GAAP adjusted free cash flow margin | 9 | % |
|
(55 | %) |
|
(12 | %) |
|
(75 | %) | ||||
|
|
|
|
|
|
|
|
||||||||
Contacts
Investor Contact
Jimmy Sexton
Press Contact
Eszter Szikora
Source: Snowflake Inc.