

Understanding High Cardinality in Observability
Cloud-native environments have transformed how applications are built, deployed and scaled. As distributed systems generate increasing volumes of telemetry, managing high-cardinality metrics has become an important consideration for observability teams seeking detailed insights while balancing performance, complexity and cost.
HIGH CARDINALITY DEFINED
High cardinality describes telemetry that contains a large number of unique values or combinations across dimensions such as user IDs, service versions and deployment attributes.
This article explores high cardinality in observability, the factors that contribute to it, the challenges it can create and strategies for managing it effectively.
What is high cardinality?
Cardinality refers to the number of unique values or combinations of values associated with a metric. In observability, dimensions provide additional context that helps teams understand metric data.
For example, a response-code metric might include the following information:
{2024-05-14_17:32:00} {metric: resp.code} {dimensions [user.segment:premium] [userID:1234][action:make_payment][version:1.21]} {value:520}
Dimensions are key-value pairs that describe the context in which a measurement was collected. They may represent attributes such as user segments, service versions, endpoints, deployment environments or cloud regions.
Adding dimensions makes it possible to investigate application behavior at a more granular level. However, each additional dimension can increase the number of possible value combinations. When these combinations are represented as distinct metric time series, cardinality can grow substantially.
For example, a metric associated with a small number of services and environments may have relatively low cardinality. Introducing dimensions for individual users, sessions, instances and request attributes can increase the number of distinct combinations significantly.
The practical impact depends on the number of dimensions, their possible values, how those dimensions combine and how the observability platform represents and stores the resulting data.
What are the causes of high cardinality?
Cloud-native architectures introduce several characteristics that can contribute to high cardinality. The following examples illustrate why metric volume and dimensional complexity can grow as applications scale.
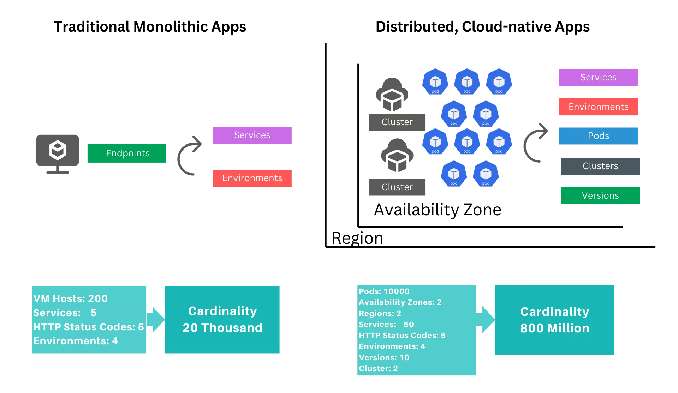
Figure 1: Causes of high cardinality in cloud-native applications.
- Microservices architecture
Distributed applications often consist of many independently deployed services. Each service may produce metrics for latency, throughput, errors and resource utilization.
As the number of services and monitored components increases, so does the potential number of unique metric series, particularly when each service exposes its own set of dimensions.
- Dynamic environments
Containerized applications and orchestration platforms such as Kubernetes can create, replace and remove application instances dynamically.
Dimensions associated with individual instances, pods, containers or deployments can introduce additional unique values as workloads change. Frequent scaling and deployment activity may further increase the volume of telemetry being written and processed.
- Rich instrumentation
Detailed instrumentation helps engineering teams investigate application behavior and correlate events across services.
OpenTelemetry and other instrumentation approaches can attach attributes to telemetry, providing useful context for troubleshooting and analysis. However, attributes with many possible values can increase cardinality when included in metric dimensions.
Careful instrumentation design helps teams preserve useful diagnostic context without introducing unnecessary dimensional complexity.
- User-specific metrics
Dimensions such as user IDs, session IDs, request IDs and device identifiers can help identify patterns affecting individual customers or requests.
These attributes can be valuable for understanding latency, errors, and differences in application behavior. However, because they may have a large number of unique values, including them directly in metric labels can create substantial cardinality.
The appropriate approach depends on the investigation requirements and the capabilities of the telemetry storage and analysis system. In some cases, event-level logs or traces may provide a more suitable way to retain this detail.
- Environment-specific metrics
Applications commonly operate across development, testing, staging and production environments, as well as multiple cloud regions and availability zones.
Service versions, deployment identifiers and experimentation attributes can add further dimensions. As these values accumulate across environments, the resulting combinations can increase the number of distinct time series.
Challenges of high cardinality metrics
High cardinality can affect the performance, operational complexity and cost of observability systems. The severity of these effects depends on the architecture, workload, query patterns and data-management capabilities of the platform.
Performance and resource utilization
A larger number of unique time series can increase the resources required for ingestion, indexing, storage and query execution.
Queries that aggregate or filter across many series may require additional processing. High-cardinality workloads can also place pressure on memory and other infrastructure resources, depending on the underlying implementation.
Complexity in analysis
Detailed telemetry can improve visibility, but large volumes of unique combinations may make it harder to identify meaningful patterns.
Teams need effective filtering, aggregation and exploration capabilities to move between high-level service health indicators and detailed investigations without introducing unnecessary complexity.
Cost considerations
Observability costs can depend on several factors, including ingestion volume, the number of stored time series, retention duration, query activity and the pricing model of the platform.
High cardinality can increase costs when it leads to additional indexed series, storage requirements or processing overhead. Understanding how a platform measures and charges for these activities is therefore an important part of observability planning.
Managing high cardinality: Common approaches and trade-offs
Teams use several techniques to manage cardinality and control observability costs. Each approach has benefits, but the right balance depends on the operational requirements and the need to preserve diagnostic detail.
Metric aggregation
Aggregating measurements at a service, endpoint or other appropriate level can reduce the number of distinct time series.
For example, a team could monitor request latency by service and endpoint rather than maintaining a separate metric series for every user.
Aggregation is useful for understanding overall performance and trends. However, it may not preserve the detail required to investigate an individual customer's experience.
Filtering and sampling
Filtering removes attributes or telemetry that are not needed for a particular monitoring use case. Sampling collects a subset of events or requests rather than retaining every observation.
These techniques can reduce data volume and processing requirements. Their effectiveness depends on the sampling strategy, the attributes retained and the types of questions teams need to answer.
Overly aggressive filtering or sampling can limit the evidence available for troubleshooting specific incidents.
Retention policies
Retention policies determine how long telemetry remains available for analysis. Teams may retain detailed event data for a defined period while preserving aggregated measurements for longer-term trend analysis. Retention decisions should account for incident investigation requirements, compliance obligations, operational needs and storage costs.
Choosing the right telemetry type
Metrics, logs and traces serve complementary purposes.
- Metrics provide efficient summaries of system behavior. They are useful for dashboards, alerting and trend analysis.
- Logs capture individual events and can preserve structured attributes alongside descriptive messages.
- Traces help teams understand request flows and latency across distributed services.
Using each telemetry type for the questions it is best suited to answer can help teams manage cardinality while maintaining useful investigative detail.
Balancing granularity, performance and cost
Observability teams often need to balance three goals: retaining detailed context, supporting responsive analysis and managing infrastructure costs.
Metrics remain valuable for monitoring service health and detecting changes in system behavior. However, representing every high-cardinality attribute as a metric dimension may not be necessary or appropriate for every use case.
A complementary approach is to retain detailed event data in a format that supports flexible exploration, while using metrics for aggregation, alerting and operational dashboards.
This approach can help teams preserve context for troubleshooting without requiring every possible dimension to be represented as a separate metric time series.
Logs and high-cardinality data
Logs can provide a flexible way to retain high-cardinality information because individual records can contain many different attributes and values.
For example, an application log event might include a timestamp, user identifier, request path, status code, service version and error message. These fields can support investigations into individual requests or specific customer experiences without necessarily requiring a separate metric time series for every combination.
Structured and semi-structured logs can also accommodate evolving application data. This allows teams to explore fields that were not initially selected as metric dimensions. The extent to which this flexibility is available depends on the platform's storage, search and query architecture.
However, logs are not a universal replacement for metrics. Their usefulness depends on how efficiently a system ingests, retains, searches and analyzes event data, as well as how well it supports the operational workflows that depend on that data.
Considerations for traditional log management architectures
Log management platforms use different approaches to indexing, storing and querying data. Some architectures rely on indexing selected fields to accelerate searches, while others support different combinations of indexing and query-time processing.
Indexing selected fields can improve search performance for common queries, but teams may need to make decisions about which fields to index and how to manage the associated storage and processing costs.
Retention policies can also affect the accessibility and cost of historical data. Depending on the platform, retaining data in different storage tiers may involve trade-offs in retrieval latency, query capabilities and cost.
Before selecting a log management solution, teams should evaluate how its architecture supports high-volume ingestion, high-cardinality attributes, historical analysis and the investigative workflows required by their applications.
Understanding the relationship between logs and metrics
Some observability workflows derive metrics from log events to support dashboards, alerts and historical trend analysis.
The cost and operational implications of this approach depend on how the platform processes log data, stores derived metrics and measures usage. In architectures where logs and metrics use separate storage or processing resources, maintaining both datasets may introduce additional infrastructure requirements.
For example, a Kubernetes environment with hundreds of nodes may produce substantial volumes of telemetry across attributes such as user agents, source IP addresses, node identifiers and response status codes. The resulting number of metric series will depend on the number of unique values, how the dimensions combine and which combinations are actually recorded.
Estimating the potential cost requires a clear understanding of the platform's pricing model, the number of billable metric series, the applicable usage allowances and any additional ingestion, storage or query charges.
Evaluating these factors before introducing new dimensions or derived metrics can help teams avoid unexpected costs while maintaining the visibility needed for operational analysis.
Modernize your log management with Observe
Observe by Snowflake is an AI-powered observability platform that is designed to deliver fast performance at petabyte scale while helping lower the total cost of ownership. Unlike approaches that rely heavily on predefined metric dimensions, Observe enables teams to explore logs while preserving valuable context, including user IDs, session IDs, service versions and error messages.
This flexibility supports high-cardinality investigations without requiring every unique attribute combination to become a separate metric time series and helps teams retain the detail needed to troubleshoot complex issues.
One common reason why teams use custom metrics instead of logs is that many log management vendors keep logs in a hot state only for a limited period, such as 7, 30 or 90 days. Beyond the default retention, data is often tiered and stored in a warm, cold or frozen state, which can make timely analysis and visualization more difficult.
Observe includes 30 days of log retention and 13 months of metrics by default, with options to retain data longer. Data is always kept in a hot state, so your dashboards refresh or alerts can fire quickly.
Ready to solve performance issues or cost overruns caused by the high-cardinality data? Start your Observe journey with a free trial.
KEY TAKEAWAY
High-cardinality data preserves the dimensions engineers need for granular investigation, but traditional indexed monitoring systems can impose query, storage, and cost trade-offs as unique time series grow.
Frequently Asked Questions
Your common questions about high cardinality, answered by Snowflake experts.
Should high-cardinality data be stored in metrics or logs?
It depends on what you need to answer. Metrics work best for dashboards, alerting and trend analysis at an aggregated level. Logs can keep many attributes on each event without creating a separate time series for every combination, which makes them better for investigating specific users or requests. Many teams use both.
What is the difference between high and low cardinality?
Low-cardinality dimensions have a small, fixed set of possible values, such as deployment environment (development, staging, production) or cloud region. High-cardinality dimensions have a very large number of unique values, such as user IDs, session IDs or request IDs. When a metric uses high-cardinality dimensions, the number of distinct time series can grow very quickly.
Explore Observability Resources
Explore Observability Topics
Deep dives into every aspect of observability
