Use Case
Full-fidelityapplication performance monitoring
When something breaks across dozens of services, siloed tools and sampled traces slow teams down. Give every developer the visibility they need to find and fix issues fast.

Overview
Performance issues hide across services. Observe by Snowflake finds them fast.
Modern applications span hundreds of services and produce telemetry to match. Capture spans, metrics and logs without sampling, store them for up to 13 months, and connect them to infrastructure, deployments and business context with Observe.

Trace issues across services, agents and dependencies
Native OpenTelemetry (OTel) ingestion captures spans, metrics and logs without sampling. Make every request traceable across microservices, LLMs and AI agents.

Discover services and map dependencies automatically for full context
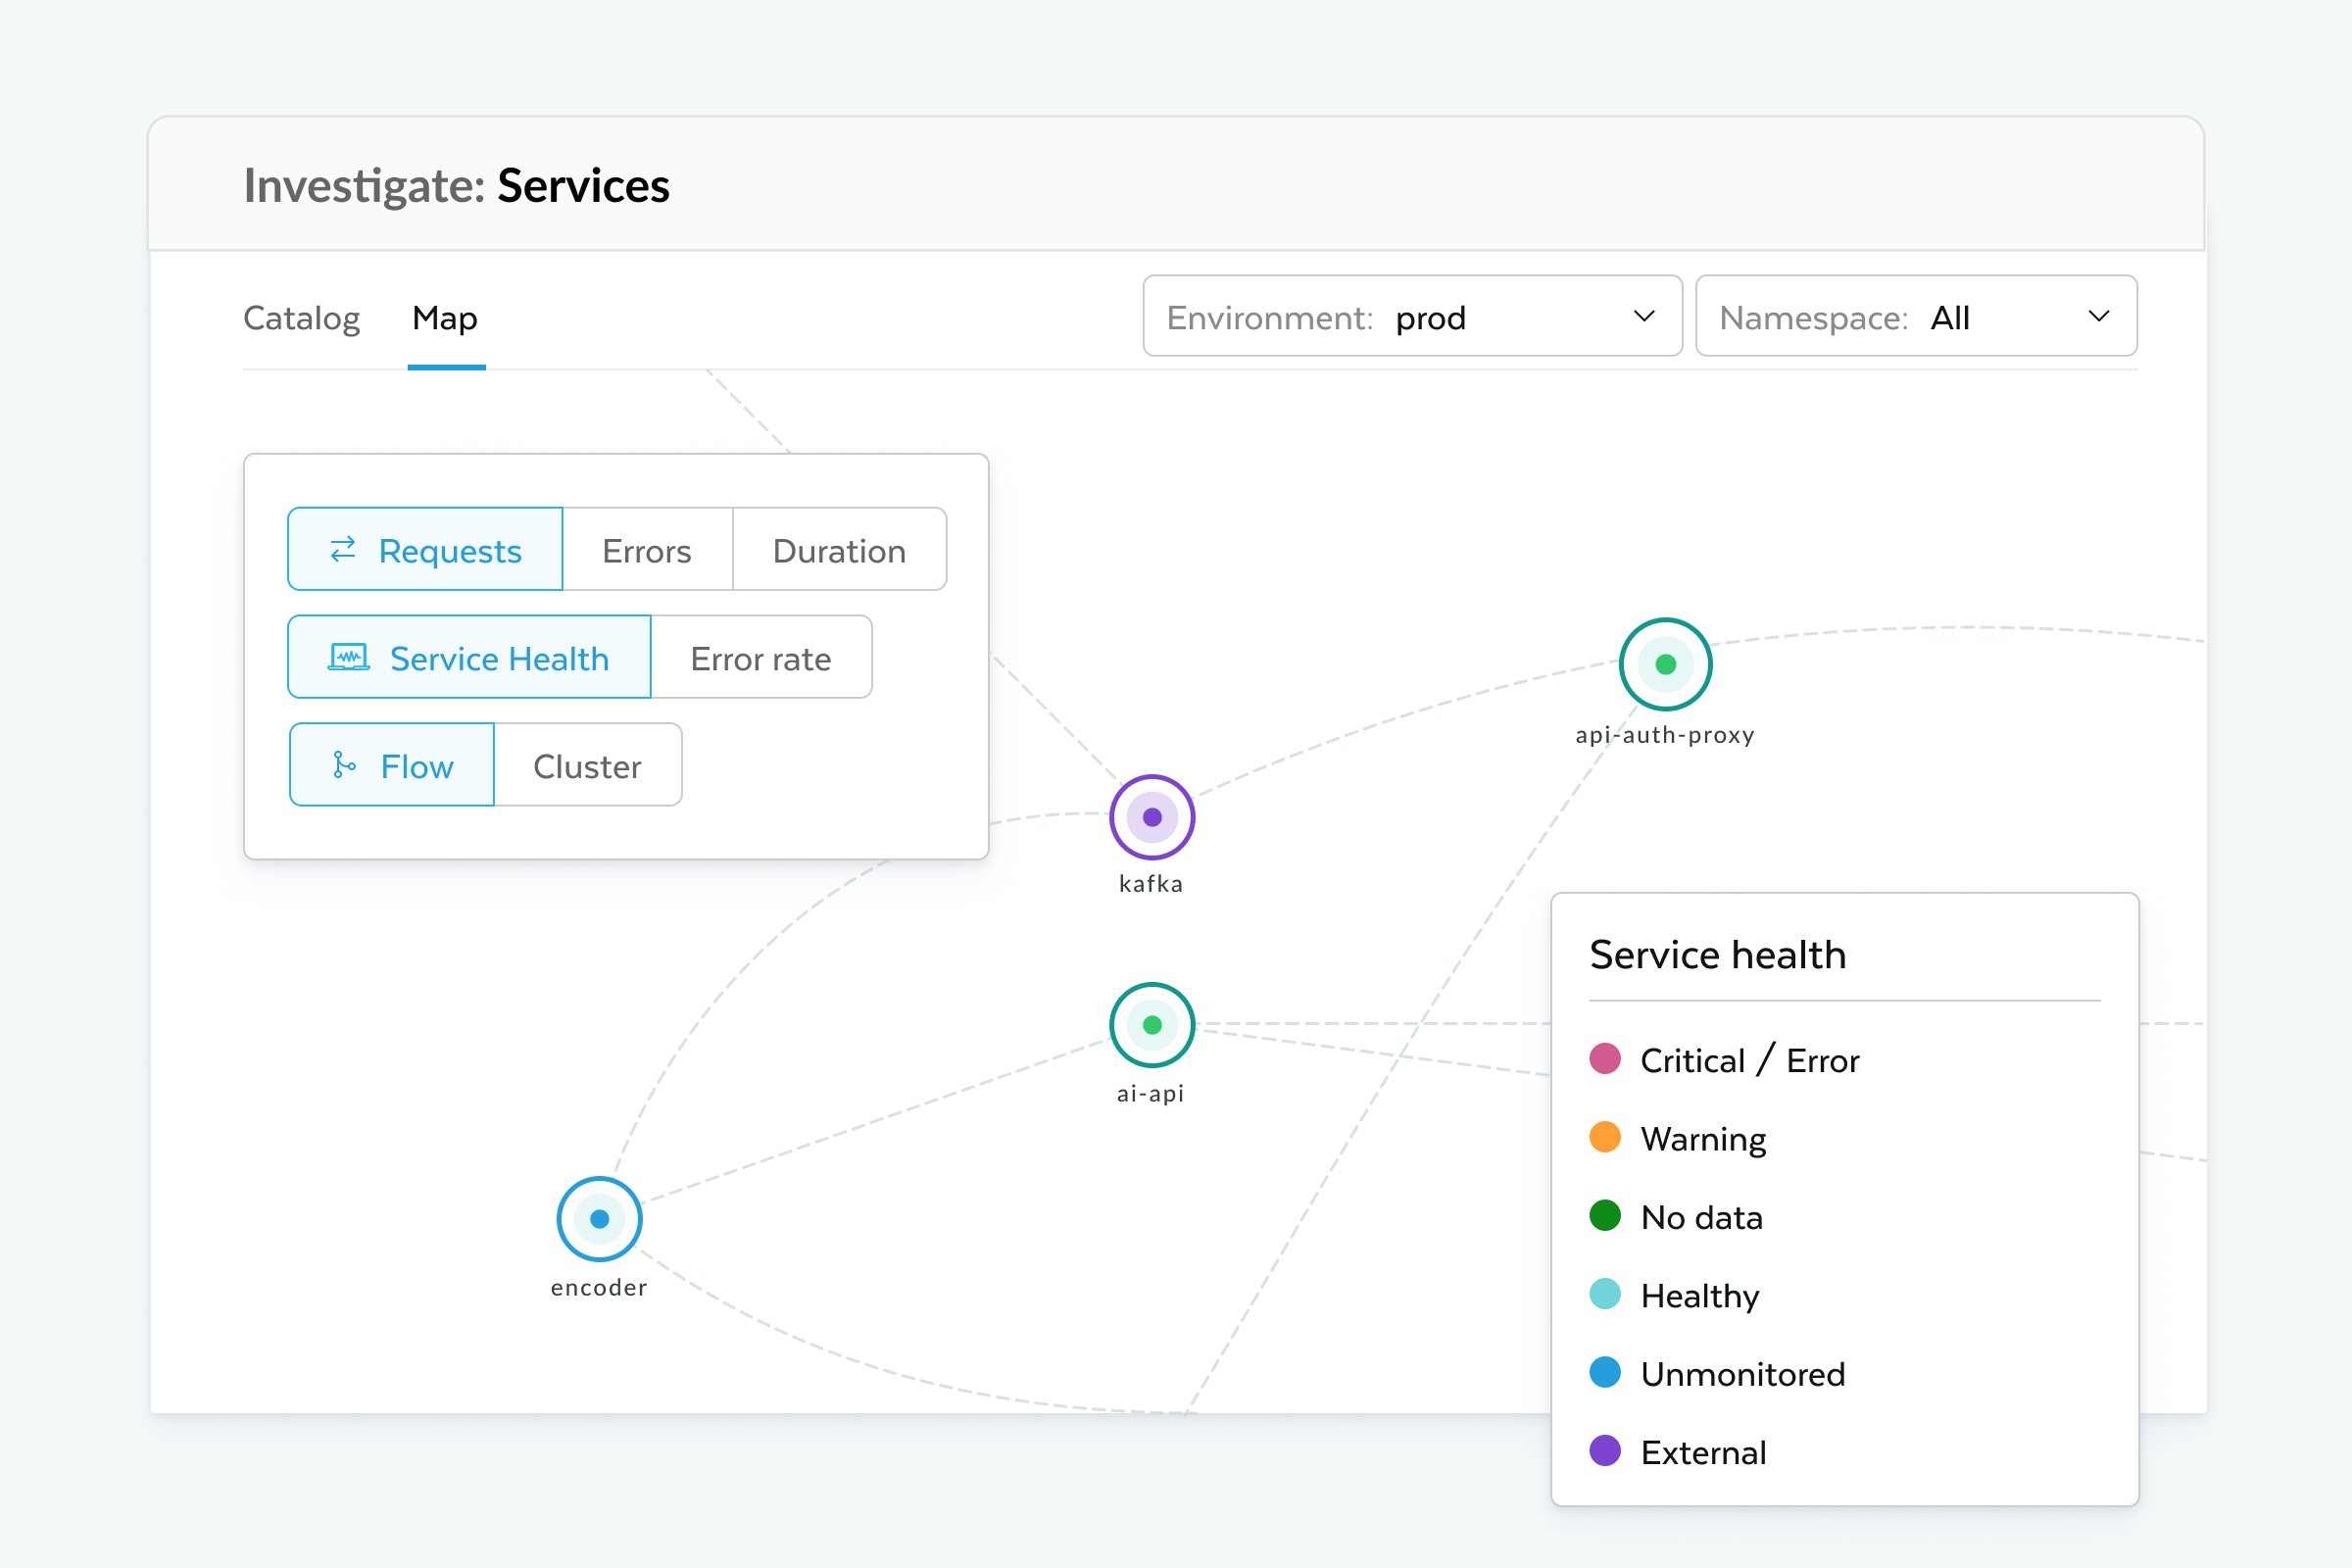
Build a real-time map from OTel data with the Observability Context Graph. Find and connect services to infrastructure, deployments and business entities with one view.

Drill from service alert to root cause in seconds
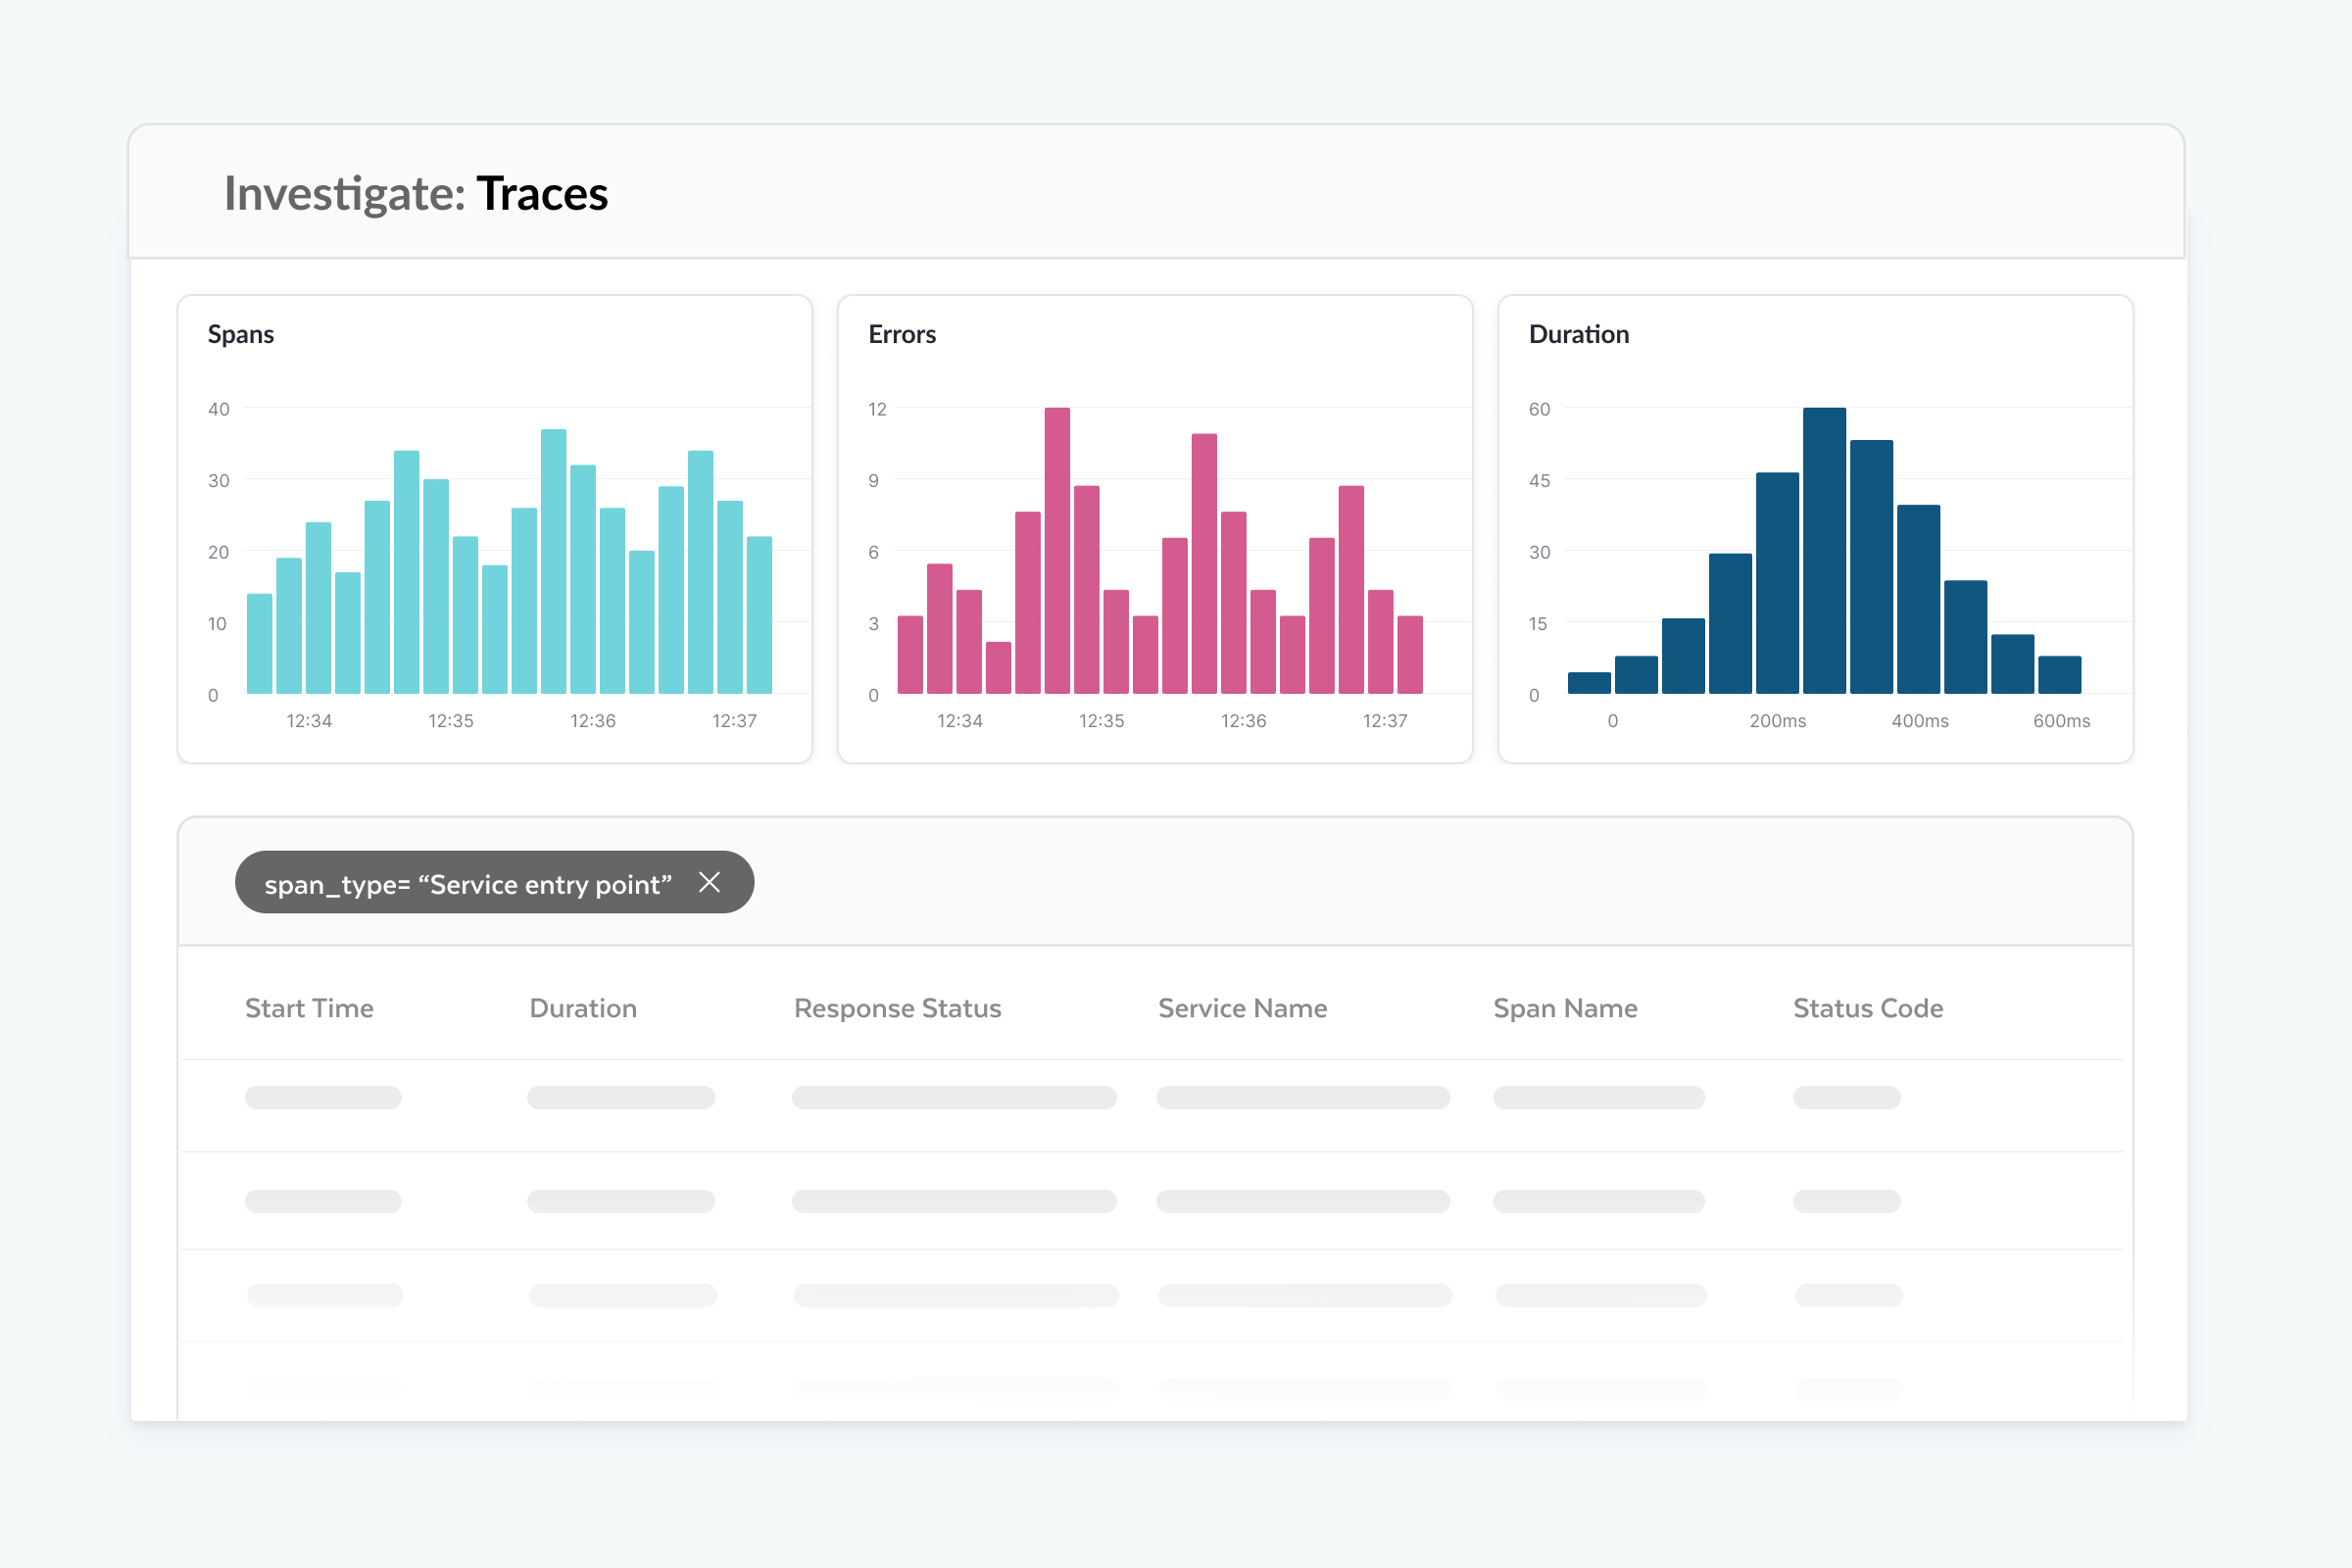
Follow any signal from alert to root cause without losing context. Pivot across correlated logs, traces and metrics in a few clicks with Observe's explorers.
ObserveCustomers




Benefits
Get deep visibility intoapplication performanceand reach root cause faster
Opentelemetry Native
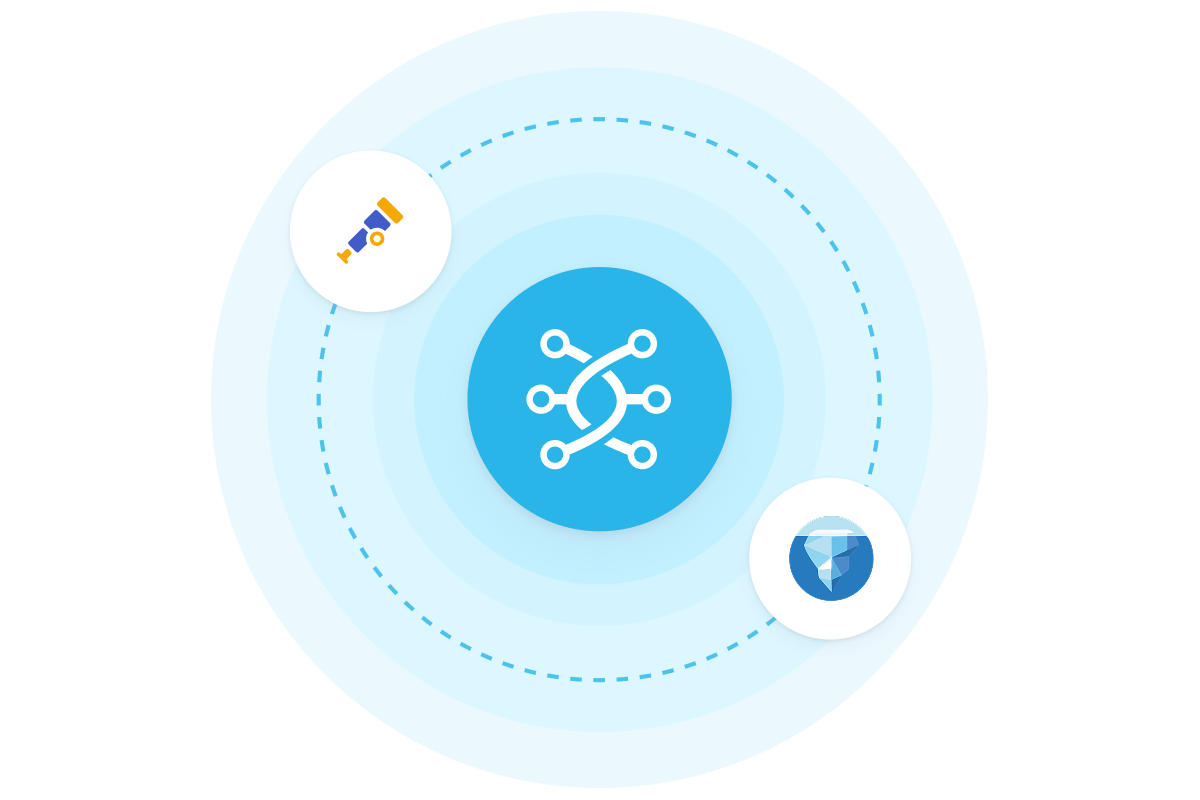
Capture telemetry without vendor lock-in
- Ingest all OTel signals, including traces, metrics and logs, at full fidelity using OTel libraries, SDKs and APIs to instrument code.
- Write observability data directly to Apache Iceberg™ tables (currently in Private Preview) in your own data lake, stored in your object storage, under your control and accessible through the tools your teams already use.
- Cost-effectively store all telemetry for up to 13 months using object storage with 10x compression.
Service discovery
Build one service map for your stack
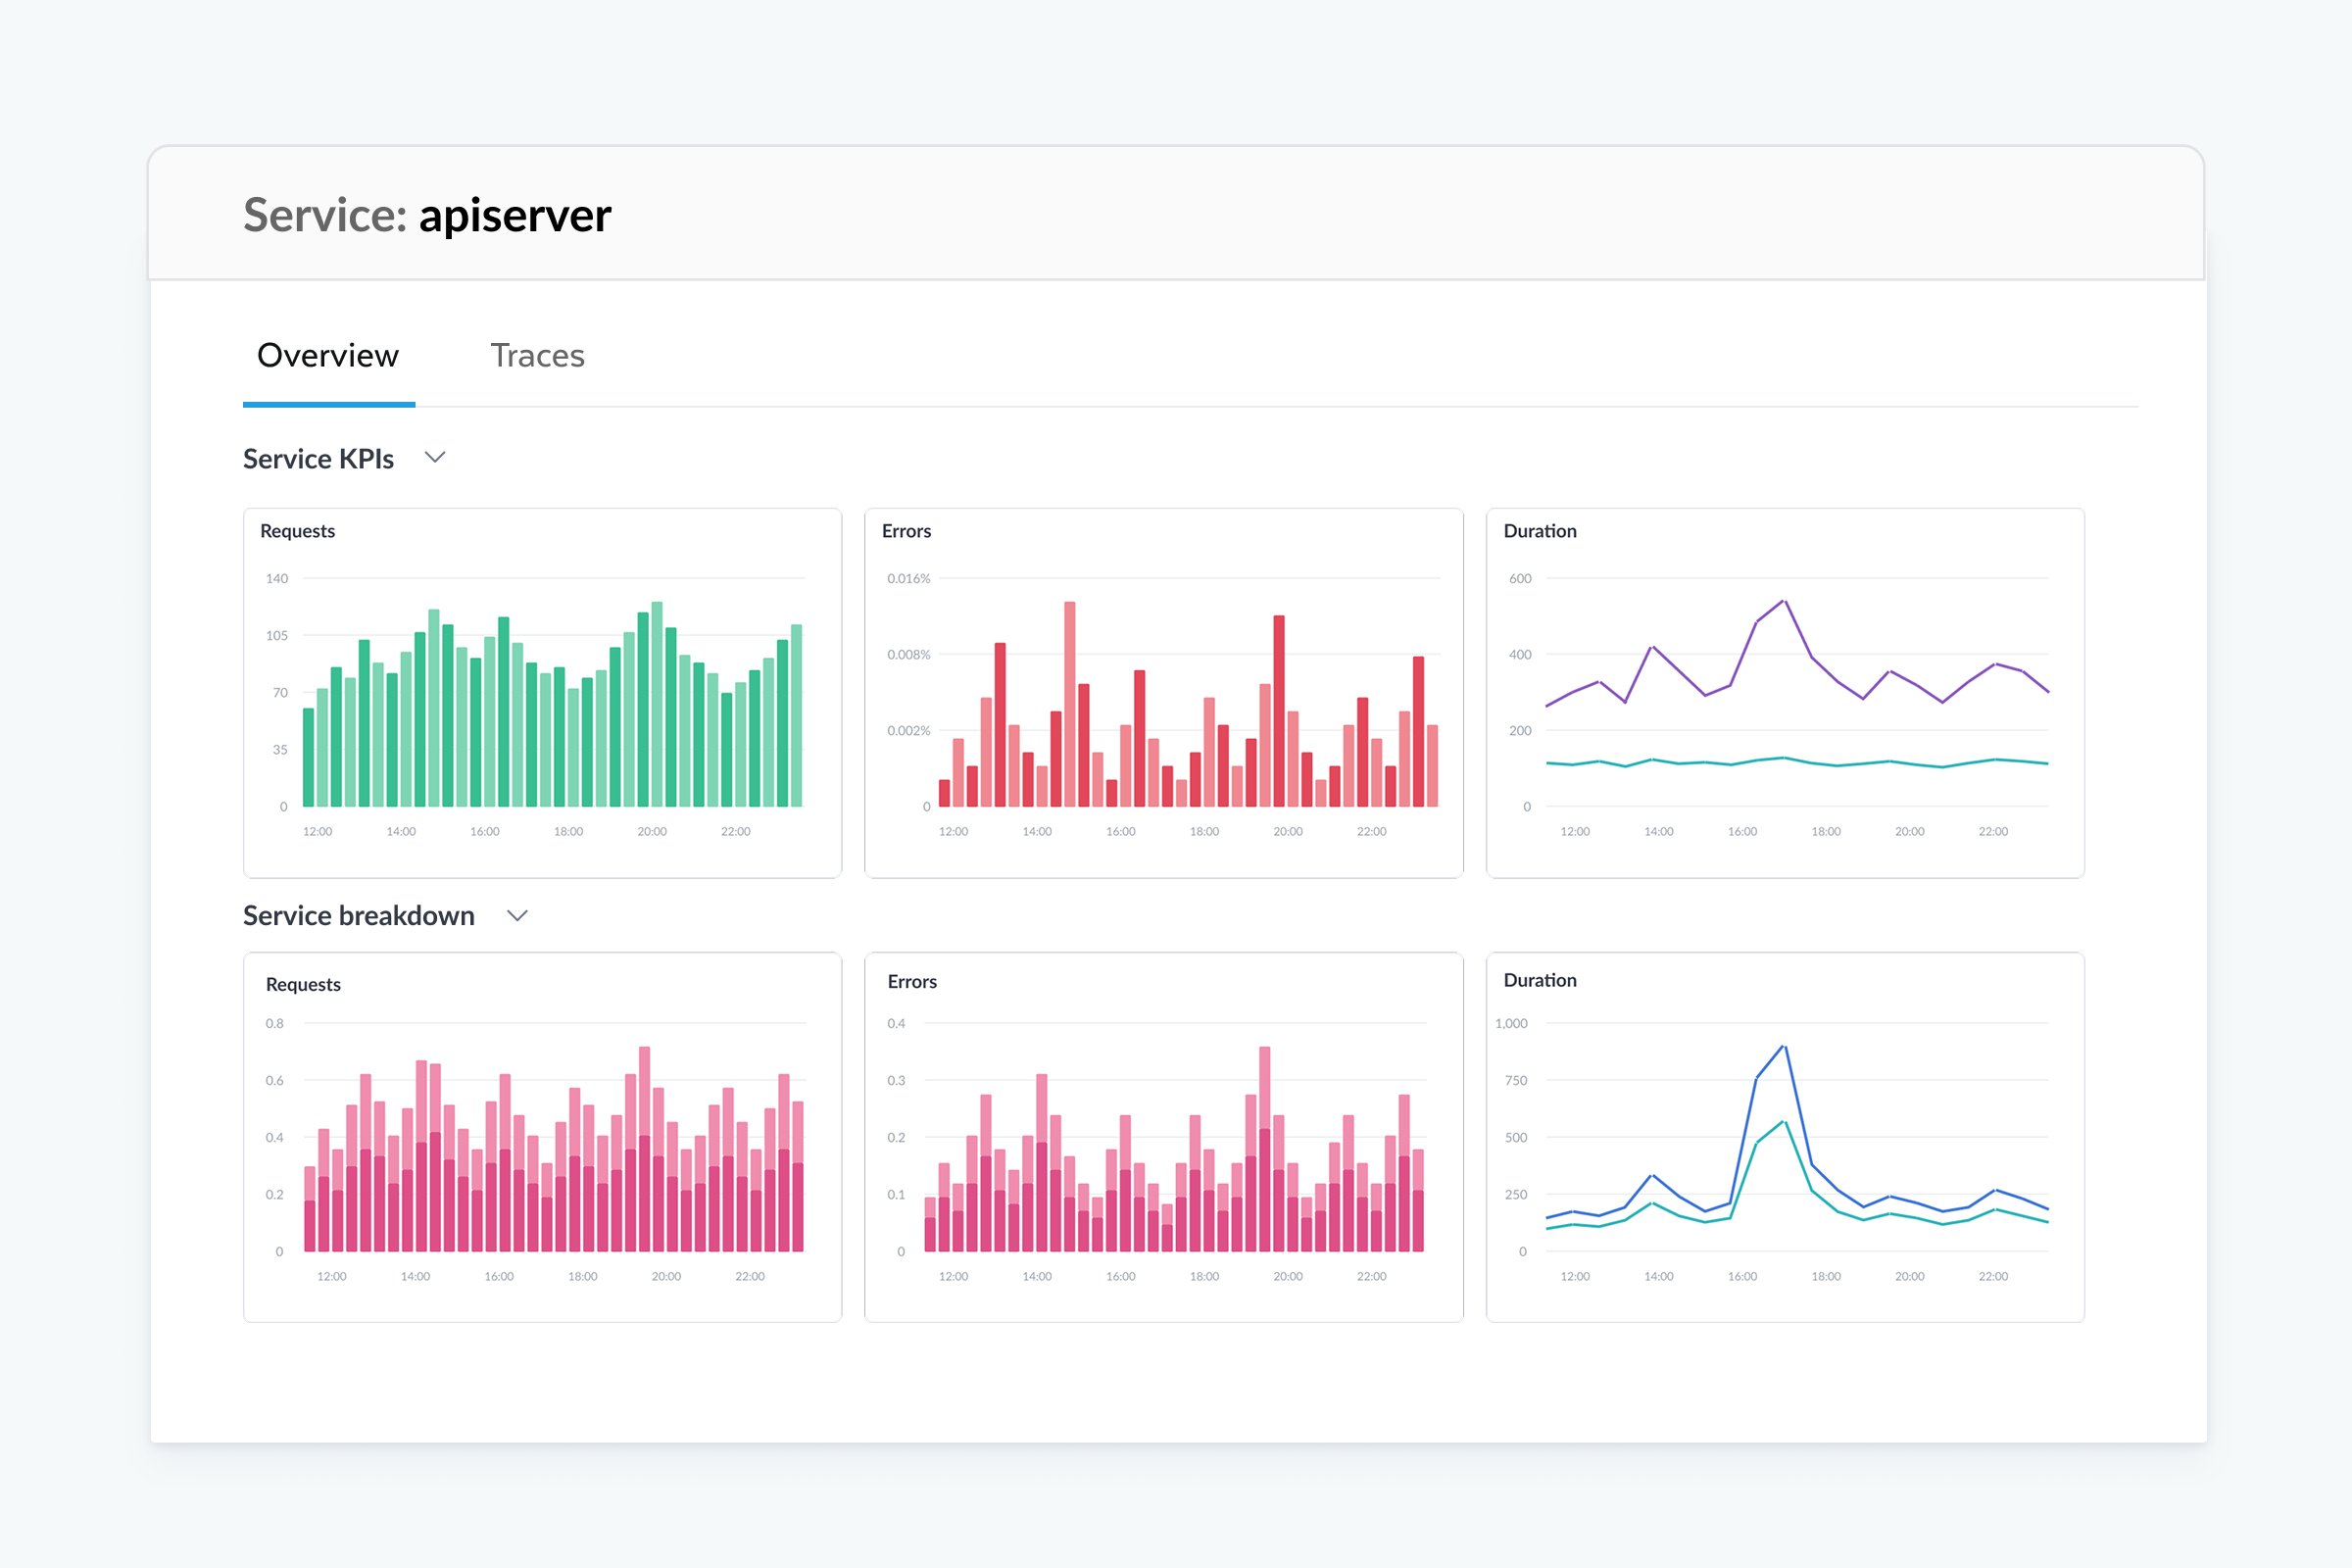
Consolidate metrics across cloud, Kubernetes, databases and apps into one unified view.
Extend visibility to app-specific entities such as payment flows, Kubernetes pods and customer sessions.
Give your whole team access to Golden Signals monitoring without per-seat pricing that limits access to a few experts.
Trace search
Speed up root cause analysis
- Pivot from a trace to correlated logs, metrics and infrastructure data without manual stitching between tools that wastes hours during incidents.
- Drill from a service-level alert to individual traces and correlated spans in seconds.
- Analyze every slow transaction with 13 months of unsampled trace data — no more missing the critical traces that explain production issues.
Deploy confidently
Catch performance regressions the moment a release lands
- Correlate commits, build events and deployments directly with service metrics in the Context Graph.
- Automatically show before-and-after error rates, latency and saturation for every deployment.
- Flag anomalies at deployment time to identify regressions before they reach customers.
- Work across Kubernetes, cloud VMs, containers and microservices from one view.

Topgolf Diagnoses Application Issues Faster Across 50+ Venues with Observe
"Before Observe, I used to have three monitors up with different tools open, trying to correlate this timestamp over here with that timestamp over there. With Observe, it's all in one place."
Ethan Lilly, Engineering Manager, Topgolf

Get Started
Take the next stepwith Observe by Snowflake
Start your free trial
Performance at scale
Faster troubleshooting
Lower cost with an open data lake



Application Performance Monitoring
Frequently Asked Questions
Get quick answers to your APM questions and learn how Observe by Snowflake helps you monitor, troubleshoot and optimize application performance.
Answer: APM is the practice of tracking the health, speed and behavior of software applications in production. APM tools collect distributed traces, metrics and logs to help engineering teams understand how requests flow through their systems, detect performance bottlenecks and resolve issues before they affect users.
Modern APM goes beyond basic uptime monitoring, giving teams end-to-end visibility across microservices, databases and infrastructure so they can answer not just whether something is broken, but why it broke, where and which deployment caused it. For engineering teams running complex, interconnected systems, APM is a critical foundation for reliability and fast incident response.
Observe is an observability platform built on Snowflake's AI Data Cloud that gives you full visibility across your application stack, including:
- Distributed traces across microservices, databases, AI agents and cloud infrastructure
- Service latency, error rates and throughput metrics in real time
- End-to-end user request flows from browser to backend
- Deployment events and their correlation with performance changes
- Infrastructure health across Kubernetes pods, cloud instances and containers
- Business-specific entities such as transactions, customer sessions, payments and any custom object you define
Traditional APM tools were built for monolithic applications, smaller data volumes and teams where only a few experts needed access to monitoring data. That design forces tradeoffs that create real problems at scale:
- Sampling: To control costs, most APM tools keep only a fraction of your traces. That means the slow request or error that caused your incident is often the one that didn't make it into storage.
- Siloed data: Traces, logs and metrics live in separate tools, forcing engineers to manually stitch together context across systems during incidents when time matters most.
- Per-seat pricing: Access is limited to a handful of engineers, slowing down investigations and creating bottlenecks.
- Proprietary instrumentation: Switching tools means re-instrumenting your entire application from scratch.
Observe is built differently:
- Observe correlates traces with logs and metrics in a single workflow.
- Pricing is based on data volume rather than seats, so every developer gets full visibility.
- Default pricing includes 30 days of hot retention, already more than most APM tools offer for traces, with options to extend up to 13 months based on your needs.
- OpenTelemetry-native instrumentation keeps your telemetry vendor-neutral.
- AI SRE continuously analyzes your telemetry and can investigate incidents autonomously, a capability traditional APM tools don’t offer.
Yes. Observe is OpenTelemetry-native. Instrument your applications using OTel libraries for automatic instrumentation or OTel SDKs and APIs for custom code. No proprietary agent required.
Observe charges based on data volume, not seats. Every developer on your team gets full access to APM data, so you don’t have to limit access to a handful of experts. For more information, visit the Observe pricing page.
