

Log Management: Fundamentals, Lifecycle and Best Practices
Learn how log management works, from collection and storage to analysis and retention. Explore best practices for managing log data in modern cloud and distributed environments.
LOG MANAGEMENT DEFINED
Log management is the discipline of handling log data throughout its entire lifecycle. It covers several stages that deal with how logs are generated, collected, transported, parsed, centralized, stored, analyzed and eventually retired.
Every application, service and infrastructure component generates logs. As organizations adopt cloud platforms, containers and distributed architectures, the volume of log data continues to grow. Without a structured approach, valuable operational information becomes difficult to search, retain and analyze.
Log management provides the processes and architecture needed to turn raw log data into useful operational insight. It helps engineering teams investigate incidents, improve system reliability and maintain long-term visibility across complex environments. This guide explains how log management works, the technologies and practices it relies on, and how it supports modern observability.
What is log management?
Log management is the discipline of handling log data throughout its entire lifecycle. It covers several stages that deal with how logs are generated, collected, transported, parsed, centralized, stored, analyzed and eventually retired. A well-designed log management strategy gives engineering teams fast access to operational data without allowing storage costs or operational complexity to spiral as systems grow.
Logs are also one of the three pillars of observability, alongside metrics and traces. They provide the event-level detail needed to investigate incidents and understand system behavior. Metrics quantify system health over time and traces reveal how requests move through distributed services and logs. Treating logs as part of a broader observability strategy helps teams troubleshoot faster and improve application reliability.
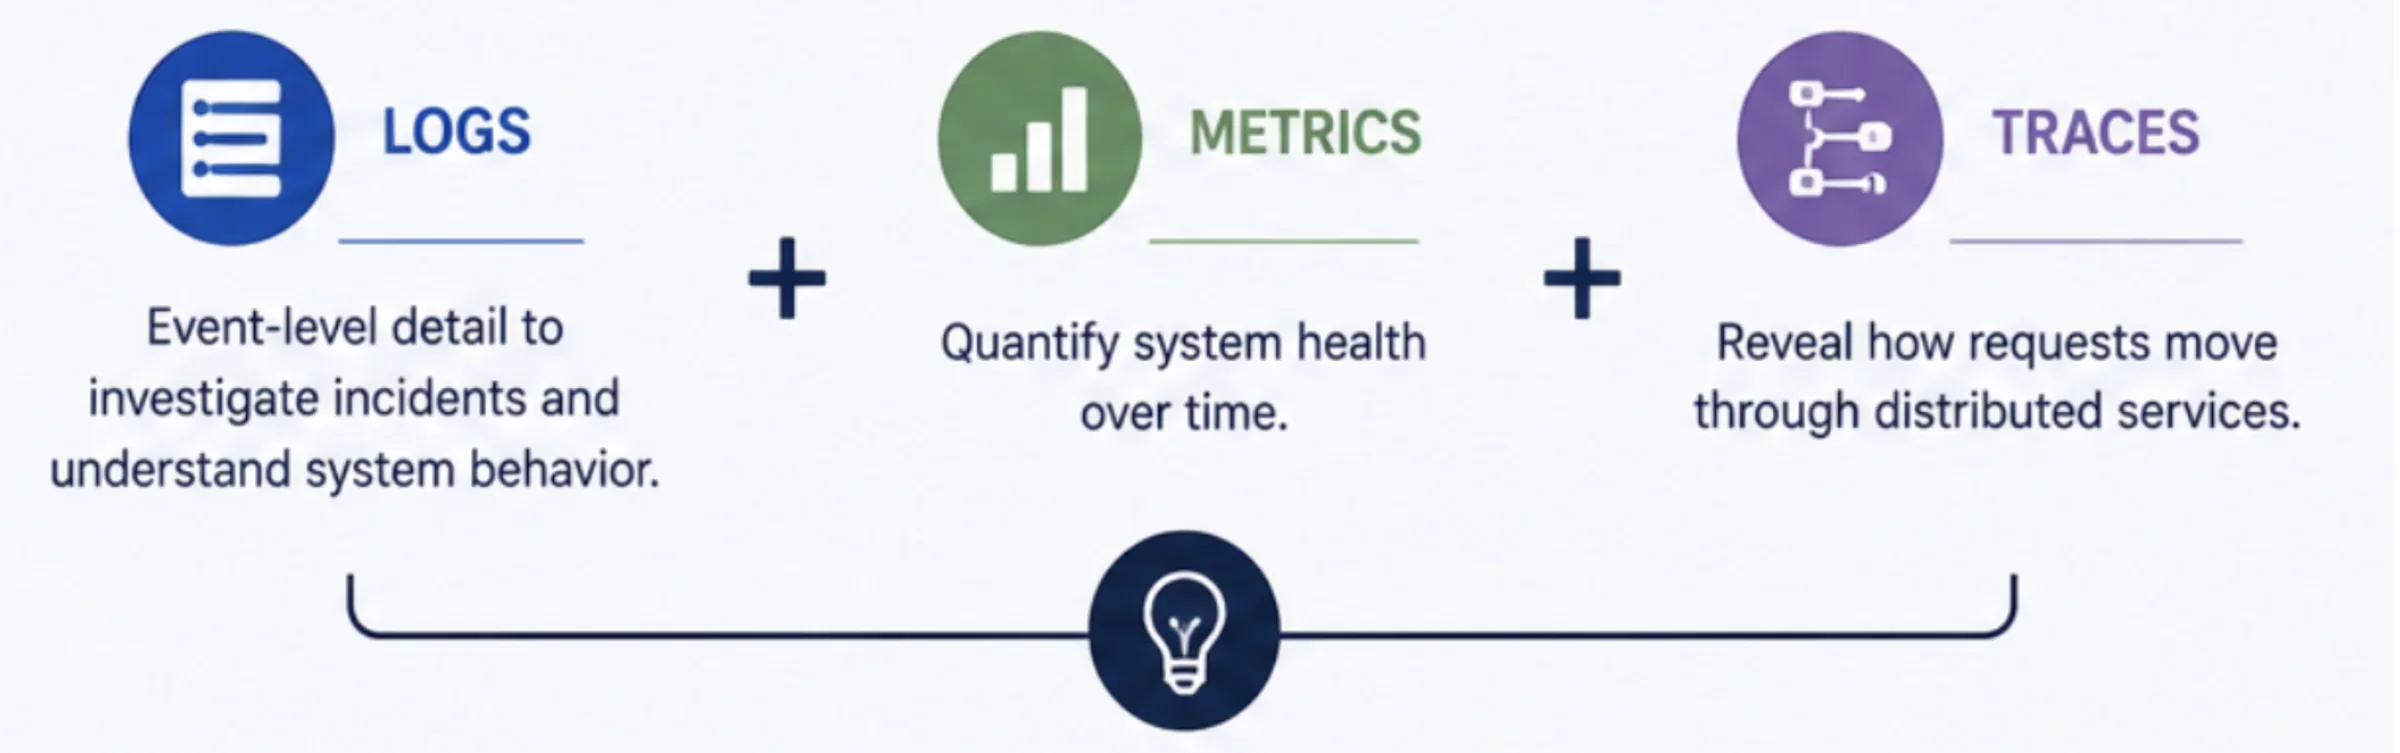
Figure 1: Three pillars of observability
Every modern system produces logs because every system records events as they occur. A log file contains individual log entries, each representing a timestamped record of an event. These events may include a successful user login, an API request, a database query, a configuration change or an application error. Together, they create a chronological history of how systems behave under real-world conditions.
Managing this data becomes increasingly complex as organizations scale. Hundreds of services may generate millions of log entries every hour across multiple environments. Without a structured approach, important events become difficult to find and troubleshooting takes longer because engineers spend more time locating relevant information than analyzing it.
Log management addresses these challenges by establishing a repeatable process for moving data through a log pipeline. Raw events are collected from their source and sent to a centralized destination. They are then parsed into structured fields, enriched with additional context and stored according to retention requirements. Logs are analyzed when needed and eventually archived or removed.
Several foundational concepts appear throughout the rest of this guide. Log levels classify event severity using values such as DEBUG, INFO, WARN and ERROR. This helps teams separate routine operational messages from actionable issues. Log schemas establish a consistent structure for log fields across applications and services and make it possible to query, filter and correlate data efficiently. As organizations move from unstructured text toward structured logging, consistent schemas become essential for scalable log management.
Types of logs and log data formats
Not all logs capture the same type of information. Different systems produce different categories of log data. Each of these categories serves a distinct operational purpose. An effective log management strategy brings these sources together so engineers can investigate issues across an entire environment instead of isolated components.
Common log types include:
- Application logs, which record application events such as requests, exceptions, transactions and business operations.
- Server and system logs, which capture operating system activity, resource usage, hardware events and service status.
- Network logs, which record traffic flowing through routers, switches, firewalls and load balancers.
- Security and audit logs, which document authentication events, privilege changes, policy violations and other security-relevant activity.
- Cloud and infrastructure logs, which capture events from managed cloud services, containers, Kubernetes clusters, virtual machines and serverless workloads.
The format of log data directly affects how easily it can be parsed and queried. Traditional systems often generate plain text or syslog records that require additional parsing before analysis. Modern applications increasingly produce JSON logs and other structured or semi-structured data formats, where important fields such as timestamps, request IDs, host names, error codes and the like are already separated into discrete attributes.
This shift reflects the broader move from unstructured to structured logging. Unstructured logs remain useful for human readability but require more processing before machines can search or analyze them. Structured logging stores event data in predictable fields and allows engineers to filter, aggregate and correlate logs much more efficiently.
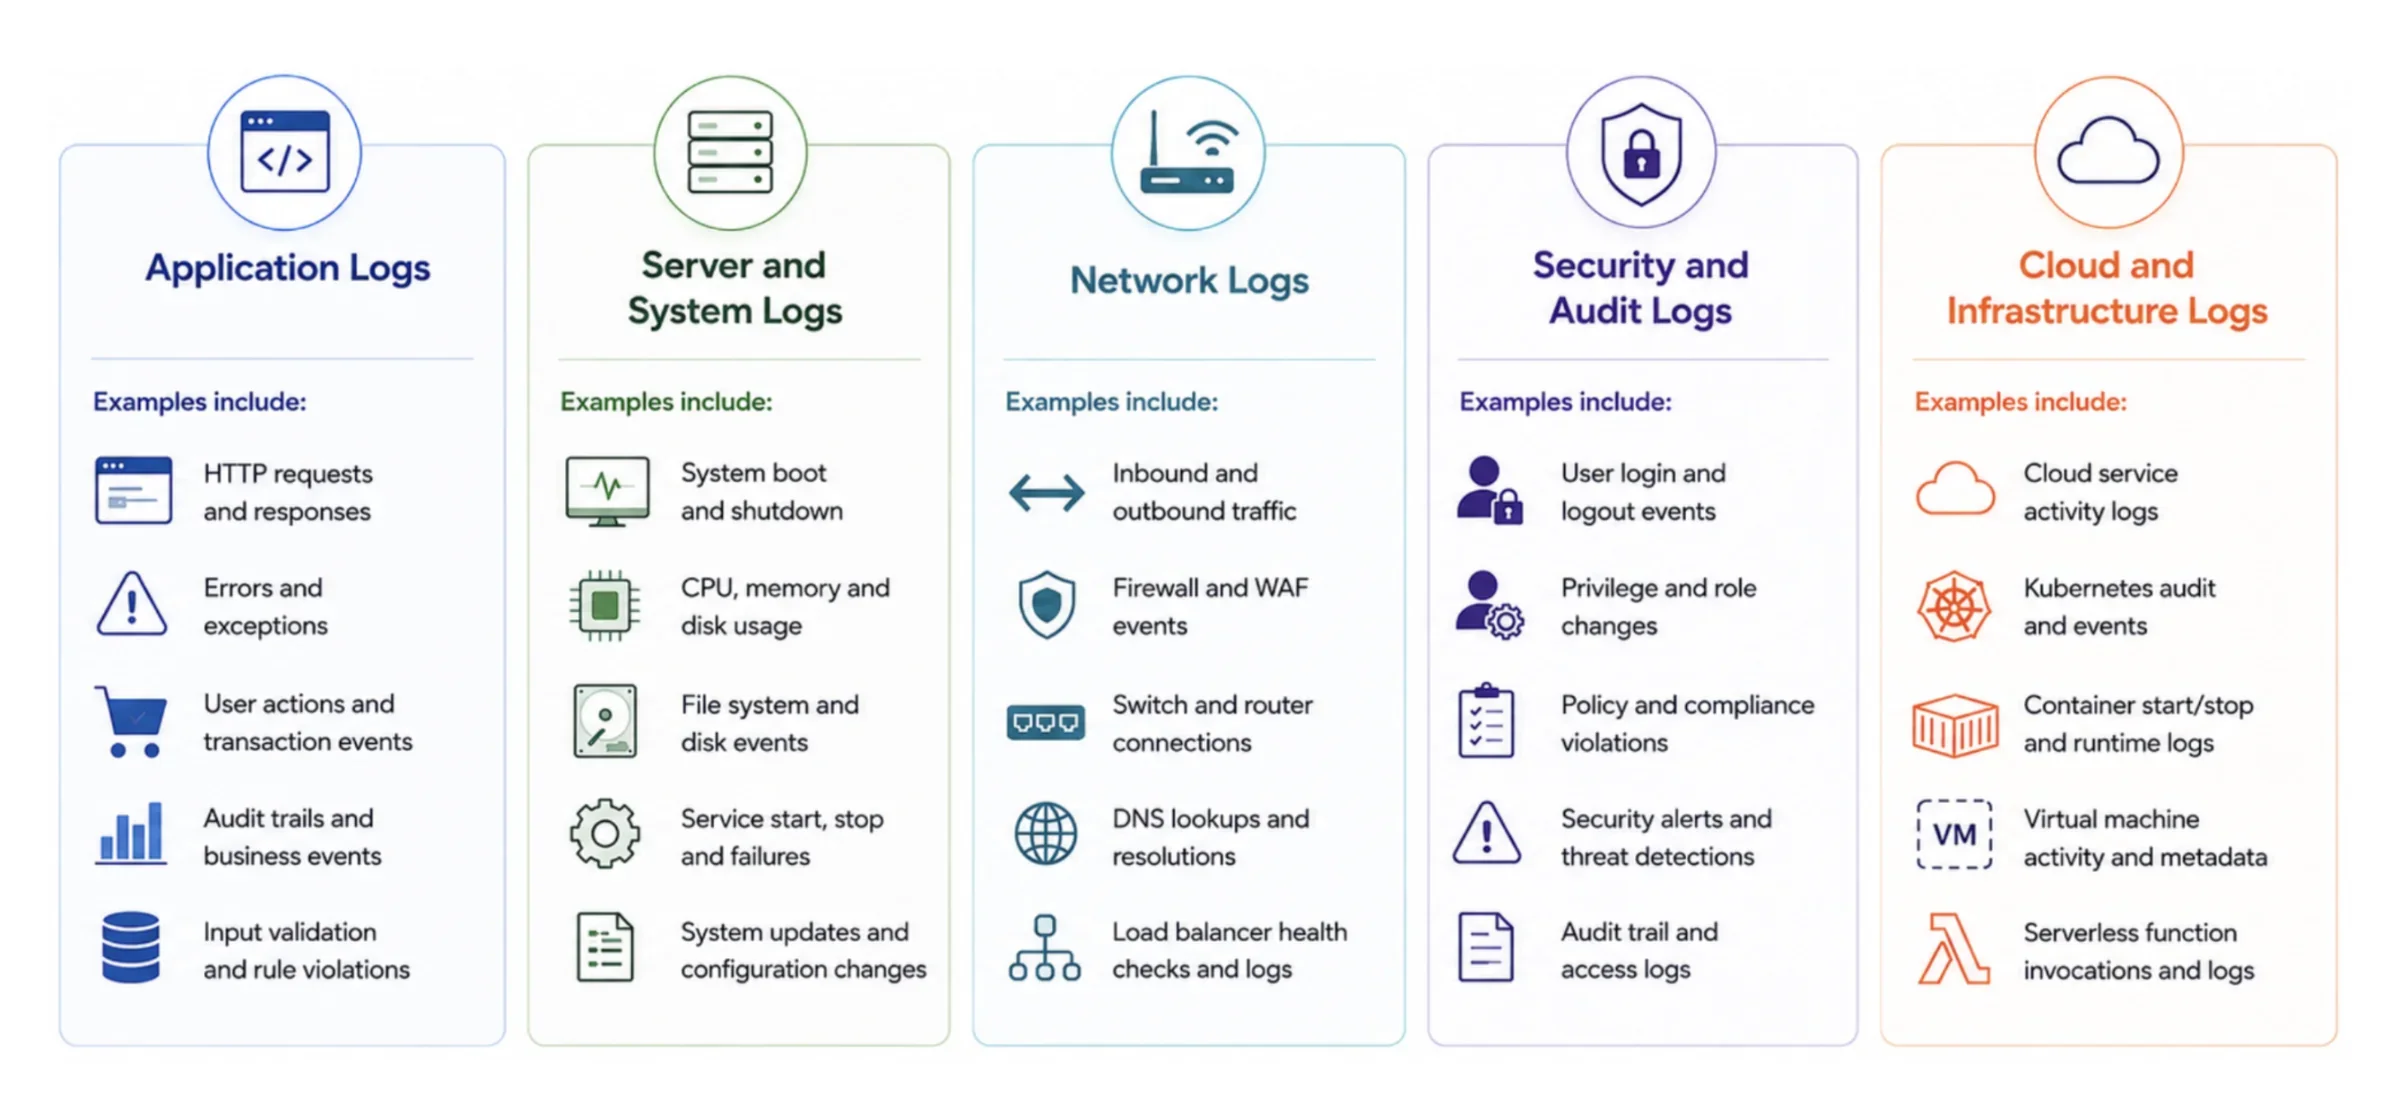
Figure 2: Types of logs
Consistency is equally important. A shared log schema ensures that services record common attributes using the same field names and formats. Without a standard schema, querying logs across dozens or hundreds of services becomes unnecessarily complex.
Structured logging deserves its own discussion because it influences nearly every stage of the log management lifecycle, from parsing and storage to analytics and observability. This dedicated guide to structured logging explores implementation patterns, schema design and practical recommendations for building queryable log data at scale.
Log management brings together application, infrastructure, network and security logs in structured formats that support efficient search and analysis.
How log management works: the log lifecycle
Log management follows a continuous lifecycle that transforms raw event data into actionable operational insight. Although implementations vary, most modern log pipelines follow the same sequence: generate, collect, ship or forward, parse and enrich, centralize and aggregate, store and retain, analyze and correlate, and finally retire data according to retention policies.
The lifecycle begins when applications, infrastructure, operating systems and cloud services generate log entries. Every event contributes another record describing how the system behaved at a particular moment.
The next stage is collection, where log agents or collectors capture data at its source. These tools prepare logs for transport without significantly affecting application performance. Collected logs are then shipped or forwarded through the log pipeline. Shipping moves logs into centralized storage for long-term analysis, whereas forwarding routes logs between intermediate systems before they reach their final destination.
During parsing and enrichment, raw log lines become structured records. Fields such as timestamps, service names, request identifiers, geographic locations or deployment metadata are extracted or added. By doing this, future searches become significantly more effective.

Figure 3: Log management lifecycle
Logs are then centralized and aggregated into a single platform that consolidates telemetry across applications and infrastructure. Rather than investigating isolated systems, engineers can search across an entire environment from one location.
After centralization, logs enter the storage and retention phase. Retention policies determine how long data remains available and storage tiers balance accessibility against cost through hot and cold storage strategies.
When incidents occur, teams move into analysis and correlation. Queries, dashboards and investigations connect related events across services, often alongside metrics and traces, to identify root causes quickly. Finally, logs reach the retirement stage, where expired data is archived or deleted according to business, regulatory or operational requirements.
Collecting logs is no longer considered the hardest part of log management. The greater challenge is retaining growing volumes of data without driving up costs or discarding information that may later become critical during troubleshooting, performance analysis or security investigations.
The log management lifecycle moves data from generation and collection through storage, analysis and retention to support operational and security investigations.
Collecting, shipping and forwarding logs
Log management begins with reliable collection. Every application, server, container, network device and cloud service generates event data locally, but those logs provide limited value if they remain isolated. Collection and transport move log data from its source into a centralized platform where it can be searched and analyzed.
A log collector or log agent runs close to the workload generating the data. These components monitor log files, operating system events or application output, then package that information for transmission through the log pipeline.
Two of the most widely adopted open source collectors are Fluentd and Fluent Bit. Fluentd offers a rich plugin ecosystem for collecting, transforming and routing logs across complex environments. Fluent Bit provides a lightweight alternative designed for containers, Kubernetes clusters, and resource-constrained systems. Both function as pipeline components that route log data into downstream storage and analytics platforms rather than acting as destinations themselves.
Although often used interchangeably, log shipping and log forwarding describe different stages of transport. Log shipping refers to moving collected logs into centralized storage for indexing or analysis. Log forwarding focuses on routing or relaying logs between intermediate systems before they reach their final destination.
Collection is also the best point to improve data quality and reduce unnecessary volume. Log filtering removes noisy or low-value events before they consume storage resources. Log enrichment adds useful metadata such as environment, region, application version, host information, deployment identifiers and the like, which makes later investigations significantly more efficient.
Log collection captures events from applications and infrastructure and moves them through a pipeline to a centralized log management platform.
Parsing and structuring log data
Raw log lines are designed for humans to read, not for systems to analyze at scale. Log parsing converts unstructured or semi-structured records into discrete fields that can be filtered, queried, aggregated and correlated across services.
Parsing typically extracts information such as timestamps, request identifiers, usernames, IP addresses, status codes, error messages and more from each log entry. Techniques such as field extraction, grok patterns, and data normalization transform inconsistent log formats into predictable records that support reliable analysis.
The quality of downstream analytics depends heavily on how consistently applications generate logs in the first place. Structured logging simplifies parsing because applications write fields in predefined formats instead of embedding information inside free-form text. Less parsing work reduces operational complexity and improves query performance.
A shared log schema reinforces this consistency across services. When every application records common fields using the same naming conventions and data types, engineers can search and correlate logs without creating custom parsing rules for every workload.
Parsing and structured logging are foundational practices for modern observability because they determine how efficiently organizations can search, analyze and retain growing volumes of telemetry.
Log parsing extracts searchable fields from raw events, and structured logging improves query performance and data consistency.
Centralizing and aggregating logs
As organizations grow, logs become distributed across applications and infrastructure. Searching multiple systems during an incident slows investigations and makes it harder to understand what happened. Centralized logging solves this by bringing log data into a single platform where engineers can search and analyze it from one place.
A centralized log management platform collects data from applications and infrastructure, and creates a consistent view of system activity. Instead of moving between individual tools, platform engineers, SREs and security teams work from the same operational data set. This shared view can make troubleshooting more efficient and help reduce duplicate data pipelines.
Log aggregation complements centralized logging by combining related events into a more useful data set. Aggregation can summarize repetitive events or combine logs from multiple instances of the same service and make large data sets easier to interpret without removing valuable context.
Many log management platforms rely on indexing to accelerate searches. Indexing improves query performance, but it also increases storage requirements and operational costs. As telemetry volumes grow, organizations often face a trade-off between fast search performance and the cost of retaining and indexing large volumes of log data.
Centralized logging and log aggregation form the foundation for scalable observability. Once logs are available in a single location, engineering teams can correlate activity across systems instead of investigating isolated components.
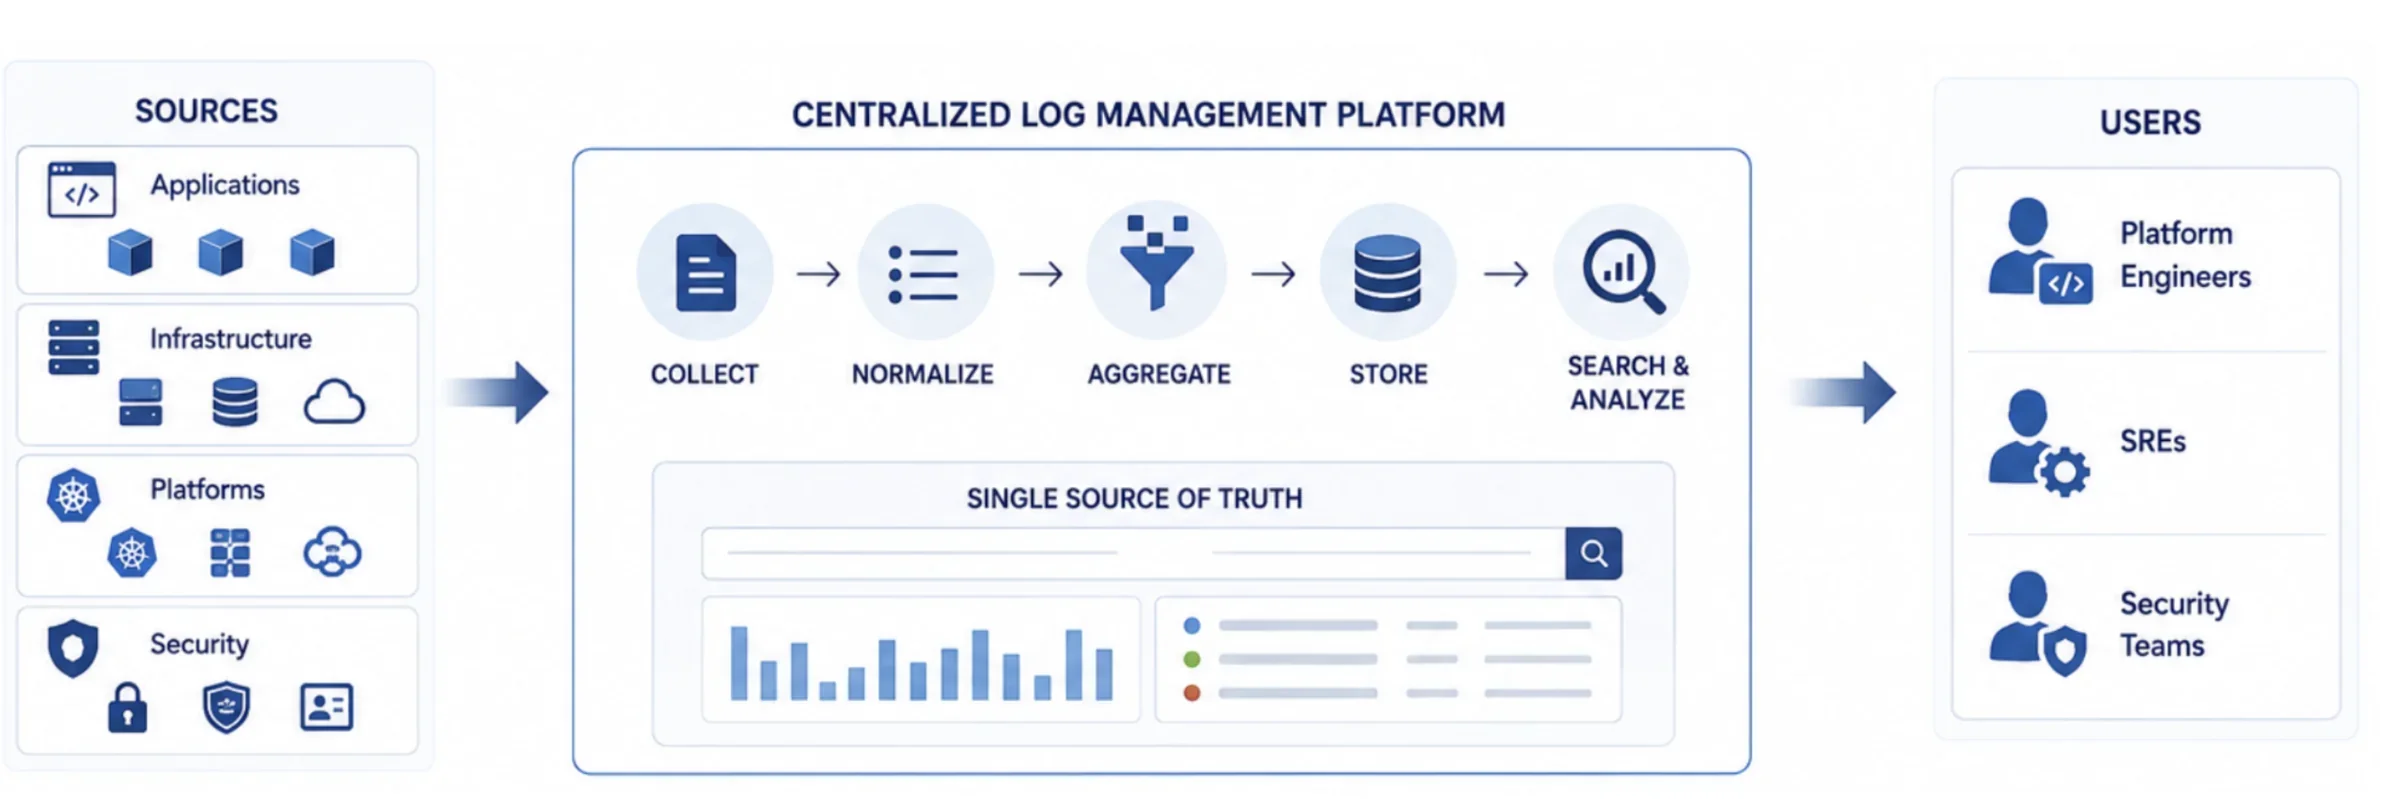
Figure 4: Illustration of centralized logging
Centralized log management consolidates logs from multiple systems into one platform for faster search, analysis and troubleshooting.
Storing, retaining and rotating logs
For many engineering teams, storing logs becomes more challenging than collecting them. Log volume grows continuously as applications scale, which makes storage strategy an important part of any log management architecture. The goal is to retain valuable operational history without allowing storage costs to grow at the same pace.
A log retention policy determines how long different types of logs remain available. Retention periods depend on operational needs and regulatory requirements. Production application logs may need to remain available for troubleshooting, whereas audit logs are often retained to satisfy compliance obligations.
Log rotation manages the size of active log files by archiving or replacing them according to predefined policies. Rotation prevents local storage from filling unexpectedly and keeps systems running reliably. Compression can further reduce storage requirements by minimizing the space occupied by historical log files.
Many organizations use data tiering to balance performance and cost. Frequently accessed logs remain in hot storage for fast queries, while older logs move to lower-cost cold storage where they can still be retrieved when needed.
Storage architecture also has a significant impact on long-term retention costs. Traditional log management platforms often tightly couple storage and compute, which increases infrastructure costs as log volumes grow. As a result, organizations may reduce retention periods or archive data outside their observability platform to control costs. Platforms such as Observe by Snowflake separate storage from compute, which can give organizations greater flexibility in how they retain and analyze historical log data.
As observability data sets continue to expand, this approach can help organizations preserve historical context for troubleshooting, trend analysis and compliance-related workflows while managing retention requirements.
Log storage strategies use retention policies, rotation and data tiering to balance accessibility, compliance and cost.
Analyzing and correlating logs
The value of log management comes from the ability to investigate problems and understand system behavior. Log analysis transforms raw event data into operational insight by helping engineers identify failures, diagnose performance issues and investigate unexpected behavior.
Analysis usually begins with searching or filtering log data to isolate relevant events. Engineers review application activity or infrastructure events to determine what happened before an incident occurred. The faster teams can locate relevant logs, the faster they can resolve production issues.
Log analysis becomes more powerful when combined with log correlation. Correlation connects related events across applications and infrastructure using identifiers such as request IDs or trace IDs. Looking at correlated logs alongside metrics and traces gives engineers a more complete understanding of how an issue developed across distributed systems.
Artificial intelligence is also changing how teams work with logs. Semantic search helps engineers locate relevant events without relying on exact keywords, and large language models (LLMs) can summarize incidents or group similar errors to accelerate investigations.
Log analysis and correlation connect related events across applications and infrastructure to accelerate root cause analysis.
Log management vs. SIEM
Log management and security information and event management (SIEM) are closely related, but they serve different purposes. Log management focuses on the complete lifecycle of operational log data. It covers collecting, storing and analyzing logs so engineering teams can troubleshoot applications and maintain long-term operational visibility.
An SIEM focuses on security. It analyzes log data to detect threats and generate alerts and helps security teams investigate suspicious activity in order to respond to potential incidents. The two technologies complement each other. A centralized log management platform provides the operational data and a SIEM applies security analytics to that information. Some organizations send selected logs from their central repository into a SIEM, whereas others perform SIEM-style analytics directly on their centralized log platform.
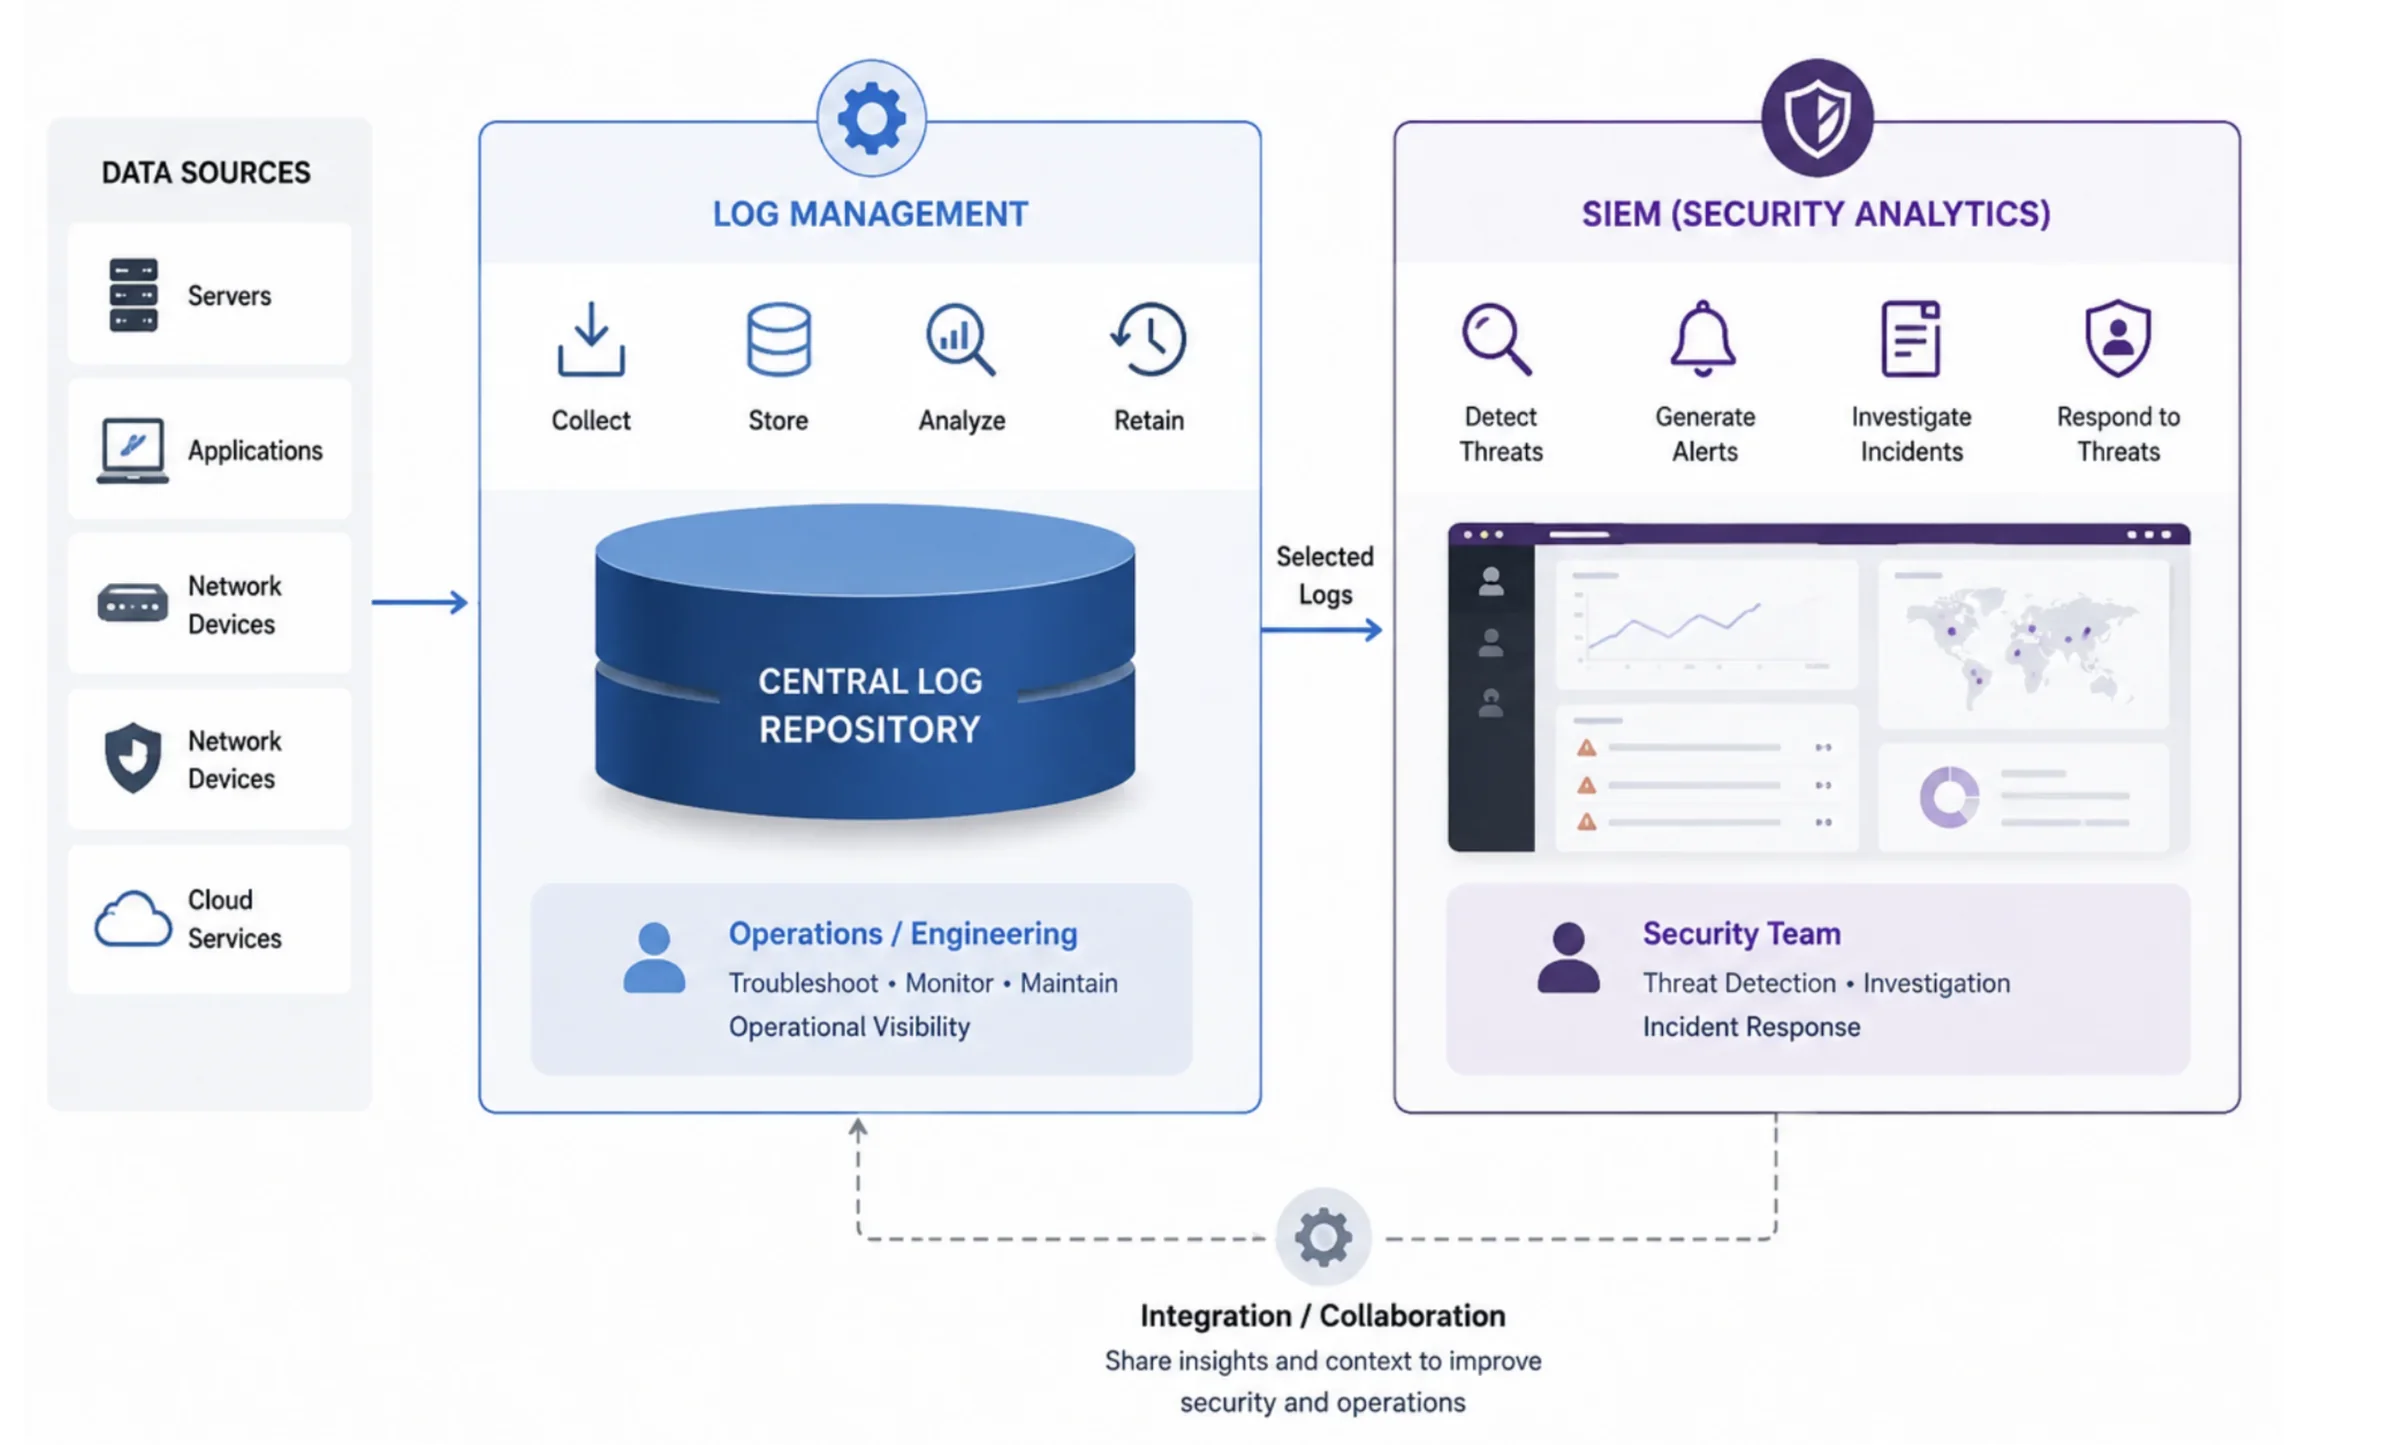
Figure 5: Log Management vs. SIEM
The distinction comes down to purpose. Log management ensures operational logs remain accessible throughout their lifecycle. An SIEM builds on that foundation to support threat detection and security investigations.
Log management best practices
A successful log management strategy depends on consistent engineering practices rather than the tools used to collect or store data. Small decisions made during application development and infrastructure design have a significant impact on how useful logs remain during troubleshooting and long-term analysis.
Teams should start by adopting structured logging and a shared log schema. Structured logs store information in consistent fields instead of free-form text. This makes it easier to query and correlate. A common schema extends that consistency across services, which reduces the effort required to analyze logs from different applications.
Log quality also depends on how applications use log levels. Teams should reserve verbose logging for development and use production log levels deliberately to capture meaningful operational events. This approach reduces unnecessary noise without removing information that may become valuable during an investigation.
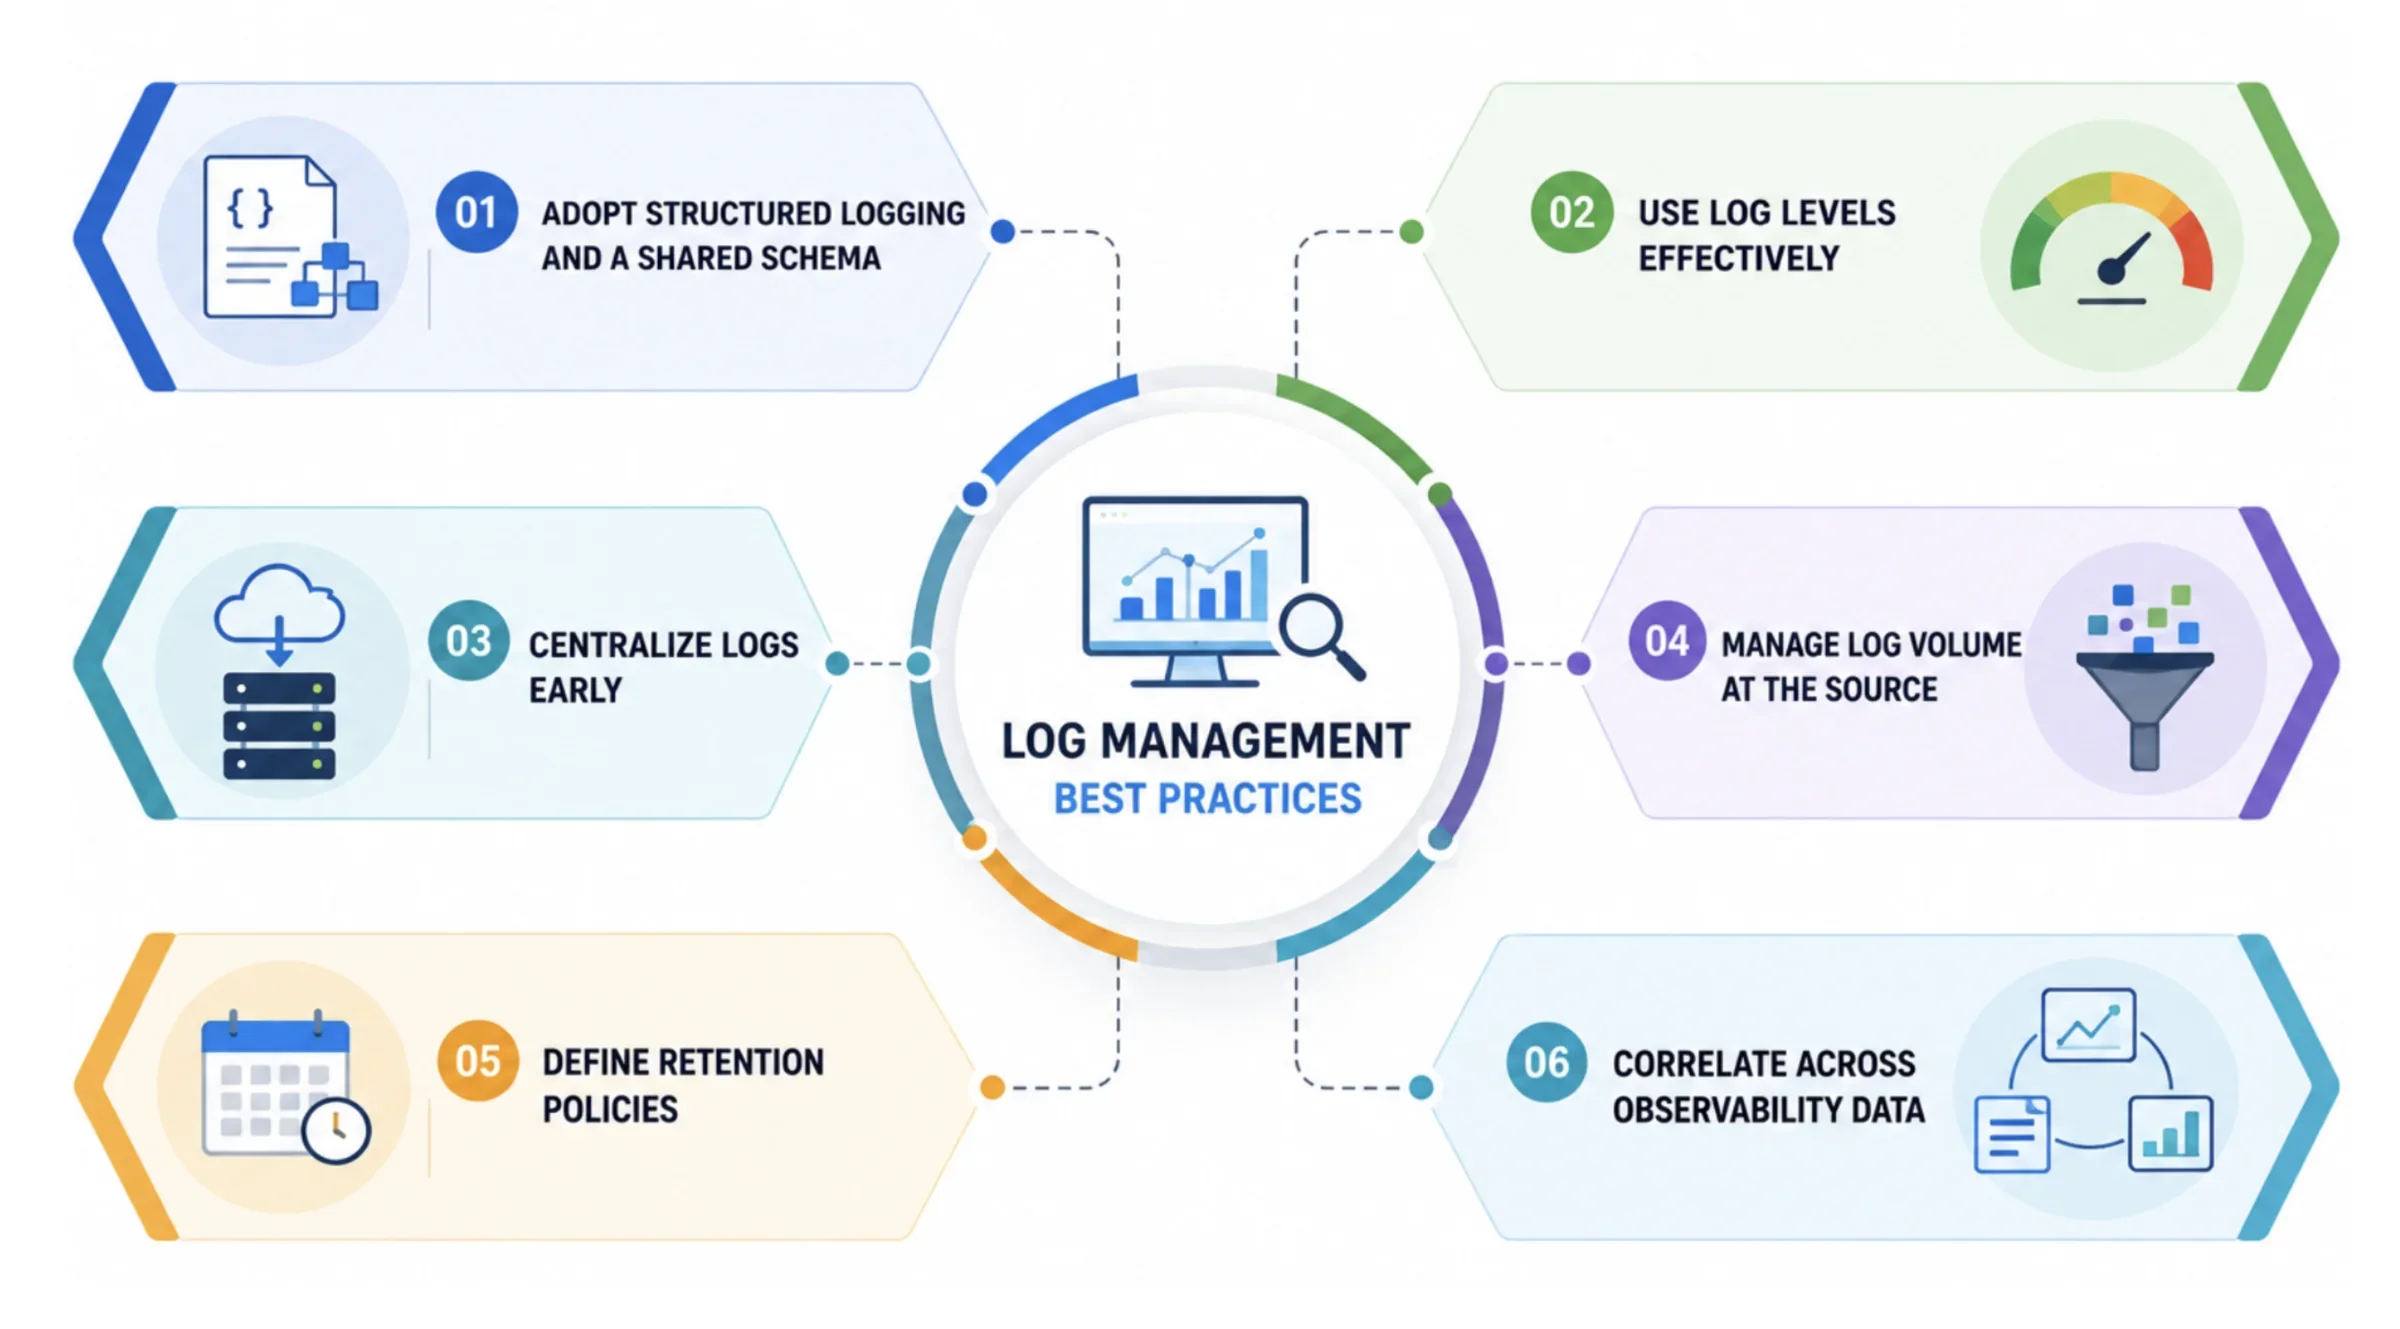
Figure 6: Log management best practices
Centralizing logs early in the pipeline improves visibility across applications and infrastructure. Rather than searching multiple systems, engineers can investigate incidents from a single location and correlate events more efficiently. Managing log volume is equally important. Filtering low-value events at the source prevents unnecessary data from entering the pipeline. This not only reduces storage costs but also the amount of downstream processing required. Retention policies should then determine how long different categories of logs remain available based on operational needs or regulatory requirements.
Logs should be treated as one component of observability rather than an isolated data set. Correlating logs with metrics and traces provides richer operational context and shortens the path to root cause analysis. Together, these practices can support a log management strategy designed to scale with modern applications while balancing performance, visibility and cost considerations.
Structured logging, centralized collection, consistent schemas and retention policies improve log quality and operational visibility.
Why manage logs on Observe
Observe by Snowflake is built for modern log management at cloud scale. Rather than treating logs as isolated records, Observe correlates them with metrics, traces and events to provide the context that engineers need to investigate production issues quickly. This unified view can help teams investigate potential root causes using connected operational context.
Observe can ingest logs from a wide range of sources, including applications, cloud services, containers and OpenTelemetry pipelines. Observe can build relationships between logs, infrastructure and application services, which allows engineers to investigate incidents using connected operational data.
Log management architectures take different approaches to indexing, storage and compute. Observe stores telemetry in Snowflake and uses its scalable storage and compute architecture. Depending on configuration and retention requirements, organizations can retain extended periods of log data while keeping historical telemetry available for investigation.
Observe also preserves high-cardinality telemetry. Engineers use it to filter, group and investigate logs using rich contextual attributes such as customer IDs, Kubernetes pods, deployment versions, cloud regions and trace IDs. Preserving this context can help teams investigate potential root causes of complex production issues across distributed systems.
AI can also assist with investigations. Observe’s AI SRE capabilities capabilities can use correlated telemetry to help summarize incidents, provide operational context and surface potential root causes through natural language interactions. By combining logs with metrics, traces and events, AI can use additional operational context to assist with incident response.
Because Observe runs on Snowflake, operational telemetry can be analyzed alongside other relevant data in Snowflake. This helps teams connect operational and business context. It can further enable engineering teams to understand the technical and business context of production issues.
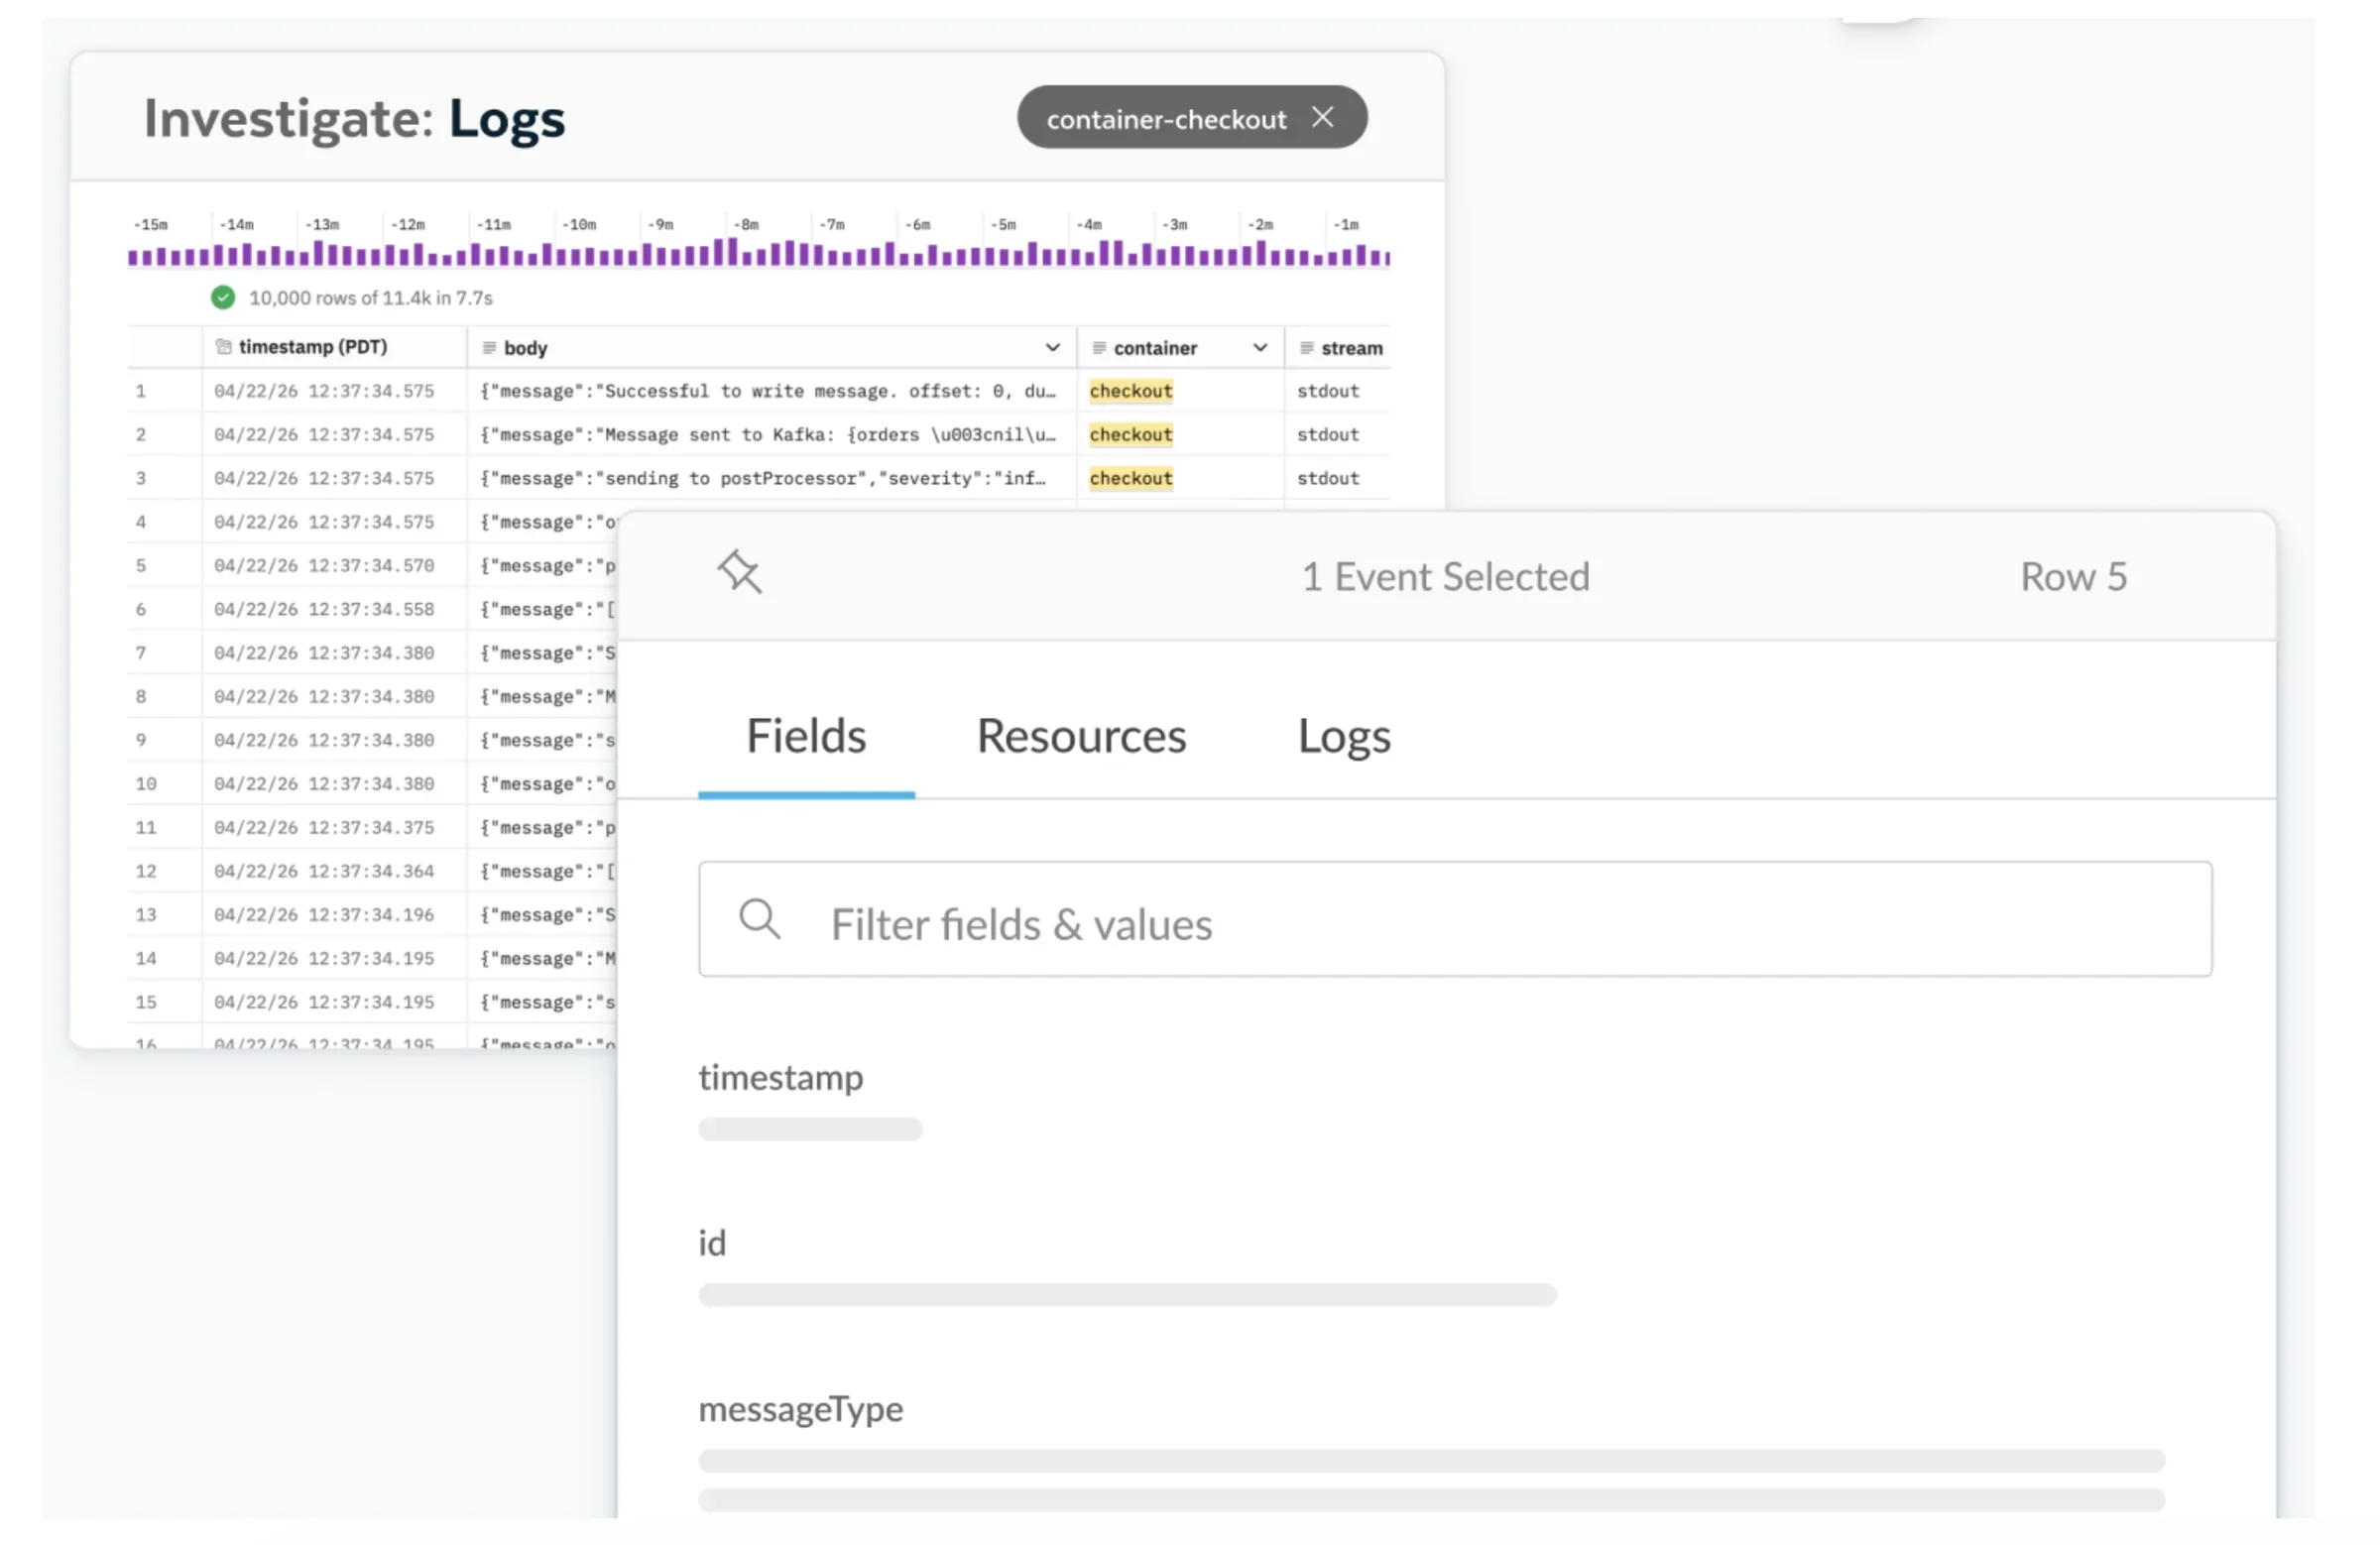
Figure 7: Log management UI on Observe
KEY TAKEAWAY
Log management centralizes, stores and analyzes operational log data so engineering teams can troubleshoot systems, investigate incidents and maintain long-term visibility at scale.
Frequently Asked Questions
Your common questions about log management, answered by Snowflake experts.
What is the difference between log management and observability?
Log management focuses on collecting, storing and analyzing log data throughout its lifecycle. Observability is a broader practice that combines logs and metrics, along with traces, to help teams understand how distributed systems behave and identify the root cause of issues.
What is the difference between log management and a SIEM?
Log management provides the foundation for collecting and retaining operational logs. A SIEM builds on that data by applying security analytics and threat detection. This helps security teams identify suspicious activity and respond to potential incidents.
What is the difference between log management and log analytics?
Log management covers the complete lifecycle of log data, from collection through retention. Log analytics focuses on extracting insight from that data by searching, correlating and visualizing events to support troubleshooting and operational decision-making.
How long should you retain logs?
There is no universal retention period. Organizations typically define retention based on operational requirements and compliance obligations. Frequently accessed logs often remain in hot storage and older data moves to lower-cost storage tiers for long-term preservation.
What are the stages of the log management process?
The log management lifecycle begins with generating and collecting logs before they are transported, parsed, centralized, stored, analyzed and eventually retired. Each stage helps ensure log data remains accessible, reliable and cost-effective throughout its useful life.
Explore Observability Resources
Explore Observability Topics
Deep dives into every aspect of observability
