

The Fundamentals of Observability: A Beginner’s Guide to Modern System Visibility
Learn how observability unifies metrics, logs, traces and AI-powered insights to help teams troubleshoot faster, improve reliability and operate complex systems at scale.
OBSERVABILITY DEFINED
Observability is the ability to understand a system’s internal state by analyzing telemetry such as metrics, logs and traces.
Modern software runs across cloud platforms, containers, microservices and managed services. As systems become more distributed, it becomes harder to understand how applications, infrastructure and services interact. A single customer request may pass through dozens of components before it completes, which makes production issues more difficult to detect and diagnose.
Observability gives engineering teams the visibility they need to understand system behavior, investigate incidents and maintain reliable applications. By collecting and correlating telemetry from across the technology stack, observability helps teams identify performance bottlenecks. This in turn helps understand dependencies and reduce the time required to resolve issues.
This guide explains what observability is, how it works, the core telemetry signals it relies on and how modern observability platforms support cloud-native operations, site reliability engineering (SRE) and application performance at scale.
What is observability?
Observability refers to the ability to understand the internal state of a system by analyzing its external outputs. Traditionally, observability is built on three core telemetry signals: metrics, logs and traces. Together, these signals provide the context needed to understand how applications, infrastructure and services behave in real time. Modern observability platforms also collect additional telemetry such as events, profiles and user experience data to provide a more complete picture of system behavior.
Unlike traditional monitoring, which relies on predefined dashboards and alerts to detect known issues, observability enables engineers to investigate unexpected behavior and answer questions they did not anticipate in advance. This ability to explore unknown failure modes, often called "unknown unknowns," is essential in today's distributed, cloud-native environments where applications are constantly changing.
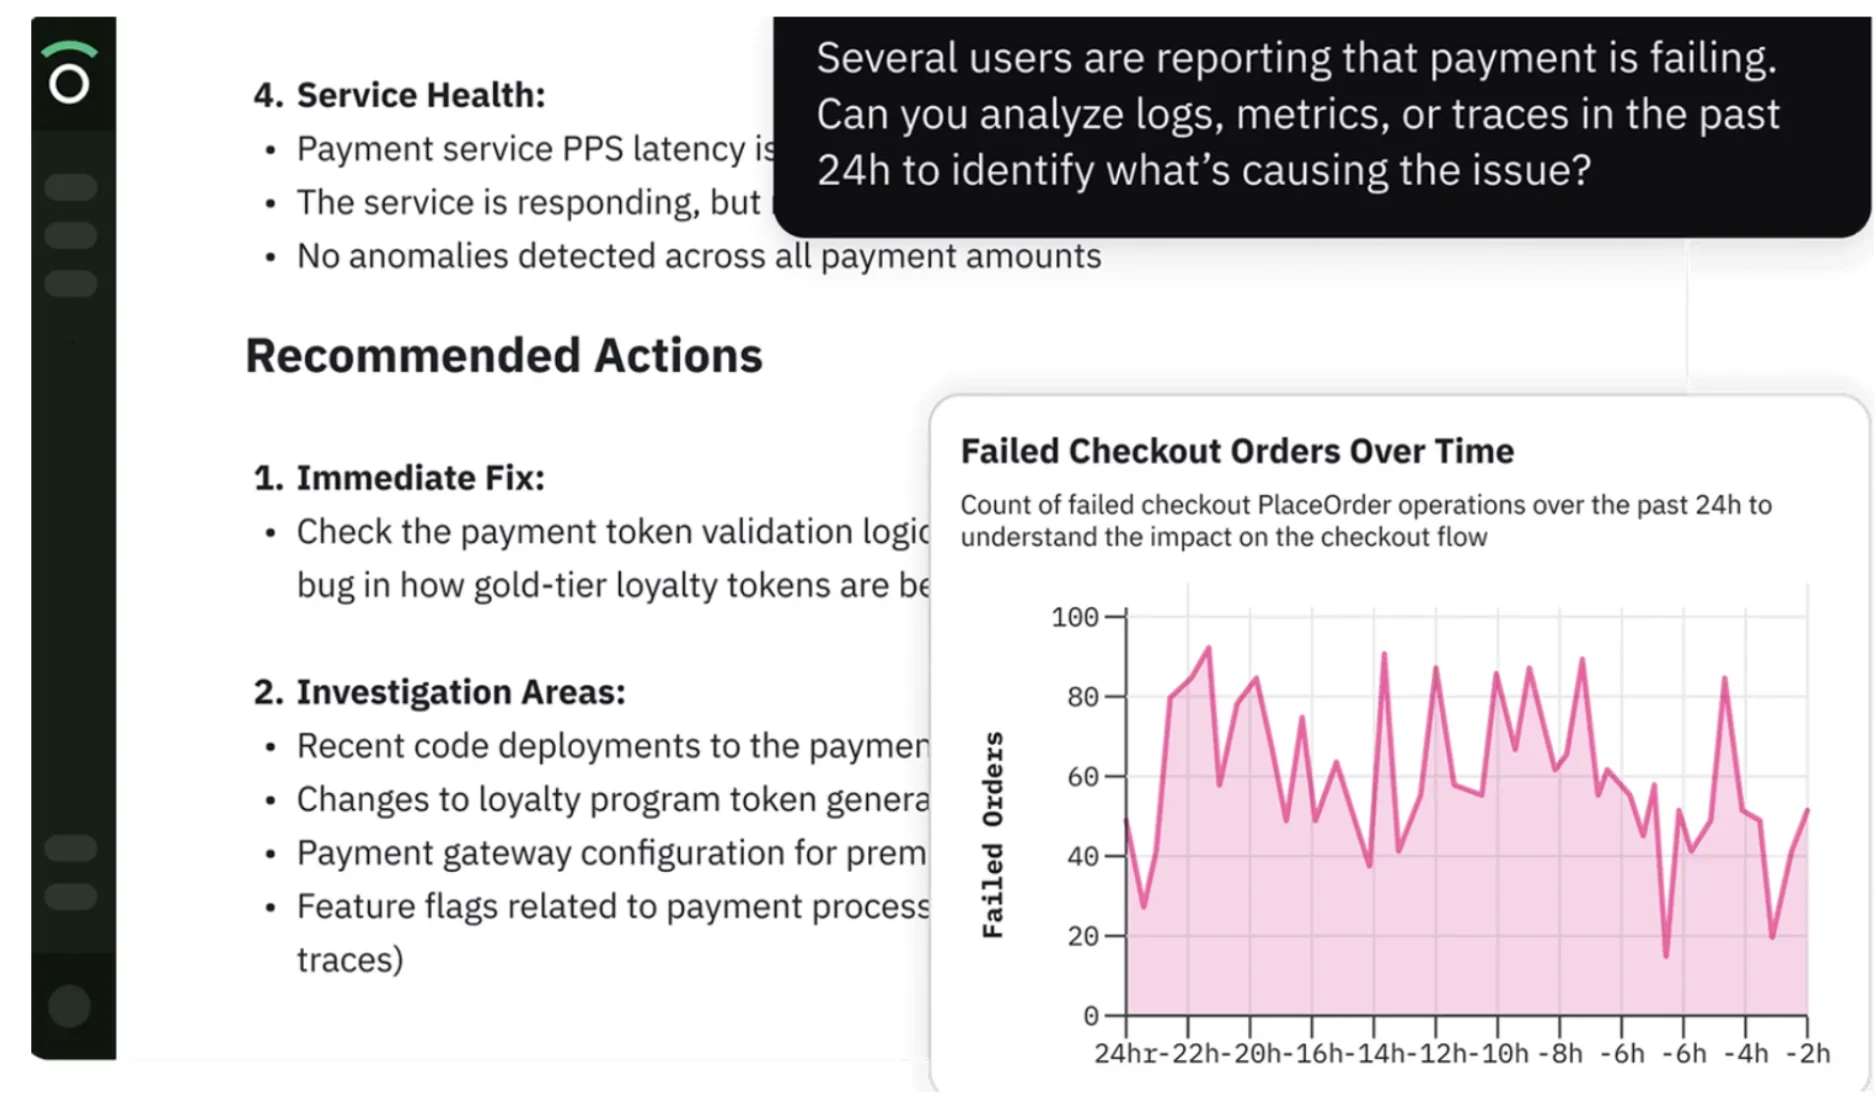
Figure 1: The Observe by Snowflake UI
Observability platforms collect and correlate telemetry from across the technology stack, which allows teams to connect events, traces, metrics and logs into a complete operational picture. Distributed systems generate vast amounts of telemetry enriched with contextual attributes such as customer IDs, deployment versions, Kubernetes pods, feature flags, cloud regions, AI model versions, trace IDs and more. Many of these attributes are high cardinality, meaning they contain a large number of unique or near-unique values. For example, every customer ID, trace ID or Kubernetes pod name may be different. These high-cardinality attributes preserve detailed information about individual requests, users and services.
Traditional monitoring systems often aggregate or discard this context because storing and querying millions of unique values is expensive. Platforms such as Observe preserve high-cardinality telemetry, which allows engineers to investigate unexpected behavior by filtering, grouping and correlating telemetry based on these attributes. Rather than aggregating away valuable context, high-cardinality telemetry can help engineers identify potential root causes of complex issues more efficiently.
As systems grow more distributed, observability has become the foundation for reliable software operations. It enables engineering teams to troubleshoot incidents more efficiently and understand dependencies across services. This in turn helps improve application performance without relying solely on static dashboards or predefined queries. Using the insights from telemetry, observability provides the context needed to investigate incidents, improve performance, and maintain reliable systems at scale.
The observability lifecycle
Observability works by collecting, storing and analyzing telemetry data generated by applications. The telemetry pipeline provides the foundation for understanding system behavior and investigating performance issues across modern technology environments.
The process begins with instrumentation, where applications and infrastructure components generate data about their behavior. This telemetry can include metrics that measure system performance, logs that capture events and activity and traces that show how requests move through distributed systems.
Once collected, this data moves to storage. As telemetry moves from collection to storage, many organizations process it through a telemetry pipeline. A telemetry pipeline sits between data producers and storage systems, where it can enrich, transform, route and optimize telemetry before it reaches downstream observability platforms.
Telemetry pipelines have become increasingly important as telemetry volumes continue to grow. Rather than storing every log, metric or trace, organizations use pipelines to apply filtering, sampling and enrichment policies that reduce storage and ingestion costs. Pipelines also simplify observability architectures by routing telemetry to multiple monitoring, analytics or security platforms from a single collection point.
The next stage is storing telemetry data in a way that preserves the context needed for investigation. Modern observability requires more than simply collecting large volumes of data. Teams need access to detailed information, including high-cardinality data, so they can understand exactly what happened and why.
After telemetry is stored, engineers can query and analyze the data to identify patterns, investigate incidents and understand system behavior. Observability platforms help teams move beyond predefined dashboards by allowing them to explore new questions when unexpected problems occur.
Alerts help teams identify important changes or conditions that require attention. When combined with rich telemetry and contextual analysis, alerting becomes more effective because engineers can quickly understand the impact and root cause of an issue. By treating metrics, logs, traces and events as connected sources of operational information, organizations can gain deeper insight into complex systems and improve reliability.

Every production issue leaves a trail of telemetry. The challenge is connecting those signals into the context engineers need to understand what happened and resolve problems quickly.
Jeremy Burton
General Manager, Observability Business Unit at Snowflake
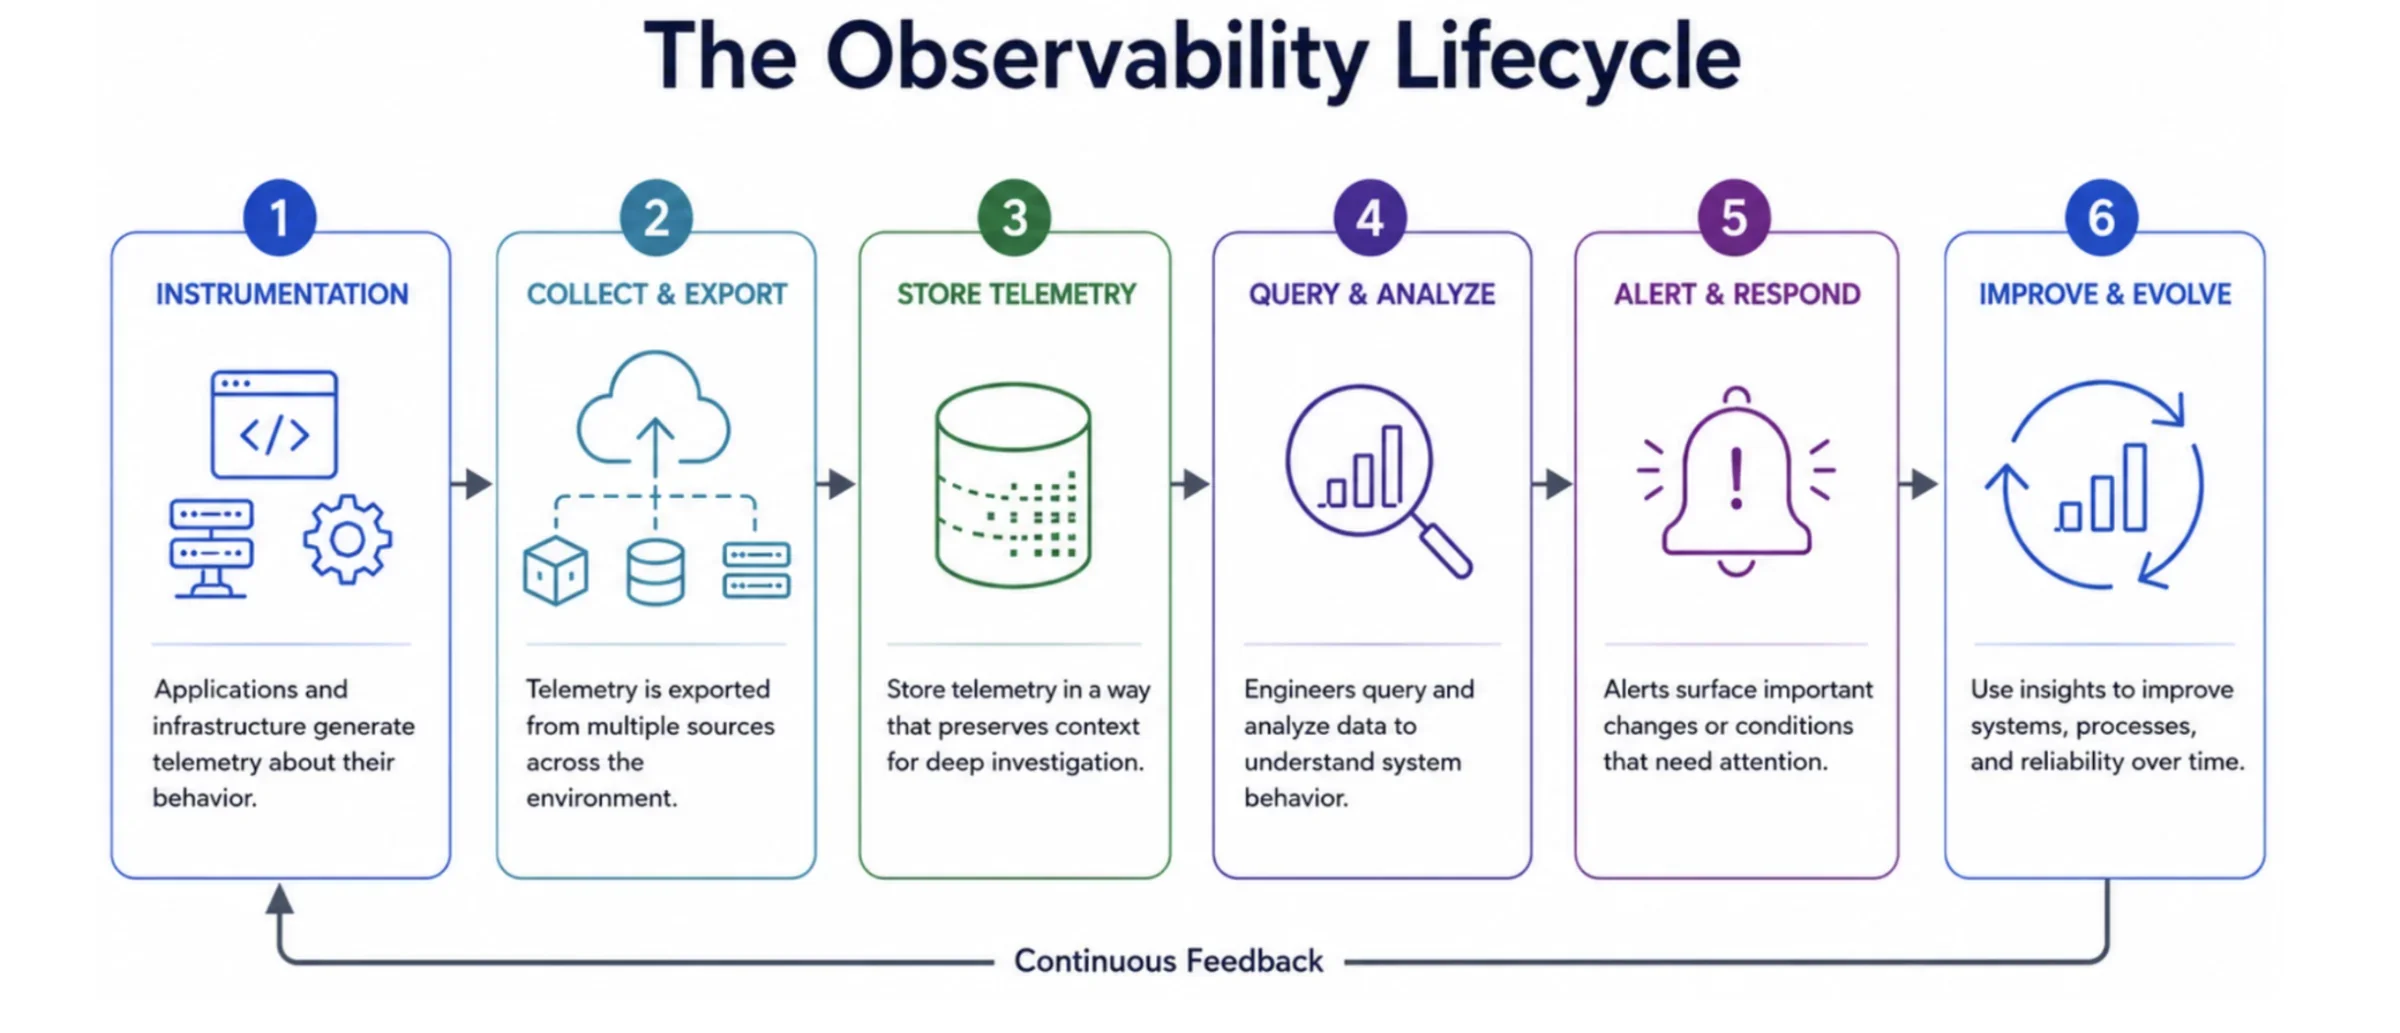
Figure 2: The observability lifecycle
The pillars: metrics, logs and traces
Modern observability is built around three primary telemetry signals: metrics, logs and traces. Each signal provides a different perspective into system behavior and together they provide the context needed to understand complex applications and infrastructure.
Metrics
Metrics are numerical measurements collected over time that describe the health and performance of a system, describing information from CPU usage and request latency to database performance or application throughput.
Metrics are often the first signal teams use when identifying whether a system is operating normally. They are valuable for tracking trends, monitoring service health and detecting changes that require investigation. However, metrics alone may not always explain why a problem occurred.
Logs
Logs provide detailed records of events like errors, transactions, user activity, configuration changes that occur within applications and systems. Unlike metrics, which summarize behavior over time, logs capture individual events as they happen. They often include timestamps, severity levels, error messages, configuration changes, user activity, application output, etc.
Logs provide the detailed context engineers need during troubleshooting. Engineers use logs to understand what happened within a system and identify specific events connected to a problem. For example, while a metric may indicate that application latency has increased, logs can reveal the underlying database timeout, configuration error or authentication failure responsible for the slowdown. Because logs preserve detailed operational information, they are invaluable for debugging production issues and investigating incidents.
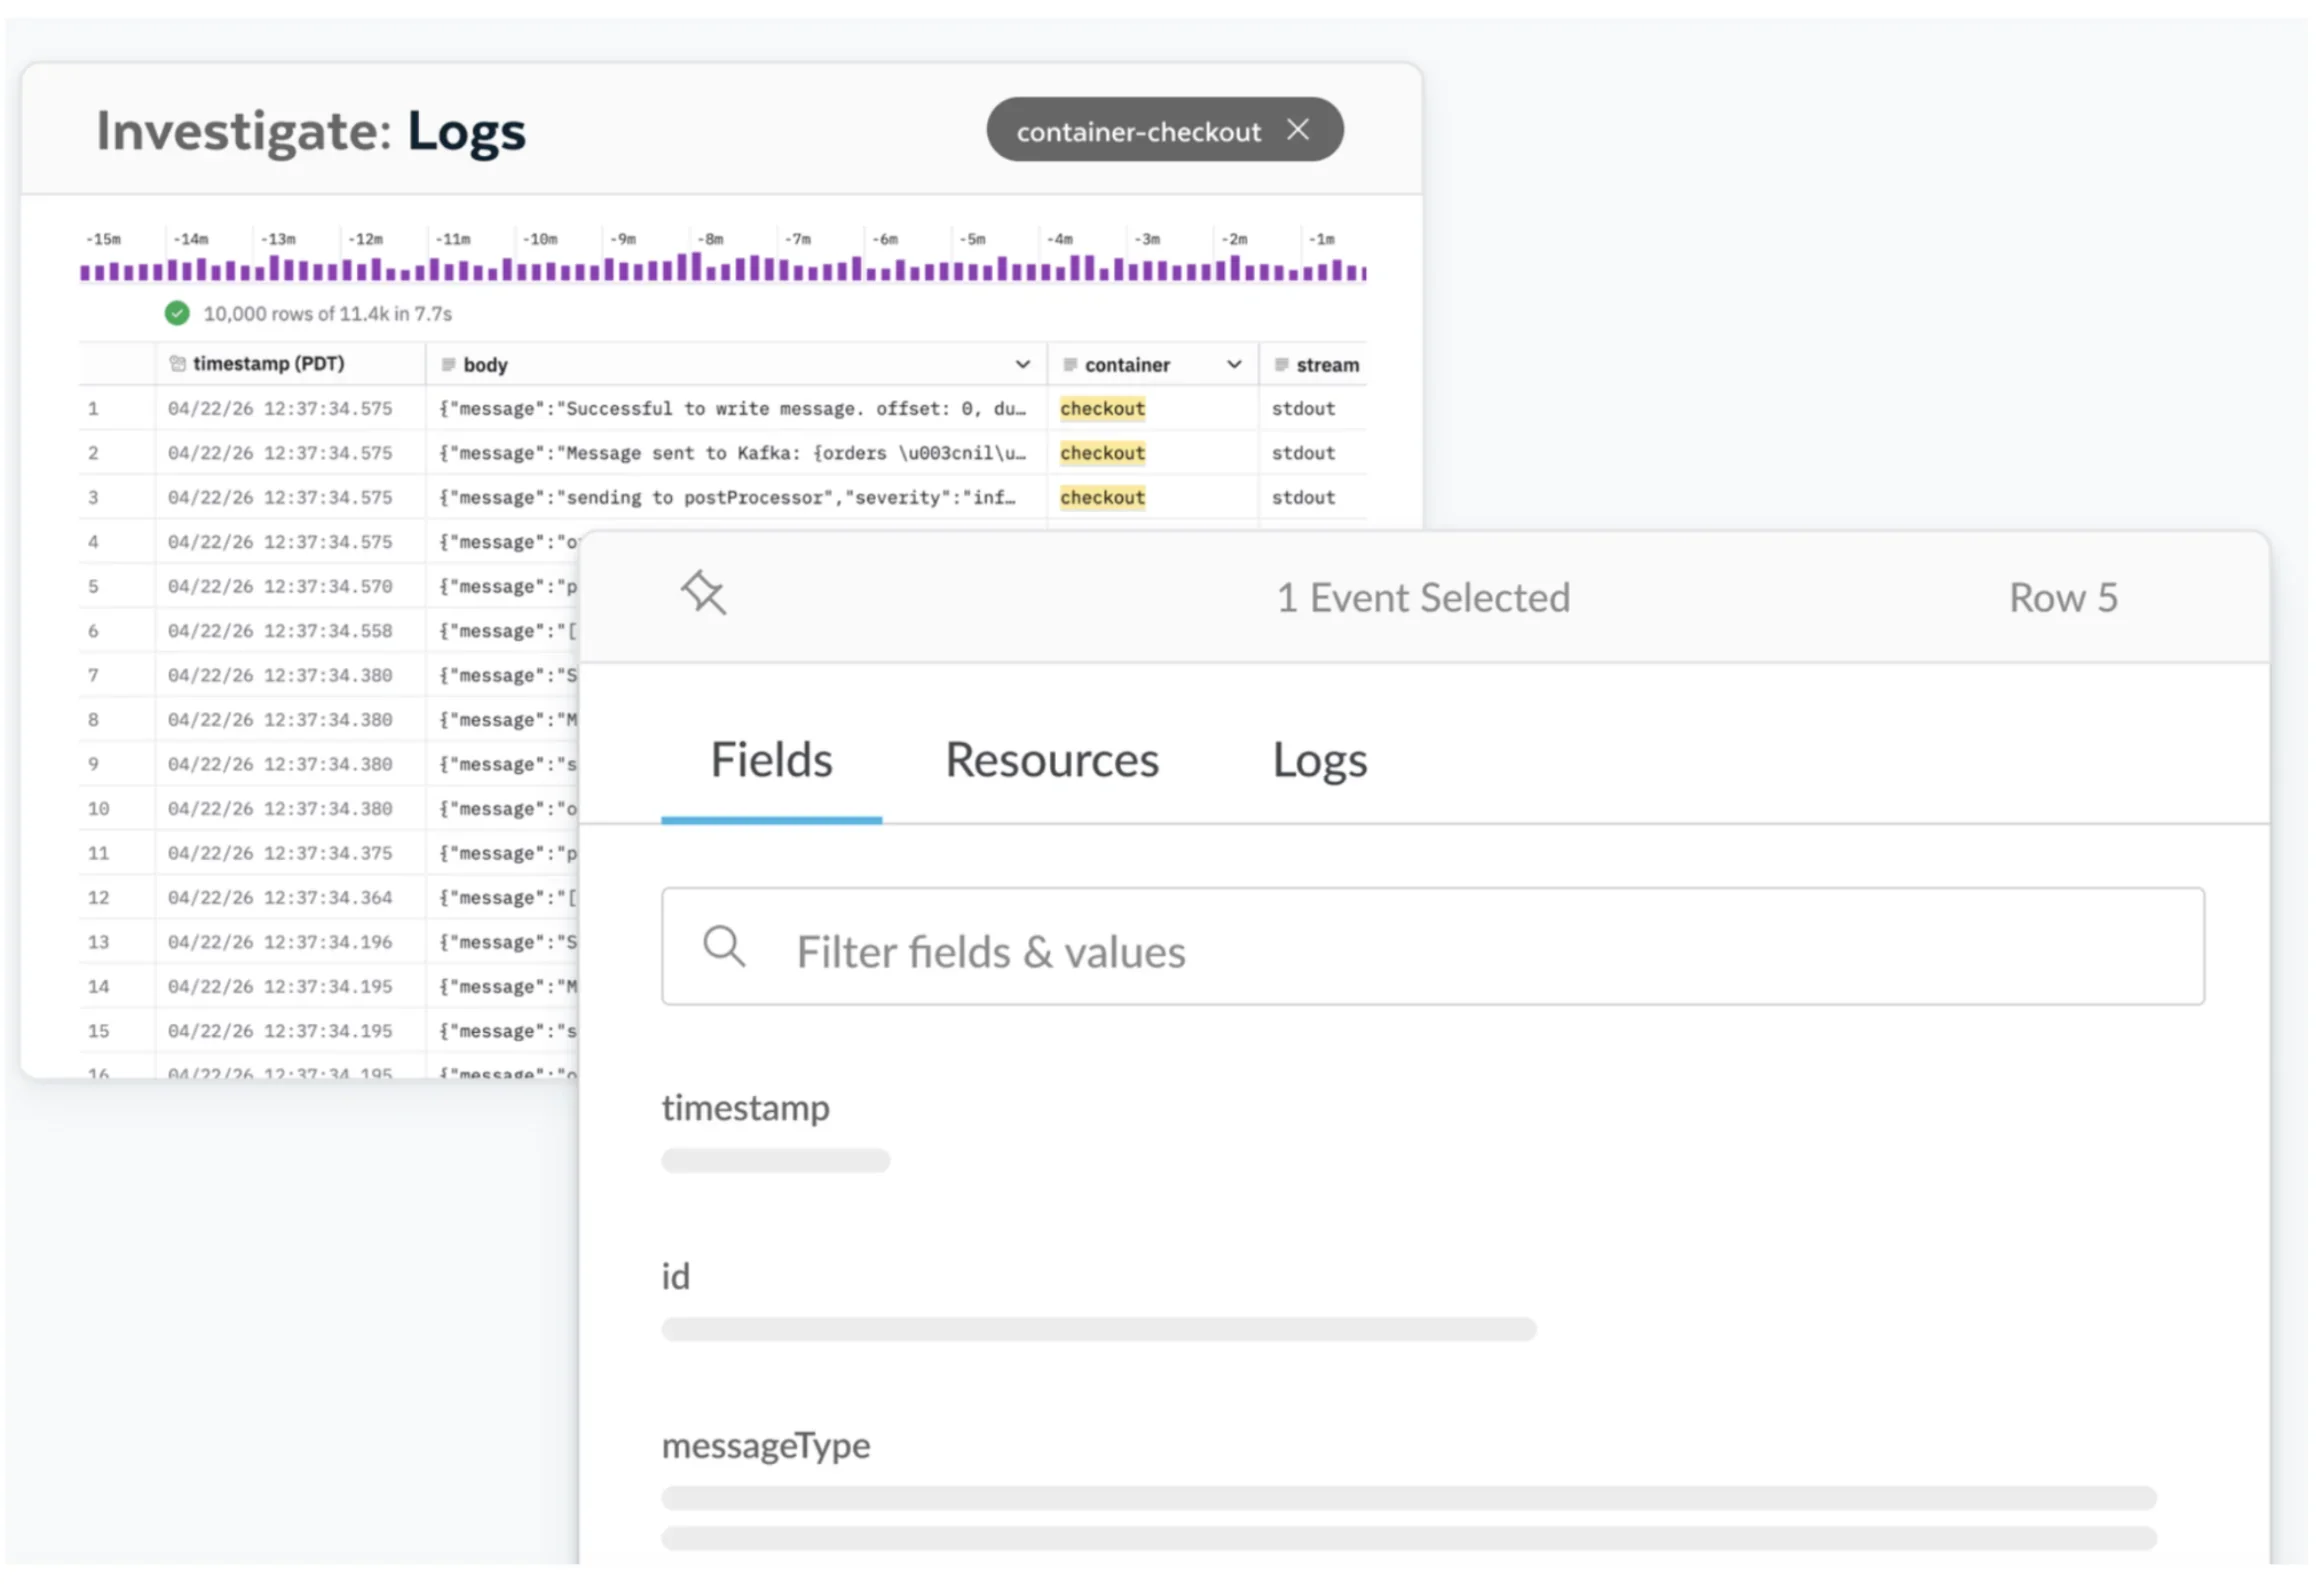
Figure 3: Logs - one of the three pillars of observability
Traces
Traces show the path of requests as they move through distributed applications. In modern architectures with microservices and APIs, a single user request may travel through many different services before completing.
Distributed tracing connects each step of that request into a single end-to-end view. This allows engineers to identify performance bottlenecks, understand service dependencies and pinpoint exactly where failures or latency occur. Traces are particularly valuable for diagnosing issues that span multiple services, where traditional monitoring techniques often struggle to provide sufficient visibility.
Although observability is traditionally built on three core telemetry signals, i.e. metrics, logs and traces, many modern observability platforms also ingest and correlate events. They provide valuable operational context that helps engineers interpret the telemetry collected from the three primary signals. They also capture significant changes or occurrences within a system that may influence application behavior. Unlike metrics, which measure performance continuously, events record specific moments in time, such as software deployments, configuration updates, infrastructure changes, security alerts, autoscaling actions, user-triggered operations and more.
The true value of observability comes from correlating these signals together. A metric may show that latency increased, a log may reveal an application error, and a trace may identify the specific service responsible. By correlating events with metrics, logs, and traces, engineers can quickly understand whether a change in system behavior coincided with a deployment, an infrastructure modification, or another operational event. This additional context makes it easier to identify root causes and reduce the time required to investigate incidents.
PILLARS OF OBSERVABILITY
Metrics, logs and traces are the core pillars of observability. Several observability platforms also ingest and correlate events. Together, they provide complementary insights into system performance and workflows.
Application Performance Monitoring (APM)
Application performance monitoring (APM) focuses on the health and performance of applications. It helps teams understand how code behaves in production by tracking metrics such as response times, request throughput, latency, errors, service dependencies, etc. APM makes it easier to identify slow transactions, pinpoint failures and measure the user impact of application issues.
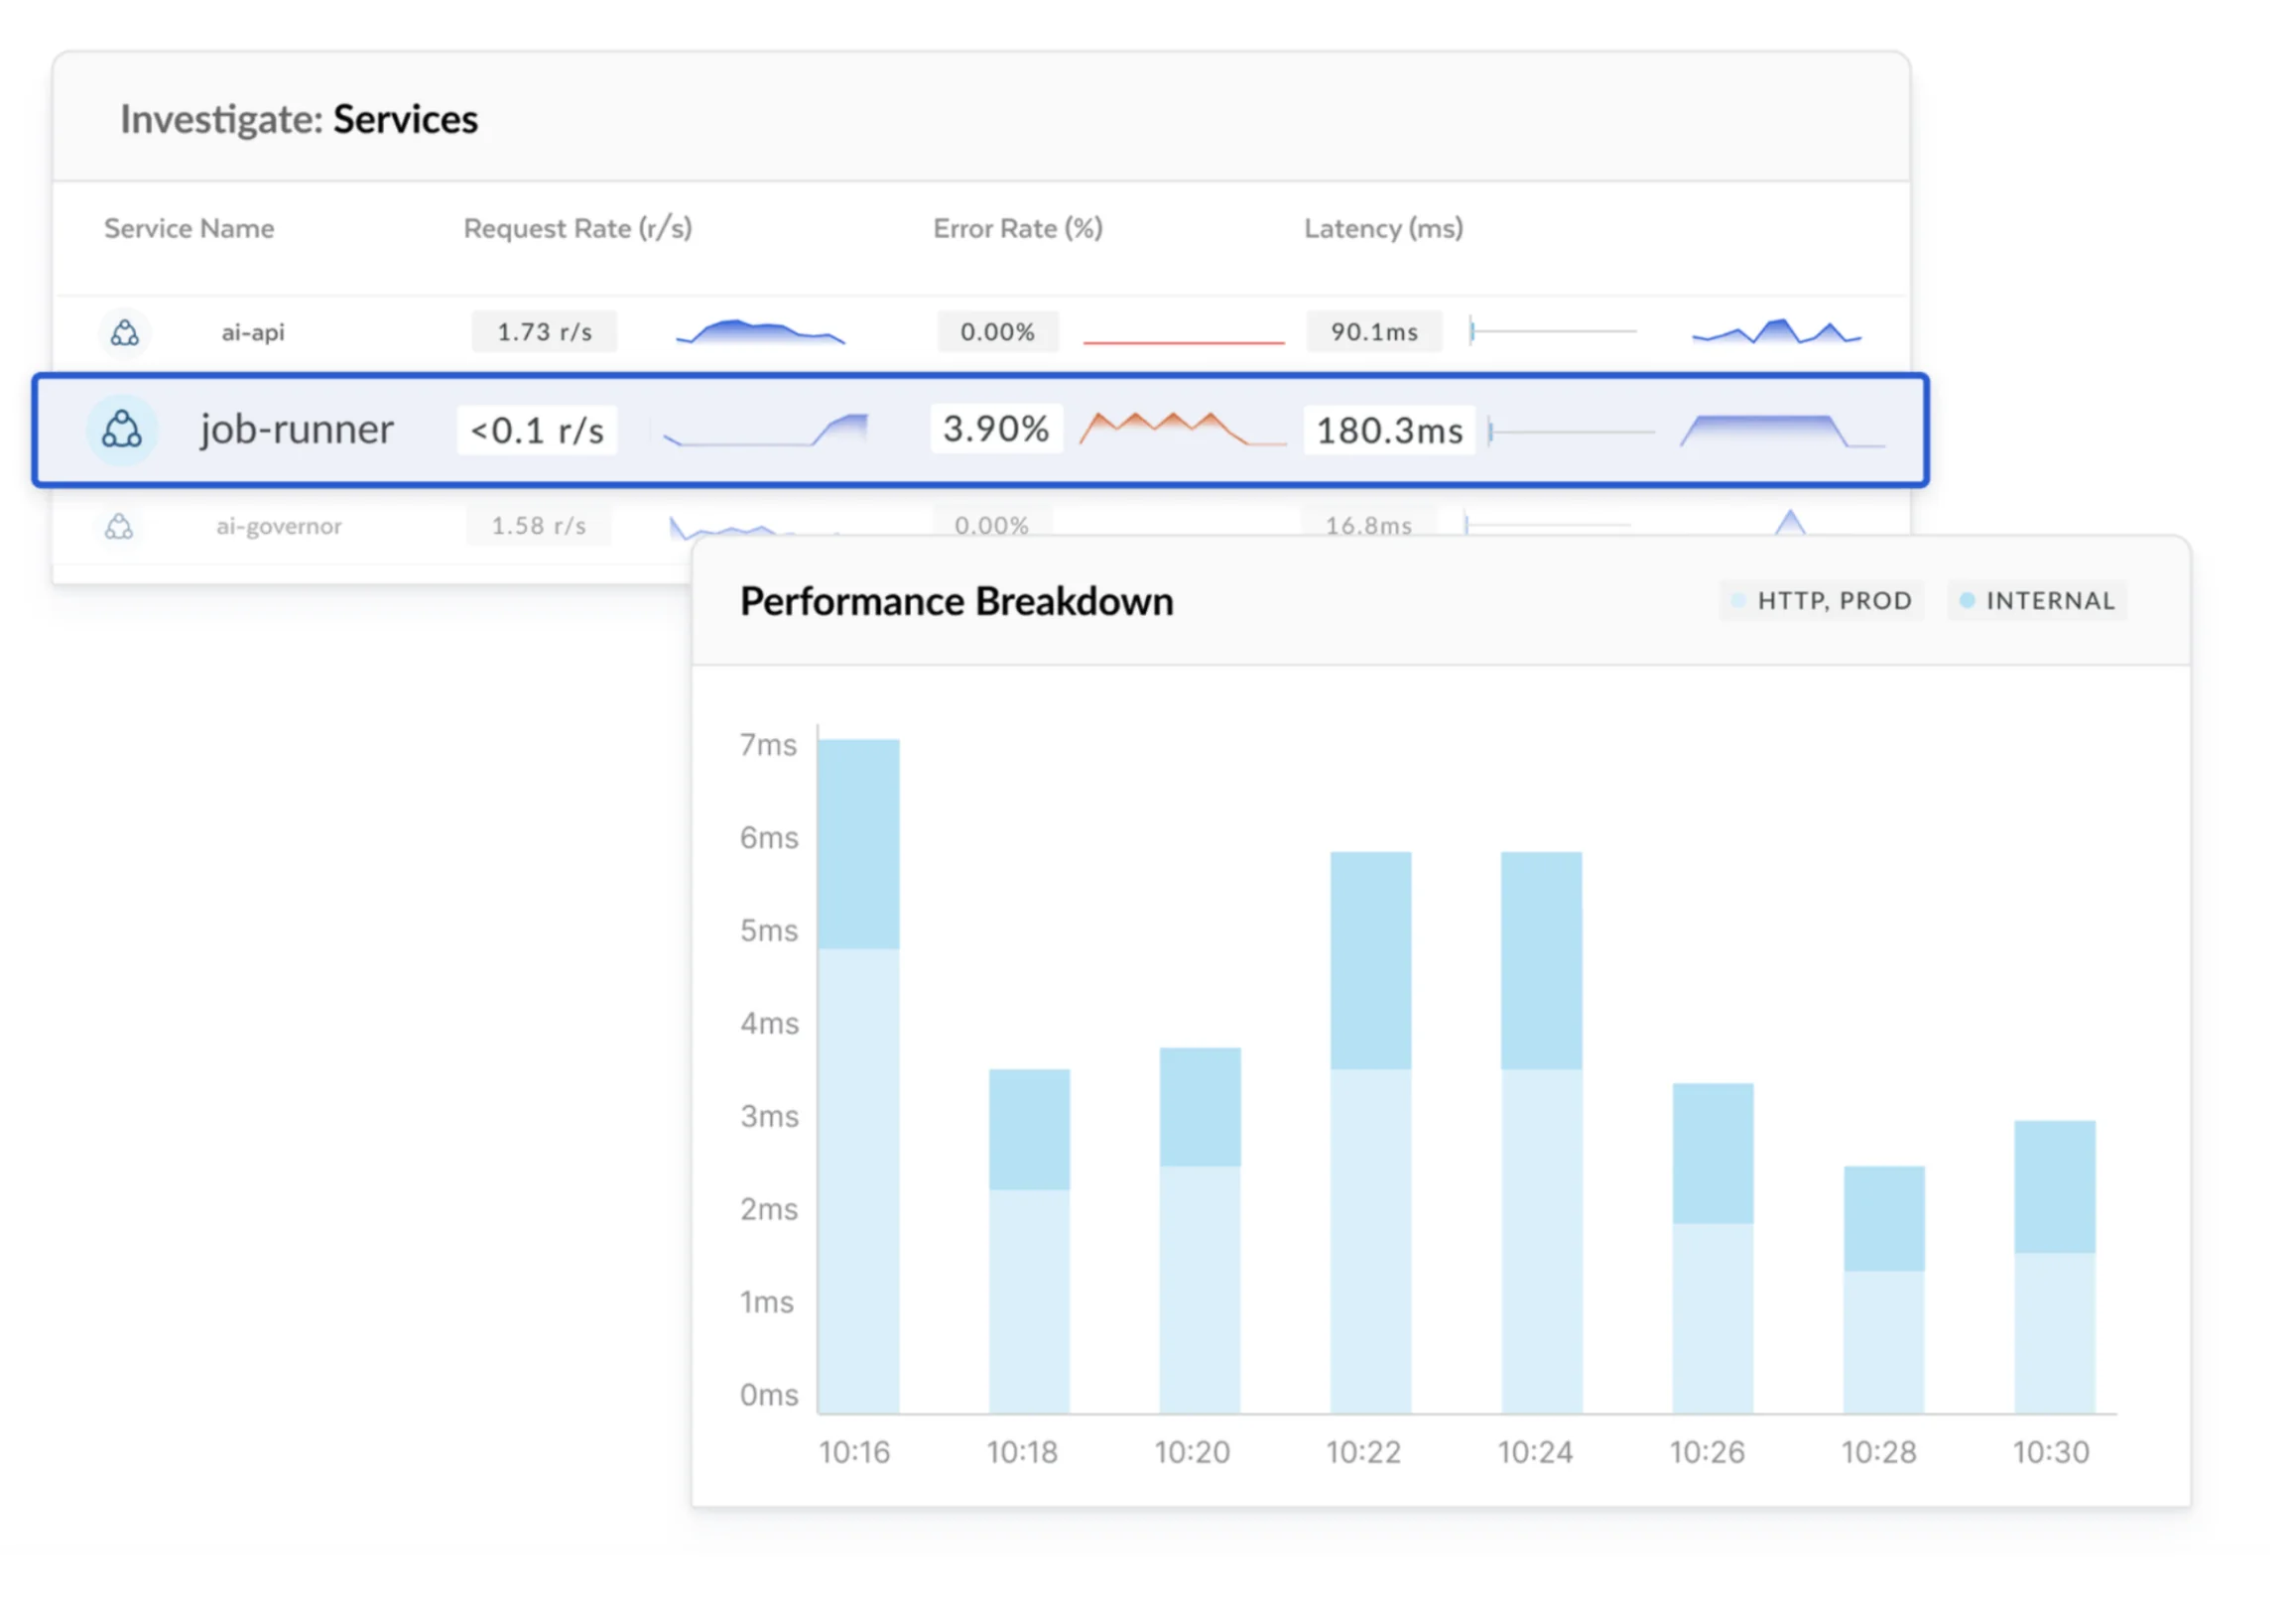
Figure 4: Application performance monitoring
APM can be considered a part of a broader observability strategy. Traditional APM tools concentrate on application behavior and predefined performance metrics. Observability extends beyond the application itself by combining logs, metrics, traces and business context to investigate unexpected issues across distributed systems. When an application slowdown originates from a Kubernetes cluster or a cloud service, observability helps teams follow the entire chain of events instead of stopping at the application boundary. Modern engineering teams typically use APM as part of a broader observability practice rather than treating them as separate disciplines.
Application Performance Monitoring (APM) measures application health, performance and user impact. It is considered a key component of a broader observability strategy.
Infrastructure and cloud-native observability
Applications depend on infrastructure that changes constantly. Virtual machines, containers, Kubernetes clusters, serverless platforms, managed databases and cloud services all generate telemetry that helps explain application behavior. Infrastructure and cloud-native observability brings these signals together so teams can understand system health across every layer of the stack.
Infrastructure monitoring traditionally focused on hosts, CPU utilization, memory, storage and network performance. Cloud-native environments require broader visibility because workloads are distributed and highly dynamic. Containers may exist for only a defined period of time. Kubernetes continuously schedules and replaces workloads. Serverless functions scale automatically and often leave little operational footprint after execution. Technologies such as eBPF capture network activity, system calls and application behavior with minimal overhead. It helps teams investigate issues that span multiple cloud services and reduce operational complexity.
Modern observability platforms can collect metrics, logs, traces and low-level kernel telemetry to provide a broader view of cloud infrastructure.
OpenTelemetry and open standards
OpenTelemetry has seen widespread adoption for collecting and transporting telemetry. As a Cloud Native Computing Foundation (CNCF) project, it provides vendor-neutral APIs, SDKs, automatic instrumentation and collectors that generate consistent logs, metrics, and traces across applications, infrastructure and cloud environments. Using the OpenTelemetry Protocol (OTLP), organizations can standardize telemetry collection and avoid vendor-specific instrumentation.
Observe is built to embrace these open standards. It integrates with OpenTelemetry to ingest telemetry from a wide range of applications and infrastructure. This allows engineering teams to adopt a single, standardized instrumentation strategy regardless of the underlying technology stack. The OpenTelemetry Collector can receive, process, transform and route telemetry to Observe, thereby simplifying data collection while providing flexibility to support multiple environments and data sources.
By leveraging OpenTelemetry, organizations can standardize instrumentation and send telemetry to Observe while reducing reliance on proprietary agents or application-specific instrumentation. Observe can correlate logs, metrics, traces and other operational data, which enables engineers to investigate incidents from a unified view. This standards-based approach reduces operational complexity, simplifies observability deployments and gives organizations the flexibility to evolve their observability strategy over time.
OpenTelemetry is a widely used open standard for collecting and transporting telemetry. It enables consistent observability across applications and cloud environments.
AI SRE and intelligent observability
The application of artificial intelligence to observability has evolved significantly over the past decade. Terms such as AIOps, intelligent observability and more recently AI SRE are often used to describe this evolution. While the terminology varies, the objective remains the same, i.e. to help engineering teams extract actionable insights from growing volumes of telemetry and reduce the time required to detect, investigate and resolve incidents.
Early AIOps platforms focused on applying machine learning to operational data to detect anomalies and identify probable root causes. Intelligent observability expanded on these capabilities by bringing together logs, metrics and traces into a unified model of the environment, which provided richer context for investigations. The latest generation, AI SRE, goes beyond identifying problems to actively assisting with incident response. AI SRE systems can investigate alerts and support engineers through natural language interactions. This not only helps recommend remediation steps easily but also reduces the manual effort required during incident response.
Observe extends this evolution by providing an AI-native observability platform built on a unified data model. AI SRE capabilities can use correlated telemetry to assist engineers with investigations through natural language interactions. Observe also enables organizations to build custom AI SRE workflows by exposing observability data through APIs, the CLI and Model Context Protocol (MCP). This enables organizations to move beyond passive monitoring toward intelligent, AI-assisted operations that scale with increasingly complex production environments.
AI SRE applies artificial intelligence to observability data to accelerate incident investigation, identify root causes and assist engineers with remediation.
Incident resolution and alerting
Observability delivers value when it enables engineering teams to detect, investigate and resolve production issues quickly. This process typically follows an incident response lifecycle that begins with detection, continues through investigation and remediation and concludes with post-incident review. Alerting serves as the entry point to this workflow and ensures engineers are notified when service health degrades or user experience is affected.
Effective alerting prioritizes actionable signals over infrastructure noise. Alerts are commonly based on service health indicators, Service Level Objectives (SLOs) or abnormal application behavior rather than every operational event. Reducing unnecessary alerts helps minimize alert fatigue and allows on-call engineers to focus on incidents that require immediate attention.
Once an alert is triggered, incident response begins. Engineers use logs, metrics, traces, dashboards and historical telemetry to understand the scope of the problem and identify its root cause. Runbooks provide documented response procedures that help teams resolve recurring issues consistently and reduce the time spent determining the next course of action. The effectiveness of this process is often measured by Mean Time to Repair (MTTR), which tracks the time required to restore normal service after an incident occurs. Lower MTTR is a key objective because it reduces the duration and impact of service disruptions.
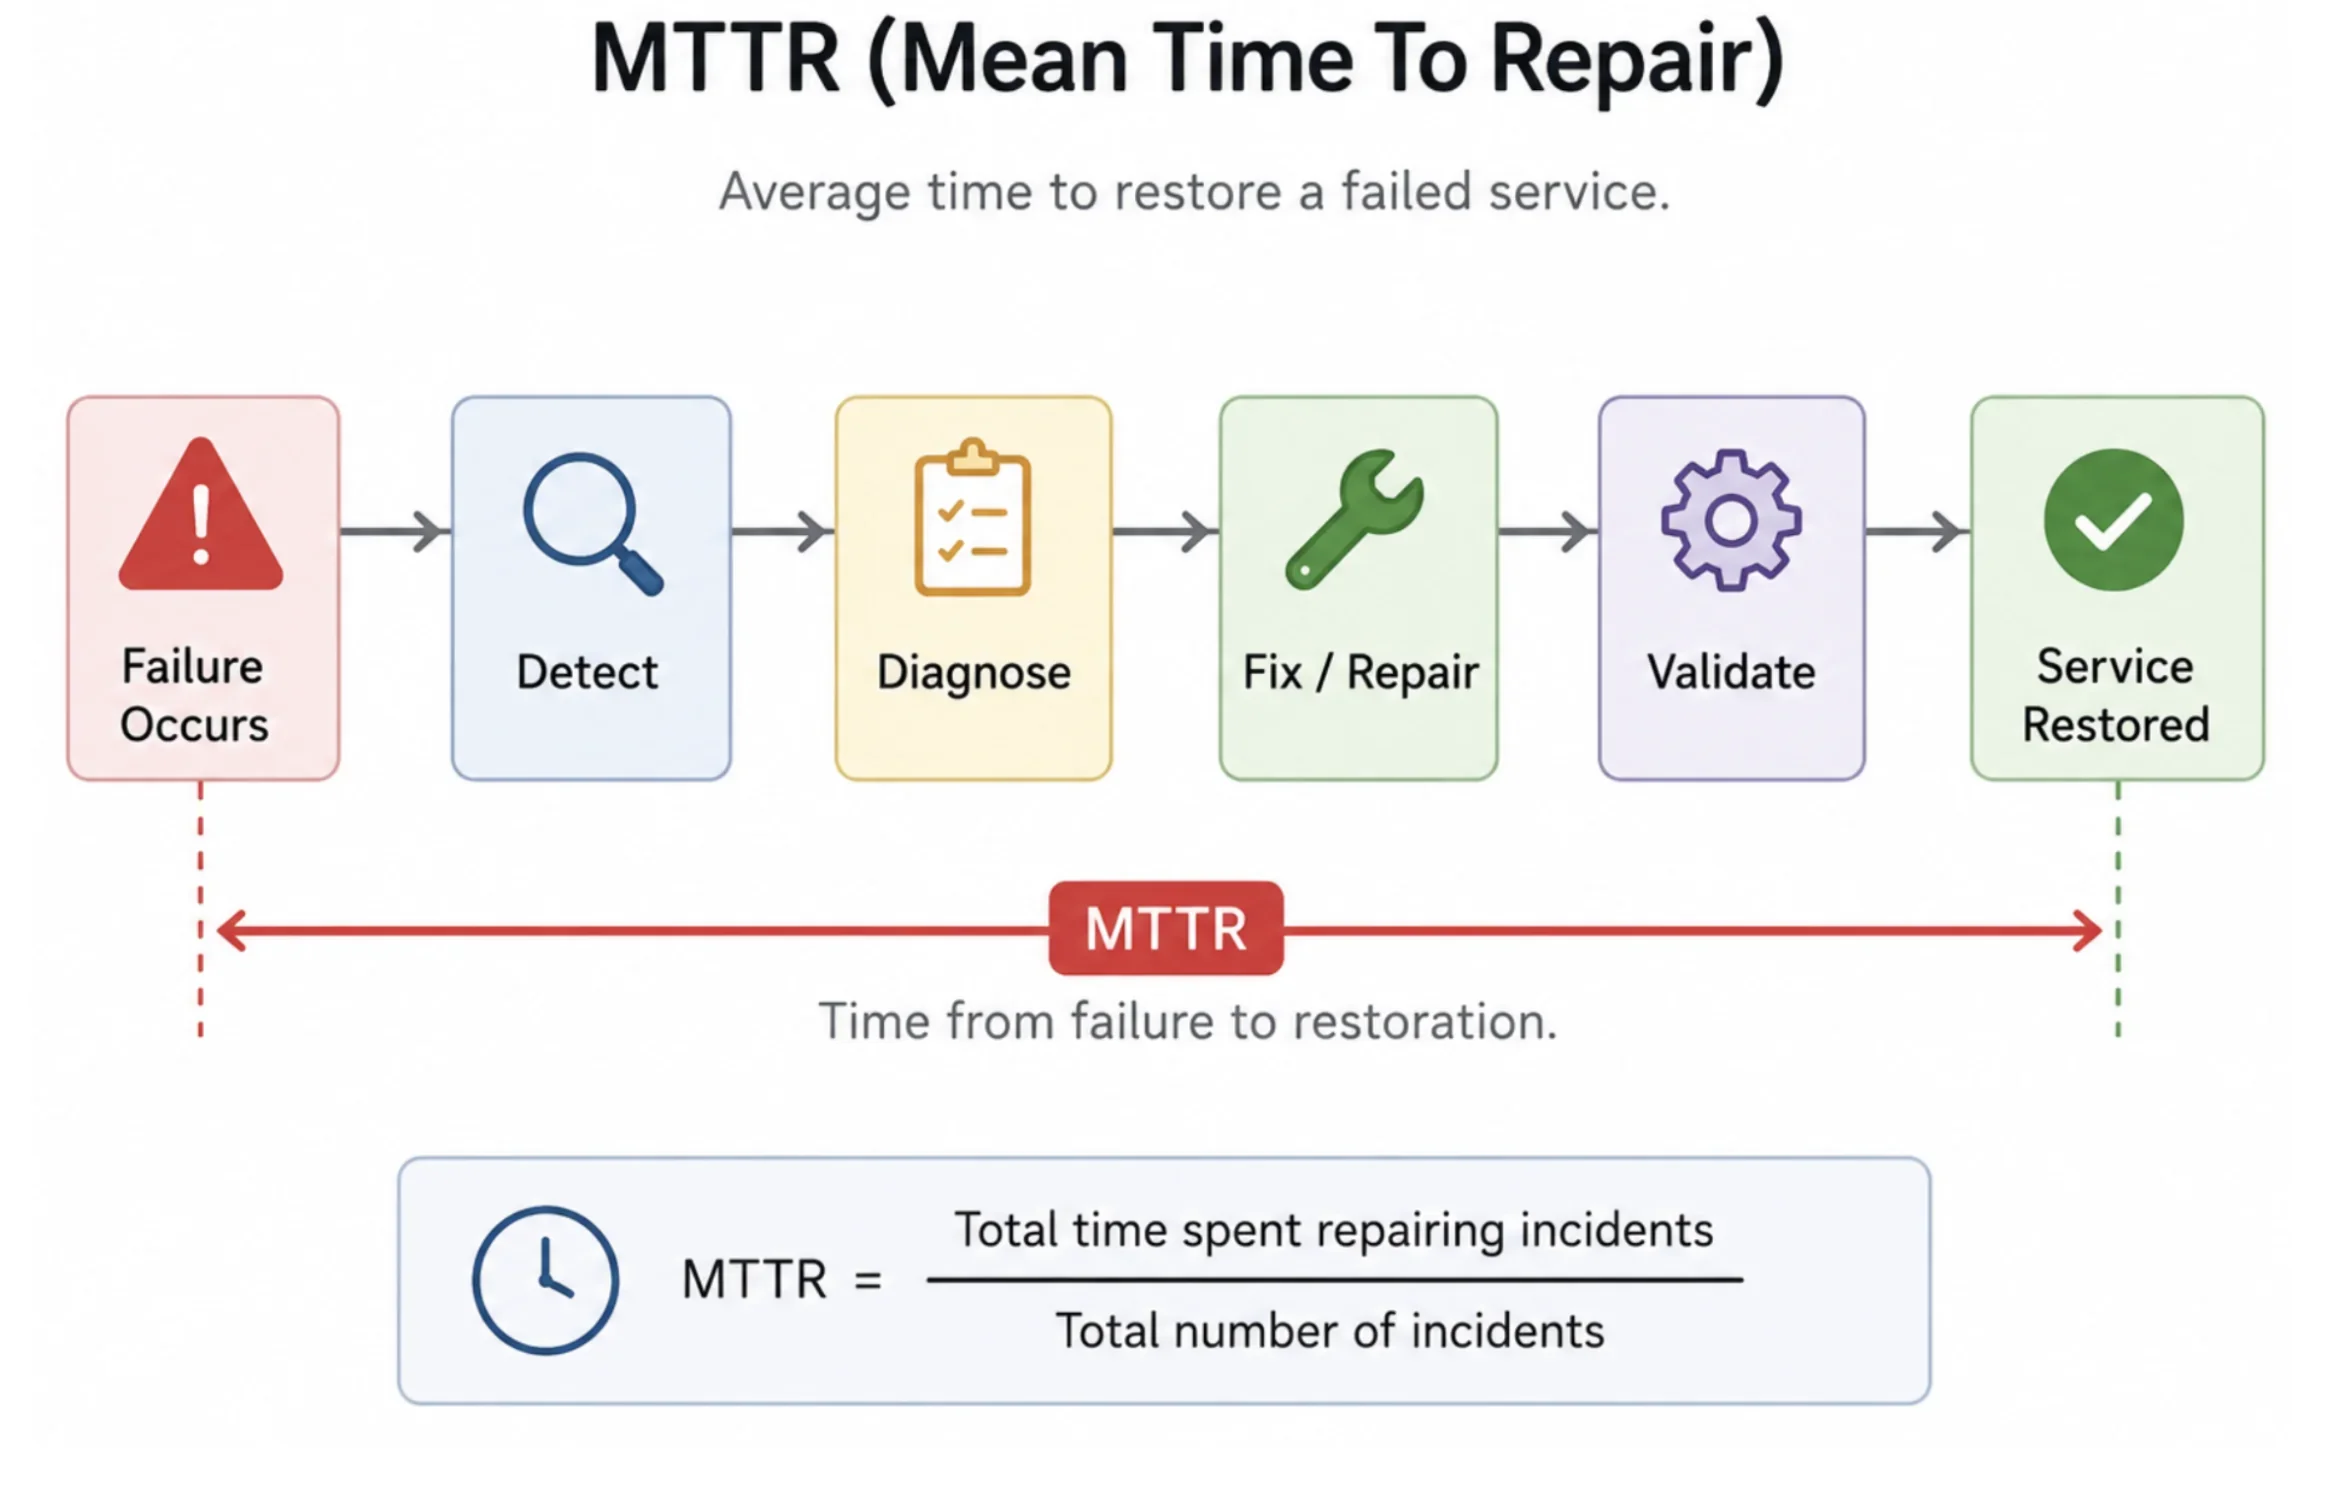
Figure 5: Illustration of Mean Time To Repair (MTTR)
Modern observability platforms improve incident response by correlating telemetry across distributed systems. Rich operational context helps teams identify likely causes, validate remediation steps and restore service with greater confidence. Following resolution, post-incident reviews examine contributing factors and identify opportunities to improve monitoring, alerting, automation or system design.
Site reliability engineering (SRE)
Site Reliability Engineering (SRE) is a discipline for designing and operating reliable software systems by applying software engineering principles to IT operations. Originally developed at Google, SRE emphasizes automation and measurement to ensure services remain reliable as they scale. Instead of relying on manual operational processes, SRE encourages teams to automate repetitive work and make operational decisions based on measurable outcomes.
A core principle of SRE is defining reliability as a measurable engineering objective. This is achieved through Service Level Indicators (SLIs), Service Level Objectives (SLOs) and error budgets. SLIs measure aspects of service performance, such as availability, latency, or error rates. SLOs establish target levels for these indicators that reflect user expectations. Error budgets quantify the amount of unreliability a service can tolerate over a given period. Together, these concepts help engineering teams balance feature development with operational stability.
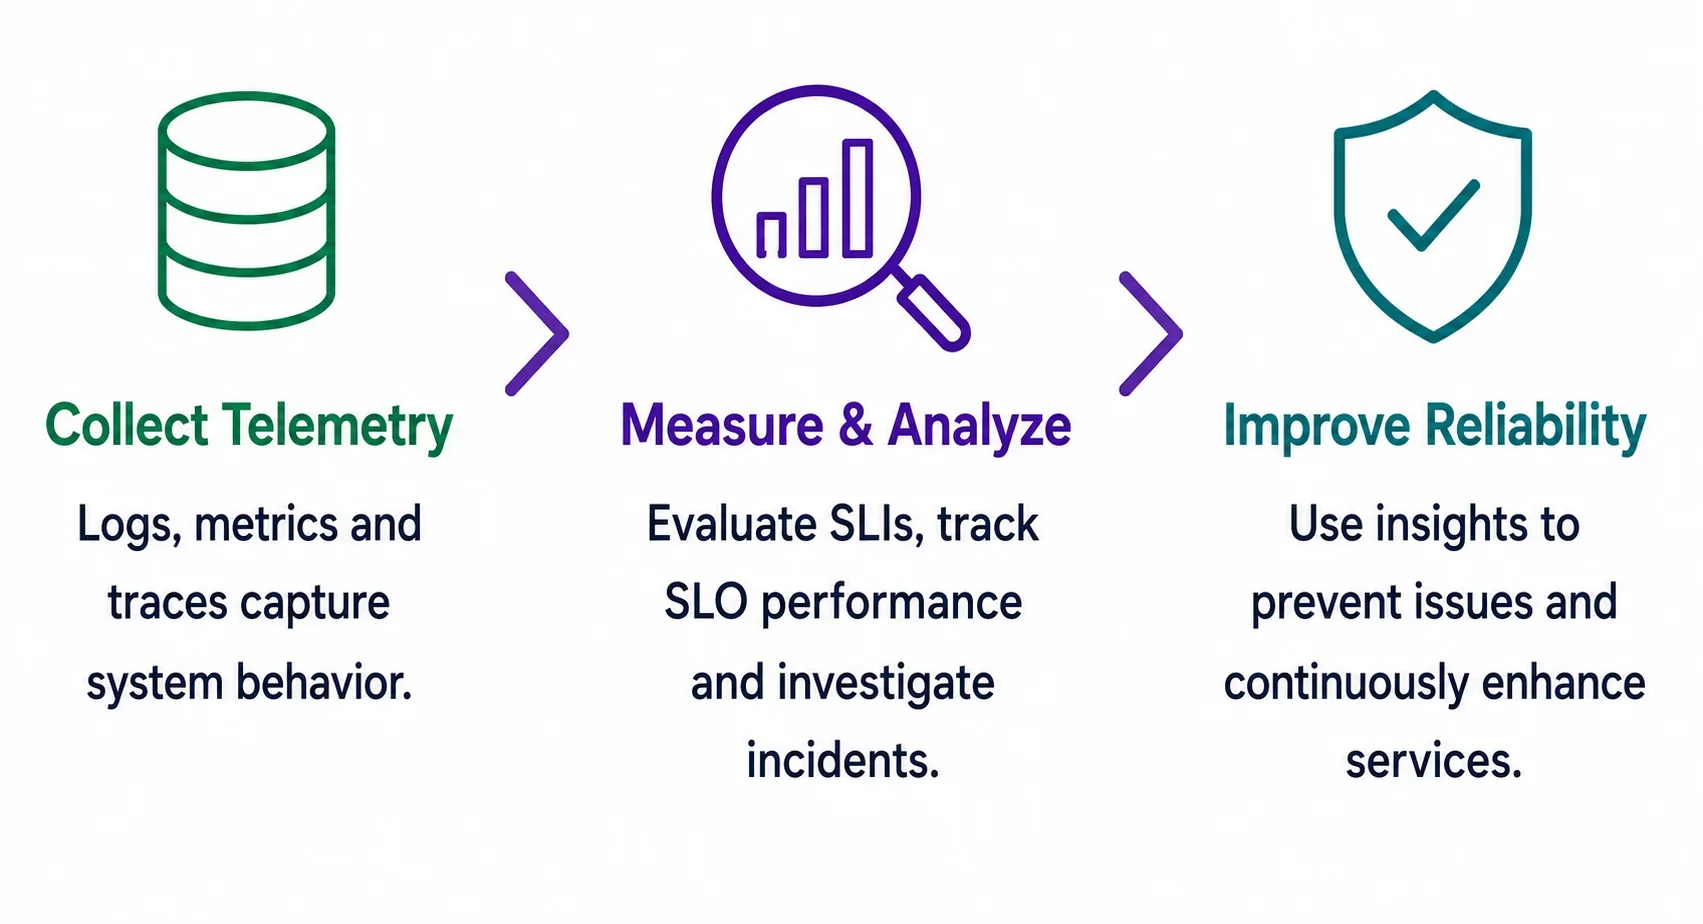
Figure 6: Phases in the observability lifecycle
SRE also establishes practices for production monitoring, incident management, change management and post-incident learning. Monitoring provides continuous visibility into system health and structured incident response helps restore service efficiently. Blameless postmortems focus on identifying systemic issues rather than assigning individual fault, which creates opportunities for continuous improvement. Automation reduces operational toil and allows engineers to spend more time improving system reliability.
Modern observability platforms support SRE by providing the telemetry needed to measure SLIs, evaluate SLO performance and investigate incidents. Logs, metrics and traces provide the operational data required to understand system behavior and assess service reliability.
Site Reliability Engineering (SRE) applies software engineering practices to operations, using observability, automation and service level objectives (SLOs) to improve reliability.
Specialized observability: database, frontend and security
Different parts of a technology stack require different observability practices. Database, frontend, and security observability each focus on distinct telemetry sources, but together they provide a more complete understanding of system health and user experience.
Database observability measures query performance and resource utilization. It provides visibility into transaction behavior and replication. It also helps engineers identify slow queries, capacity constraints and performance regressions before they affect applications or customers.
Frontend observability measures how users experience an application in real time. Real User Monitoring (RUM) captures page load performance, rendering delays, JavaScript errors, and interactions across browsers and devices. Metrics such as Core Web Vitals help engineering teams understand how application performance affects user satisfaction and search visibility.
Security observability brings together telemetry from sources such as infrastructure, applications, identity systems, cloud services and network devices for analysis in security and operational workflows. Security telemetry can be analyzed alongside other forms of operational telemetry. Organizations can ingest logs from cloud services, infrastructure and security tools and analyze them across technical and business datasets.
Specialized observability extends visibility to databases, user experiences and security systems. It helps teams optimize performance and strengthen resilience.
Observability across industries
Observability is a foundational capability across industries, but the operational priorities and business outcomes it supports vary considerably. Organizations use telemetry to maintain service reliability, meet regulatory requirements and optimize customer experiences, yet the systems being monitored and the risks associated with failure differ by sector.
In telecommunications, observability provides visibility across distributed networks, edge infrastructure and customer-facing services. Engineering teams use telemetry to identify network degradation, isolate faults and maintain service availability across millions of connected devices. Faster incident detection and resolution help reduce service disruptions and improve customer satisfaction.
Financial services organizations depend on observability to monitor payment systems, trading platforms and digital banking applications where performance and reliability directly affect revenue and customer trust. Telemetry can provide operational information that organizations may use in fraud-detection and compliance-related workflows. Low-latency monitoring also helps institutions maintain the performance expected for time-sensitive financial transactions.
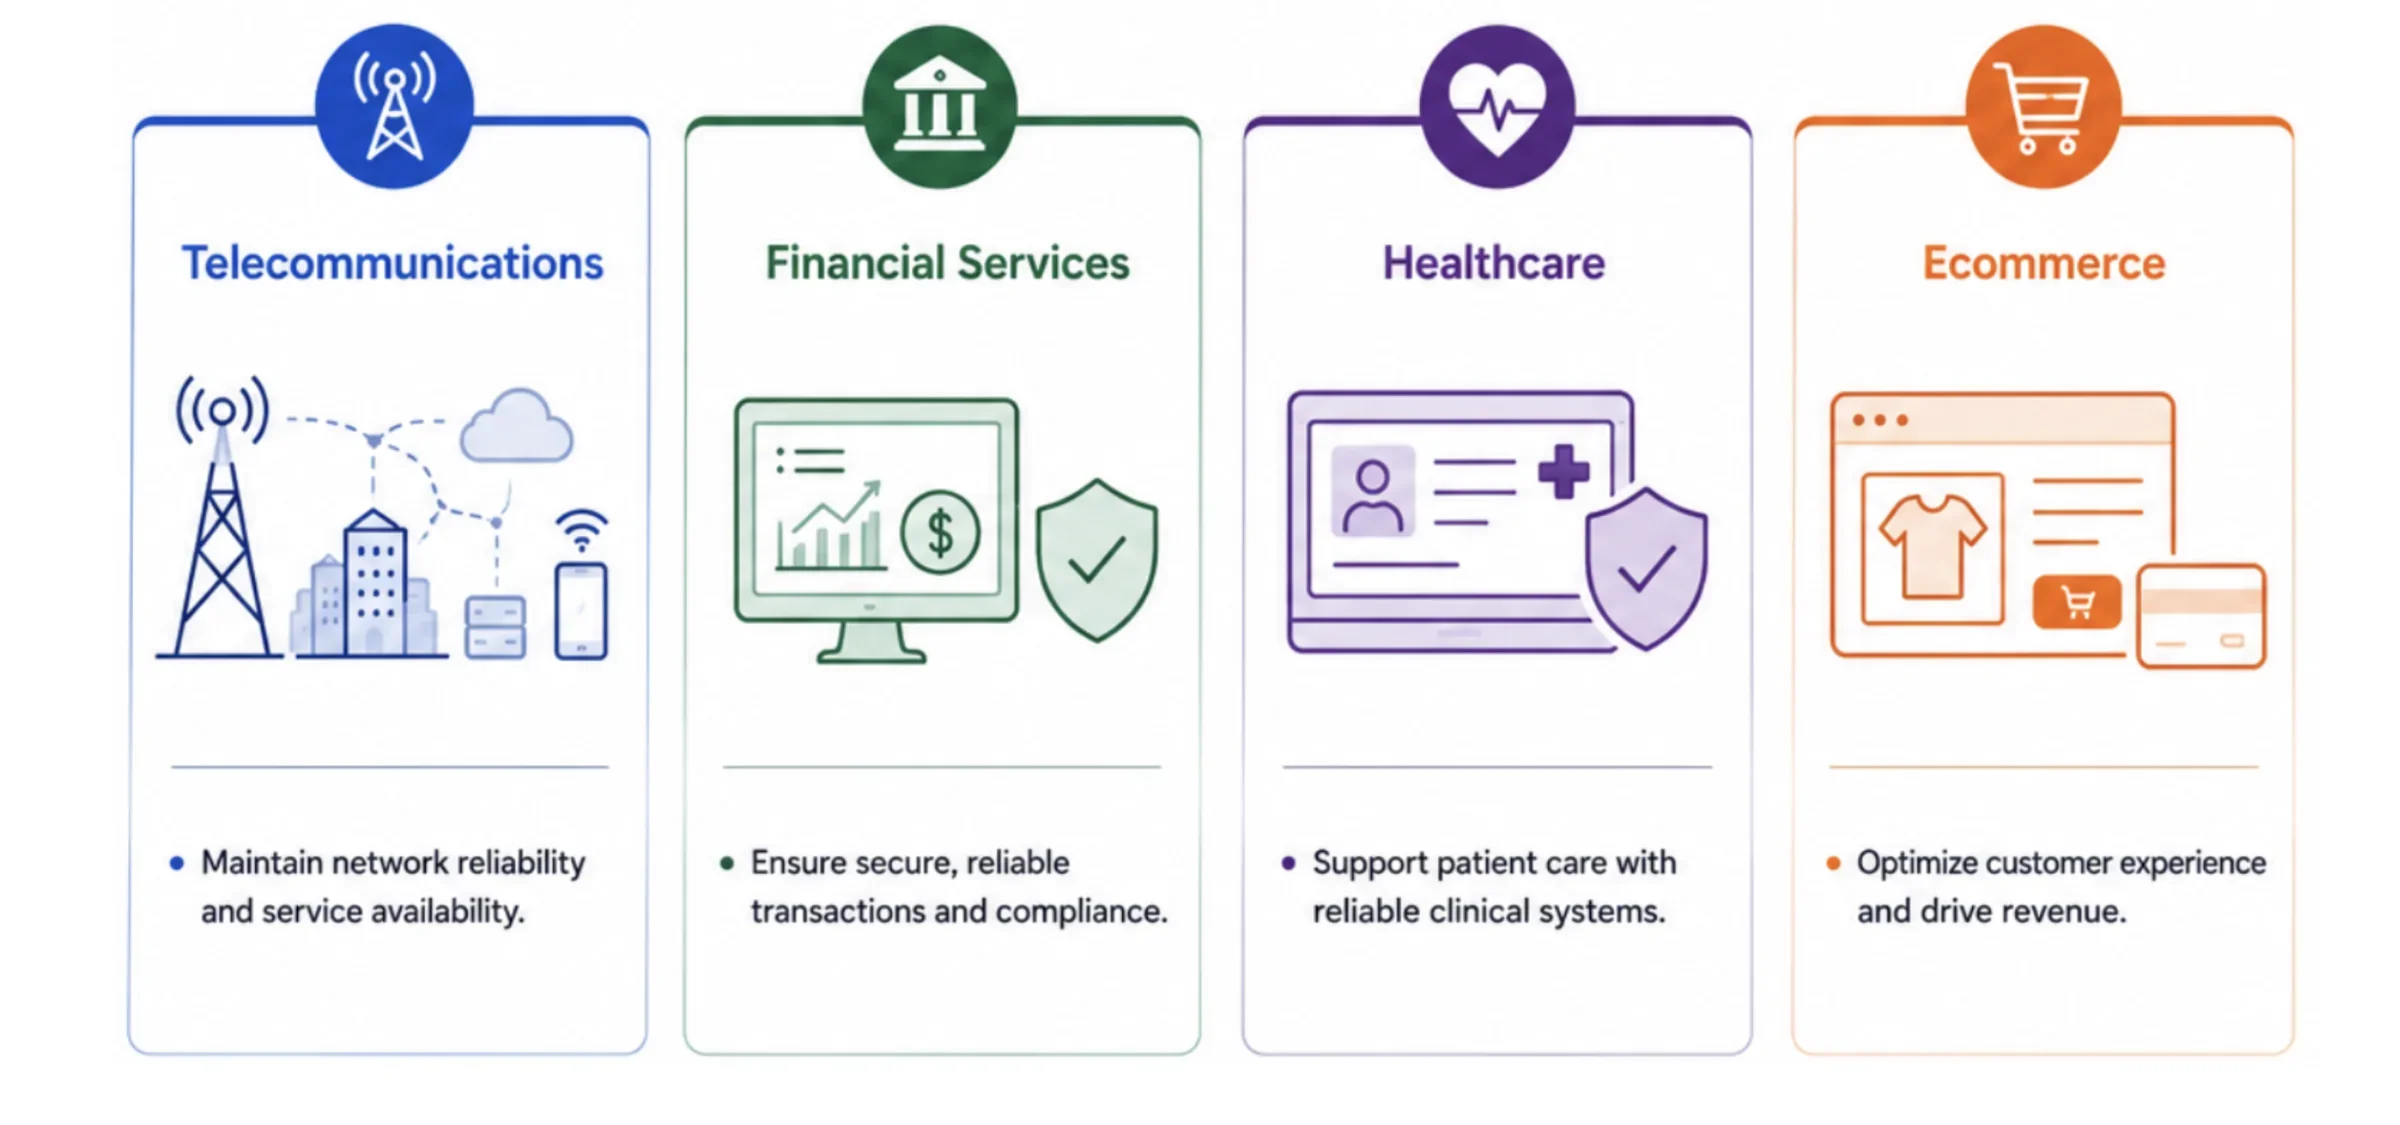
Figure 7: Applications of observability across industries
Healthcare providers rely on observability to ensure the availability of clinical applications and electronic health record systems. Continuous monitoring can help identify performance issues and provide operational records that organizations may use as part of their healthcare compliance programs.
For ecommerce businesses, observability directly influences customer experience and revenue. Engineering teams monitor application performance, checkout workflows and payment services to identify bottlenecks that could increase cart abandonment. During seasonal traffic spikes or promotional events, telemetry enables teams to maintain application performance and quickly resolve issues that could impact sales.
Across every industry, observability connects operational health to measurable business outcomes. Reduced downtime, more efficient incident response and improved customer experiences can contribute to greater operational resilience and help organizations manage business risk.
As cloud environments grow more distributed, observability gives teams across industries the visibility to understand system behavior, improve reliability and keep applications performing at scale.
Vivek Raghunathan
SVP of Engineering at Snowflake
Observability roles
Observability is a shared responsibility that spans multiple engineering teams. Each role contributes different expertise, but all rely on telemetry to understand system behavior and maintain reliable services.
Site Reliability Engineers (SREs) are responsible for maintaining service reliability and availability. They use observability to measure Service Level Indicators (SLIs), track Service Level Objectives (SLOs), investigate incidents and identify opportunities to improve system resilience.
DevOps engineers oversee software delivery and infrastructure operations. They rely on observability to monitor application deployments and troubleshoot issues across CI/CD pipelines and production environments.
Platform engineers build and operate the shared infrastructure that supports application development. They use observability to optimize infrastructure performance and ensure telemetry collection remains reliable across cloud environments and internal platforms.
Observability engineers design and maintain the organization's observability architecture. They develop instrumentation strategies, manage telemetry pipelines and create dashboards that enable engineering teams to monitor systems and investigate production issues efficiently.
Incident commanders lead the technical response during major service disruptions. They use observability to assess the scope of an incident, coordinate investigation efforts, communicate system status to stakeholders and verify that services have been fully restored before closing the incident.
As systems become more distributed, observability has become a foundational capability across engineering organizations rather than a responsibility owned by a single team.
Observability supports SREs, DevOps, platform and observability engineers, incident responders and other teams responsible for operating reliable systems.
Listen to Observe’s Field CTO Tom Batchelor explain how the platform’s data lake architecture and elastic compute provide a resilient architecture for enterprise observability — even for companies ingesting large volumes of data a day:

Why run observability on Observe by Snowflake
Observe by Snowflake is an AI-native observability platform designed for modern cloud environments. As organizations adopt microservices, Kubernetes and distributed applications, telemetry volumes have grown from millions to billions of logs, metrics, traces and events each day. As telemetry volumes grow, organizations may need to balance retention, ingestion and storage costs. Observe addresses this challenge with an architecture designed for large-scale telemetry.
Unlike traditional observability platforms that tightly couple storage and compute, Observe stores telemetry in Snowflake and uses the platform's scalable storage and compute architecture to support retention of operational data at scale. Depending on configuration and retention requirements, engineering teams can retain extended periods of telemetry while keeping historical data available for investigation.
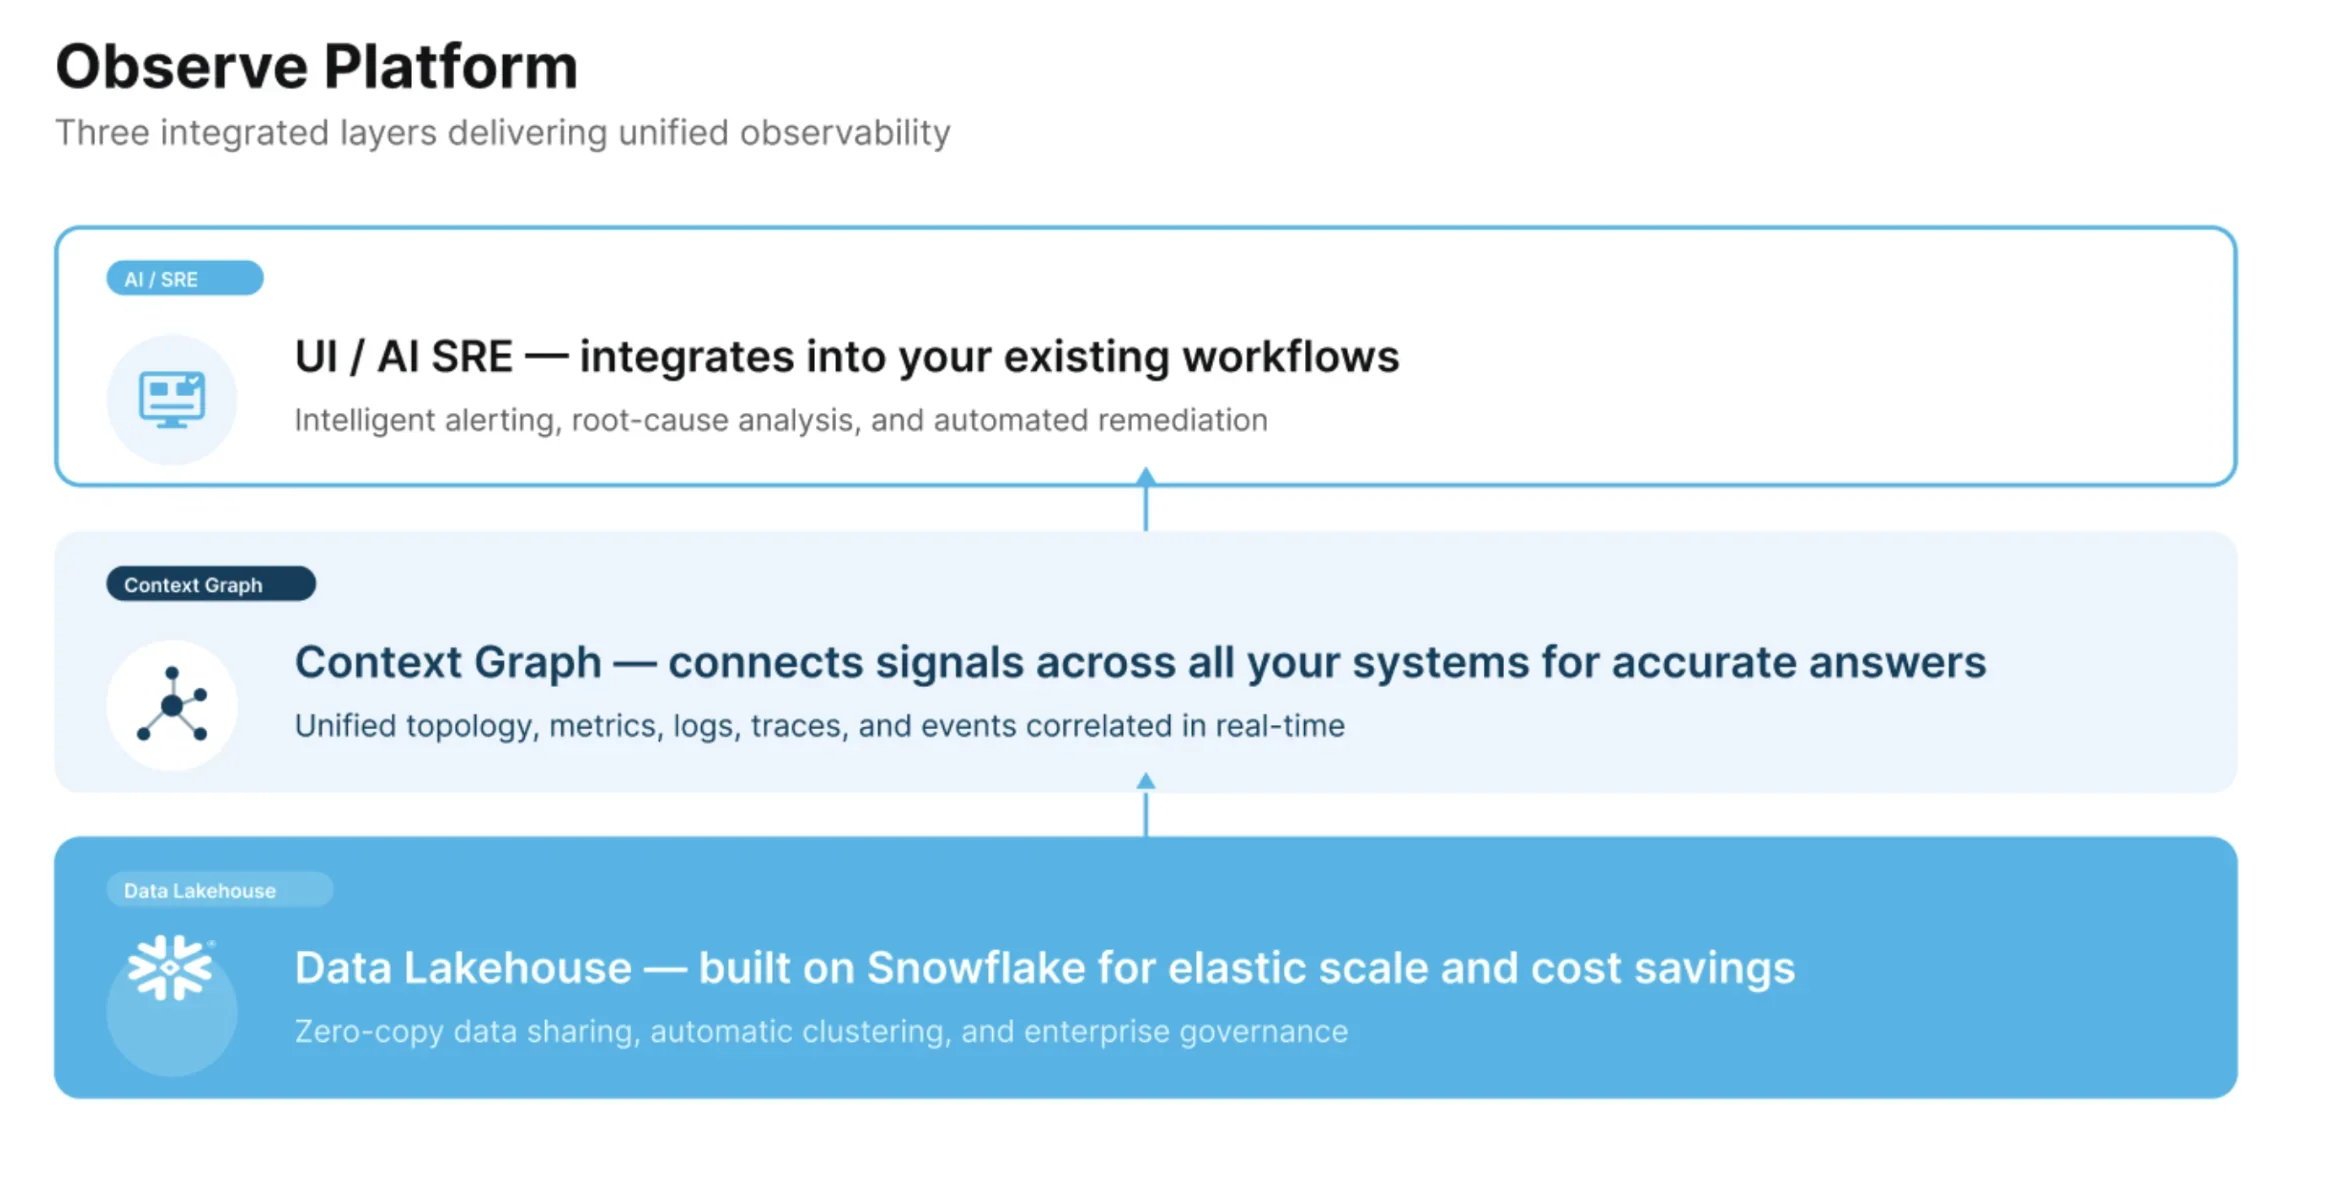
Figure 8: The Observe architecture
Observe ingests and correlates logs, metrics, traces and events into a unified operational model. Engineers can investigate incidents from a unified view that helps surface relationships across applications and telemetry. This correlated view can help engineers investigate potential root causes and respond to incidents more efficiently.
Observe also introduces AI SRE capabilities that help engineering teams investigate incidents more efficiently. AI capabilities can help summarize incidents, provide context around anomalous system behavior and surface potential root causes from correlated telemetry. Through APIs, the CLI and Model Context Protocol (MCP), Observe also enables organizations to build custom AI SRE agents that can assist with or automate portions of investigation workflows, retrieve operational context and integrate observability into enterprise AI workflows.
Because Observe runs on Snowflake, operational telemetry can be analyzed alongside other relevant data in Snowflake, helping teams connect operational and business context. This enables engineering teams to understand not only what happened but also the operational and business impact of an incident. By combining cloud-native observability, long-term telemetry retention and AI-assisted investigations, Observe provides a scalable platform for operating modern software systems.
KEY TAKEAWAY
Observability helps organizations understand complex systems by correlating telemetry across applications, infrastructure and cloud services. It is essential for faster troubleshooting, improved reliability and better operational decisions.
Frequently Asked Questions
Your common questions about observability, answered by Snowflake experts.
What is the difference between observability and monitoring?
Monitoring tracks predefined metrics and alerts to show whether known systems are operating as expected. Observability goes further by combining logs, metrics, traces and other telemetry to investigate unexpected behavior. Monitoring tells you that something has changed. Observability helps explain why it happened.
What are the three pillars of observability?
The three pillars of observability are logs, metrics and traces. Logs provide detailed event records, metrics measure system health over time, and traces follow requests as they move through distributed services. Modern observability platforms often include additional telemetry such as events, profiles, and user experience data, but logs, metrics and traces remain the foundation.
What is observability used for?
Organizations use observability to detect incidents and troubleshoot performance issues. It also helps improve application reliability and monitor cloud infrastructure. Teams use observability to investigate security events and understand the health of distributed systems. Observability also supports capacity planning, performance optimization and operational analytics across cloud-native environments.
Is observability the same as APM?
No. Application Performance Monitoring (APM) focuses on application performance and transaction behavior. It measures response times and user-facing services. Observability includes APM but extends beyond it. It also captures telemetry from infrastructure, databases and cloud platforms. This broader view helps teams understand how distributed systems behave and where failures originate.
What is OpenTelemetry?
OpenTelemetry is an open-source observability framework developed by the Cloud Native Computing Foundation (CNCF). It provides standard APIs and SDKs for collecting telemetry. It also includes instrumentation libraries and the OpenTelemetry Protocol (OTLP) for exporting logs and traces. Because OpenTelemetry is vendor neutral, organizations instrument applications once. They can then send telemetry to multiple observability platforms without changing their code.
Explore Observability Resources
Explore Observability Topics
Deep dives into every aspect of observability
