What I Learned Teaching an AI Agent the Best Practices of Data Visualization
I've made charts for research, for work, and for content creation, and I've been at it for years. I still spend way too much time tweaking them.
So I asked myself a simple question: what if I wrote my chart decisions down as rules and gave them to an agent? That idea became Chartify. It's a Streamlit app backed by a Snowflake Cortex Agent, and the agent follows 15 rules for picking the chart type, order, and color. I distilled them from years of my own charts, five data visualization books, and a widely read paper on figure design, so the agent starts where I'd start.
Along the way, I learned that getting the agent's recommendation right was only half the job. The other half was making sure the chart on screen actually matched it.
All of the code is in the companion repository, so you can run Chartify yourself or adapt its rules to your own data. Here's what this article covers:
- The problem: why chart decisions are hard to hand off, and the sorting bug that shaped the rest of the project.
- Building the agent: what it should recommend, the rules it follows, and the tools it uses to check its own recommendation.
- Testing the agent: what it recommended for a set of example questions, with screenshots of the resulting charts.
- Checking the chart on screen: the sorting fix and the Evaluation tab that checks what was actually plotted.
- Wrapping up: how the pieces fit together, what the demo does not check, and what I learned.
1. The Problem
1.1 Why Chart Decisions Are Hard to Hand Off
Ask an agent to chart revenue by region, and it has to make three decisions:
- Bars or slices?
- Alphabetical order or sorted by revenue?
- A different color for every region, or one color for the region you care about?
Each of these options produces working code and a chart. But are they useful to users? Perhaps, only some of them are.
Picking the useful ones takes judgment, and that judgment has to come from somewhere. For Chartify, it comes from an agent following my rules.
The word "agent" gets thrown around a lot, so here's what I mean by it.
Most "AI apps" send a prompt to a model and show you whatever comes back. That's what I'd call AI-powered. An agent does more: it takes actions, like running a query or calling a tool, looks at the results, and decides what to do next.
My first version of Chartify was AI-powered. One model call, a hand-written description of the columns, and some chart settings back. The current version is an agent. You ask a question in plain English, like "Show me revenue by region." The agent queries your data in Snowflake, proposes a chart, and validates it against the data. If the check fails, it gets one chance to revise. Then it submits the chart settings along with the rules it used, and the app draws the chart.
1.2 When the Agent Was Right and the Chart Was Wrong
My most useful lesson didn't come from the agent getting something wrong. It came from the agent getting everything right. I asked for revenue by region. The agent recommended sorting regions from highest to lowest, exactly what the rules say. The chart showed them in alphabetical order:
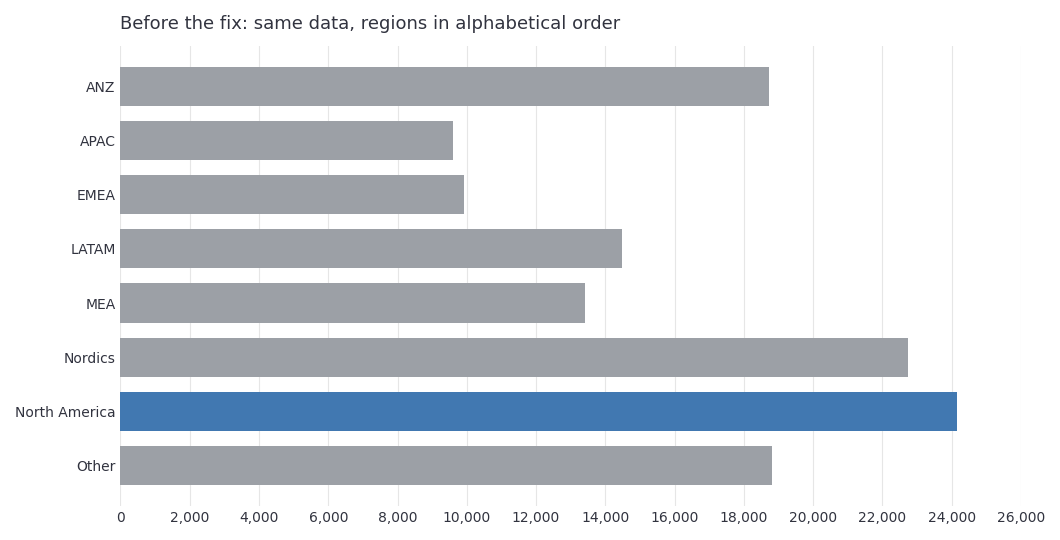
Figure 1. A recreation of the bug using the app's sample data. The highlight is there, but you have to scan every bar to find out that North America leads and Nordics is a close second.
The agent was fine, but the rendering code wasn't. That bug taught me to check what the app actually sends to the renderer as well as what the agent recommends. Here's the same request after the fix, with the ranking you can read top to bottom:
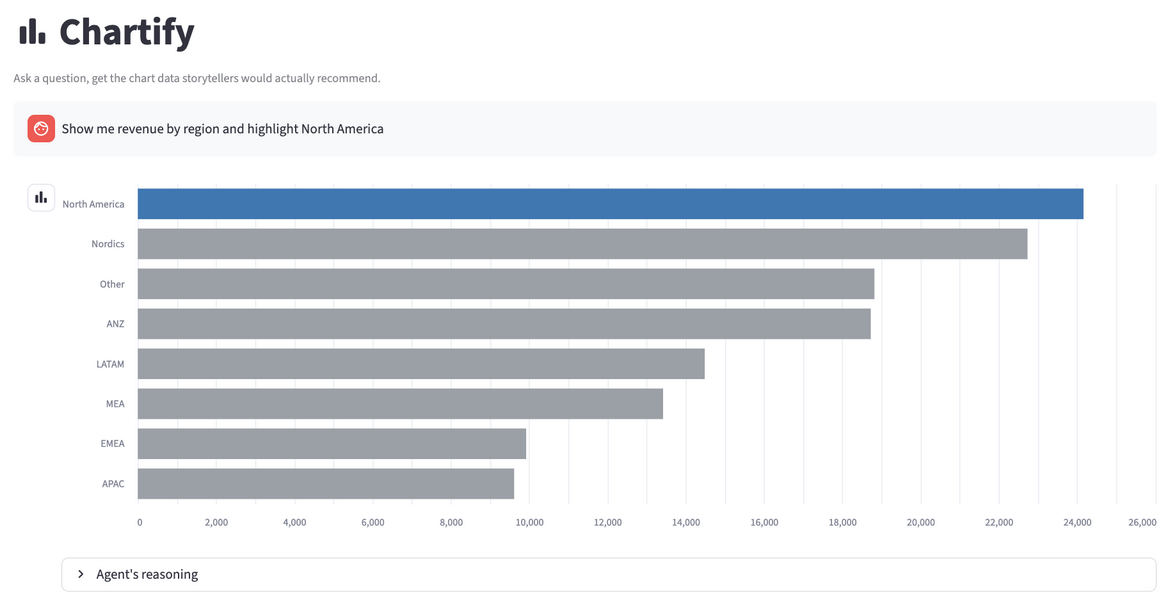
Figure 2. Chartify responds to "Show me revenue by region and highlight North America." The agent queries Snowflake tables to guide its chart recommendation, while the app draws the chart using separate local sample data.
2. Building the Agent
Building Chartify's agent came down to three layers: what it should recommend, the rules it follows to decide, and the tools it uses to check itself.
2.1 Defining What the Agent Should Recommend
Before writing a single rule, I had to define "the right chart." Even the revenue-by-region example hides two separate decisions: which chart type to use, and how to order and emphasize the data inside it.
Choosing a Chart Type
The first decision is the chart type. It has one job: help the reader answer the question. Revenue over time? You need a chart that makes the trend obvious. Ranking eight regions? You need a chart that makes the values easy to compare.
Choosing Sort Order, Color, and Emphasis
Picking the right chart type is only the first decision. A bar chart can show regional revenue, but sort it alphabetically and the ranking disappears. Give every region its own color and nobody notices North America, even when that's the whole point of the question. The agent needs rules for ordering and emphasis, not just chart selection.
2.2 Turning Visualization Guidance into Agent Rules
So the agent has to know two things: what to draw, and how to arrange it. Where do the rules for that come from?
The good news: there's no shortage of advice. I drew on several well-known data visualization books and a widely read paper on figure design, listed in the Further Reading section at the end.
The hard part was deciding which advice an agent could actually use.
Choosing Which Chart Types to Support
"Make a good chart" is useless as an instruction, because an agent can't follow it. So I narrowed the problem until every piece of advice could become a specific rule.
Chartify supports eleven chart and table types over sample datasets for revenue, signups, correlations, budgets, and rankings. With the scope fixed, every rule can name the situation it covers and the chart it calls for.
Table 1. The chart and table types Chartify supports, and when each is used.
| Type | Used for |
|---|---|
| Line chart | A trend over time |
| Bar chart | Categories with a natural order, such as days of the week |
| Horizontal bar chart | Ranking more than two categories |
| Stacked bar chart | Part-to-whole with four or five categories |
| Diverging bar chart | Change relative to a baseline, target, or zero |
| Slope chart | Rankings that change between exactly two time points |
| Pie chart | Part-to-whole with three or fewer categories |
| Histogram | The distribution of a single numeric column |
| Scatter chart | The relationship between two numeric variables |
| Heatmap | Correlations across three or more numeric variables |
| Table | An explicit request for raw data |
You'll notice four of these are bar charts, and that's on purpose.
Comparing bar lengths along a shared baseline is one of the easiest ways for people to compare values. So the rules keep the bars and change only how they're arranged: natural order, sorted by value, stacked into a whole, or diverging from zero.
That makes bar charts a good worked example of the rules in action. And the idea carries over to any chart family: start from what the reader needs to compare, then pick the variation that answers each question.
Writing the Rules the Agent Follows
A list of chart types doesn't tell the agent which one to pick. Every rule needs two things: a condition that triggers it, and often an exception that overrides it.
Here's an example with two questions, both comparing categories:
- Revenue by region. Use horizontal bars, sorted from highest to lowest. The ranking jumps out.
- Signup rate by day of the week. Same kind of comparison, but the exception kicks in: keep Monday through Sunday in order. Sort the days by value and you destroy the weekly pattern.
A quick note on the numbers you'll see. The conditions and cutoffs are my own interpretation of the literature rather than a universal standard. Chartify uses pie charts for up to three categories and stacked bars for four or five, so the agent never has to choose between them on its own.
Are three and five the right numbers? Not necessarily. They're arbitrary cutoffs, and I picked them because they're simple to remember and easy for an agent to apply. If you prefer a different threshold, it's a one-line change.
Here's how to read the rules. The opening lines handle requests for raw data, which return table with no rule IDs. Rules 1 to 8 map the shape of a question to a chart type. Rules 9 to 12 handle emphasis, color, and ordering. Rules 13 to 15 set constraints: minimal decoration, zero baselines, and a caption that actually says something. The last two lines tell the agent how to report the rules it used and keep its explanation short.
Two terms need a definition. The data-ink ratio (rule 13) is the share of a chart's ink that shows data rather than decoration, so gridlines, borders, and 3D effects lower it. The Lie Factor (rule 14) compares how big a difference looks with how big it really is. Start a bar axis at 90 instead of 0, and revenue of 100 versus 110 looks like a 2x gap.
Here's the full instruction text the agent follows:
You are a chart-recommendation engine. If the user explicitly asks for a table, a raw data listing, or a list rather than a chart, respond with chart_type table and leave rule_ids empty, regardless of the rules below. Otherwise, apply these rules in priority order:

1. Time-based trend (a date/time column vs a numeric column) -> line_chart.

2. Ranked comparison across more than 2 categories -> horizontal_bar_chart, sorted by value descending, unless the category has intrinsic order (e.g. days of week, size tiers), in which case use bar_chart in that natural order.

3. Part-to-whole with 3 or fewer categories -> pie_chart. Part-to-whole with 4 or 5 categories -> stacked_bar_chart. Never recommend pie_chart for more than 3 categories, and never recommend either for more than 5 categories.

4. Distribution of a single numeric column across many rows -> histogram.

5. Relationship between two numeric variables -> scatter_chart.

6. Correlation or relationship across three or more numeric variables at once (not just two) -> heatmap, with a diverging color_scheme centered on zero.

7. A value's change relative to a baseline, target, or zero (variance, surplus/deficit, year-over-year change) -> diverging_bar_chart with a diverging color_scheme, not a plain bar_chart.

8. Ranking of categories that changes across exactly two time points (before vs after, this year vs last year) -> slope_chart. For more than two time points, prefer line_chart instead.

9. If the question implies comparing exactly one series against the rest, note in highlight which single category/series should be visually emphasized and the rest muted.

10. Never recommend a rainbow/qualitative palette for ordered or sequential data.

11. Flag color_blind_safe true only if the chosen encoding does not rely on red/green alone as the sole differentiator.

12. For any bar-shaped chart (bar_chart, horizontal_bar_chart, stacked_bar_chart, diverging_bar_chart), set sort_order to "descending" so the ranking or the extremes are visible at a glance, unless the category already has an intrinsic order (days of week, size tiers, time periods), in which case set sort_order to "natural" and do not reorder it. For chart types where sorting doesn't apply (line_chart, scatter_chart, heatmap, slope_chart, histogram, table), set sort_order to "natural".

13. Regardless of chart type, maximize the data-ink ratio: never suggest heavy gridlines, 3D effects, decorative borders, or a legend for information a direct label could show instead. This rule applies to every chart_type (except table), so include 13 in rule_ids whenever a chart is produced.

14. For any chart that encodes magnitude as bar length (bar_chart, horizontal_bar_chart, stacked_bar_chart, diverging_bar_chart, histogram), the value axis must start at zero. A truncated axis makes the visual size of a difference disproportionate to the real difference in the data (the Lie Factor); never suggest a non-zero baseline for these types.

15. Regardless of chart type (except table), the reason field is not optional decoration -- it must explain what the chart actually shows (the trend direction, the largest category, the outlier, the correlation) or point out what's noteworthy, not merely restate the chosen chart_type. A figure without a caption forces the viewer to guess. Include 15 in rule_ids whenever a chart is produced.

In rule_ids, list the numbers (1-15) of every rule above that was decisive in reaching this recommendation, in the order they were applied.

Keep the reason field under 20 words.
Remember the signup-rate-by-weekday example from earlier? That exception lives in rule 2: a ranked comparison gets sorted by value, unless the categories have a natural order like days of the week, in which case they stay in that order.
2.3 Giving the Agent Tools to Check Its Recommendation
Rules tell an agent what to recommend, but they can't tell it whether the data supports that recommendation. For that, the agent needs to act on the data and check.
That was the problem with my first version. It was a single AI_COMPLETE call with a JSON schema, working from a column description I wrote by hand. It had no way to look at the data and check its own assumptions.
Querying Snowflake Data and Validating Chart Settings
To give the agent a way to look at the data and check its own work, I rebuilt the recommendation step as a Cortex Agent with three tools. The agent is instructed to query the data, validate its proposed chart, and submit the settings the app needs.
The query tool relies on a semantic view: a description of tables in business terms that Cortex Analyst uses to turn a plain-English question into SQL. It tells Analyst which columns are dimensions to group by, which are measures to add up or average, and how the tables join. The validation tool is a stored procedure, a function that lives in Snowflake and runs there.
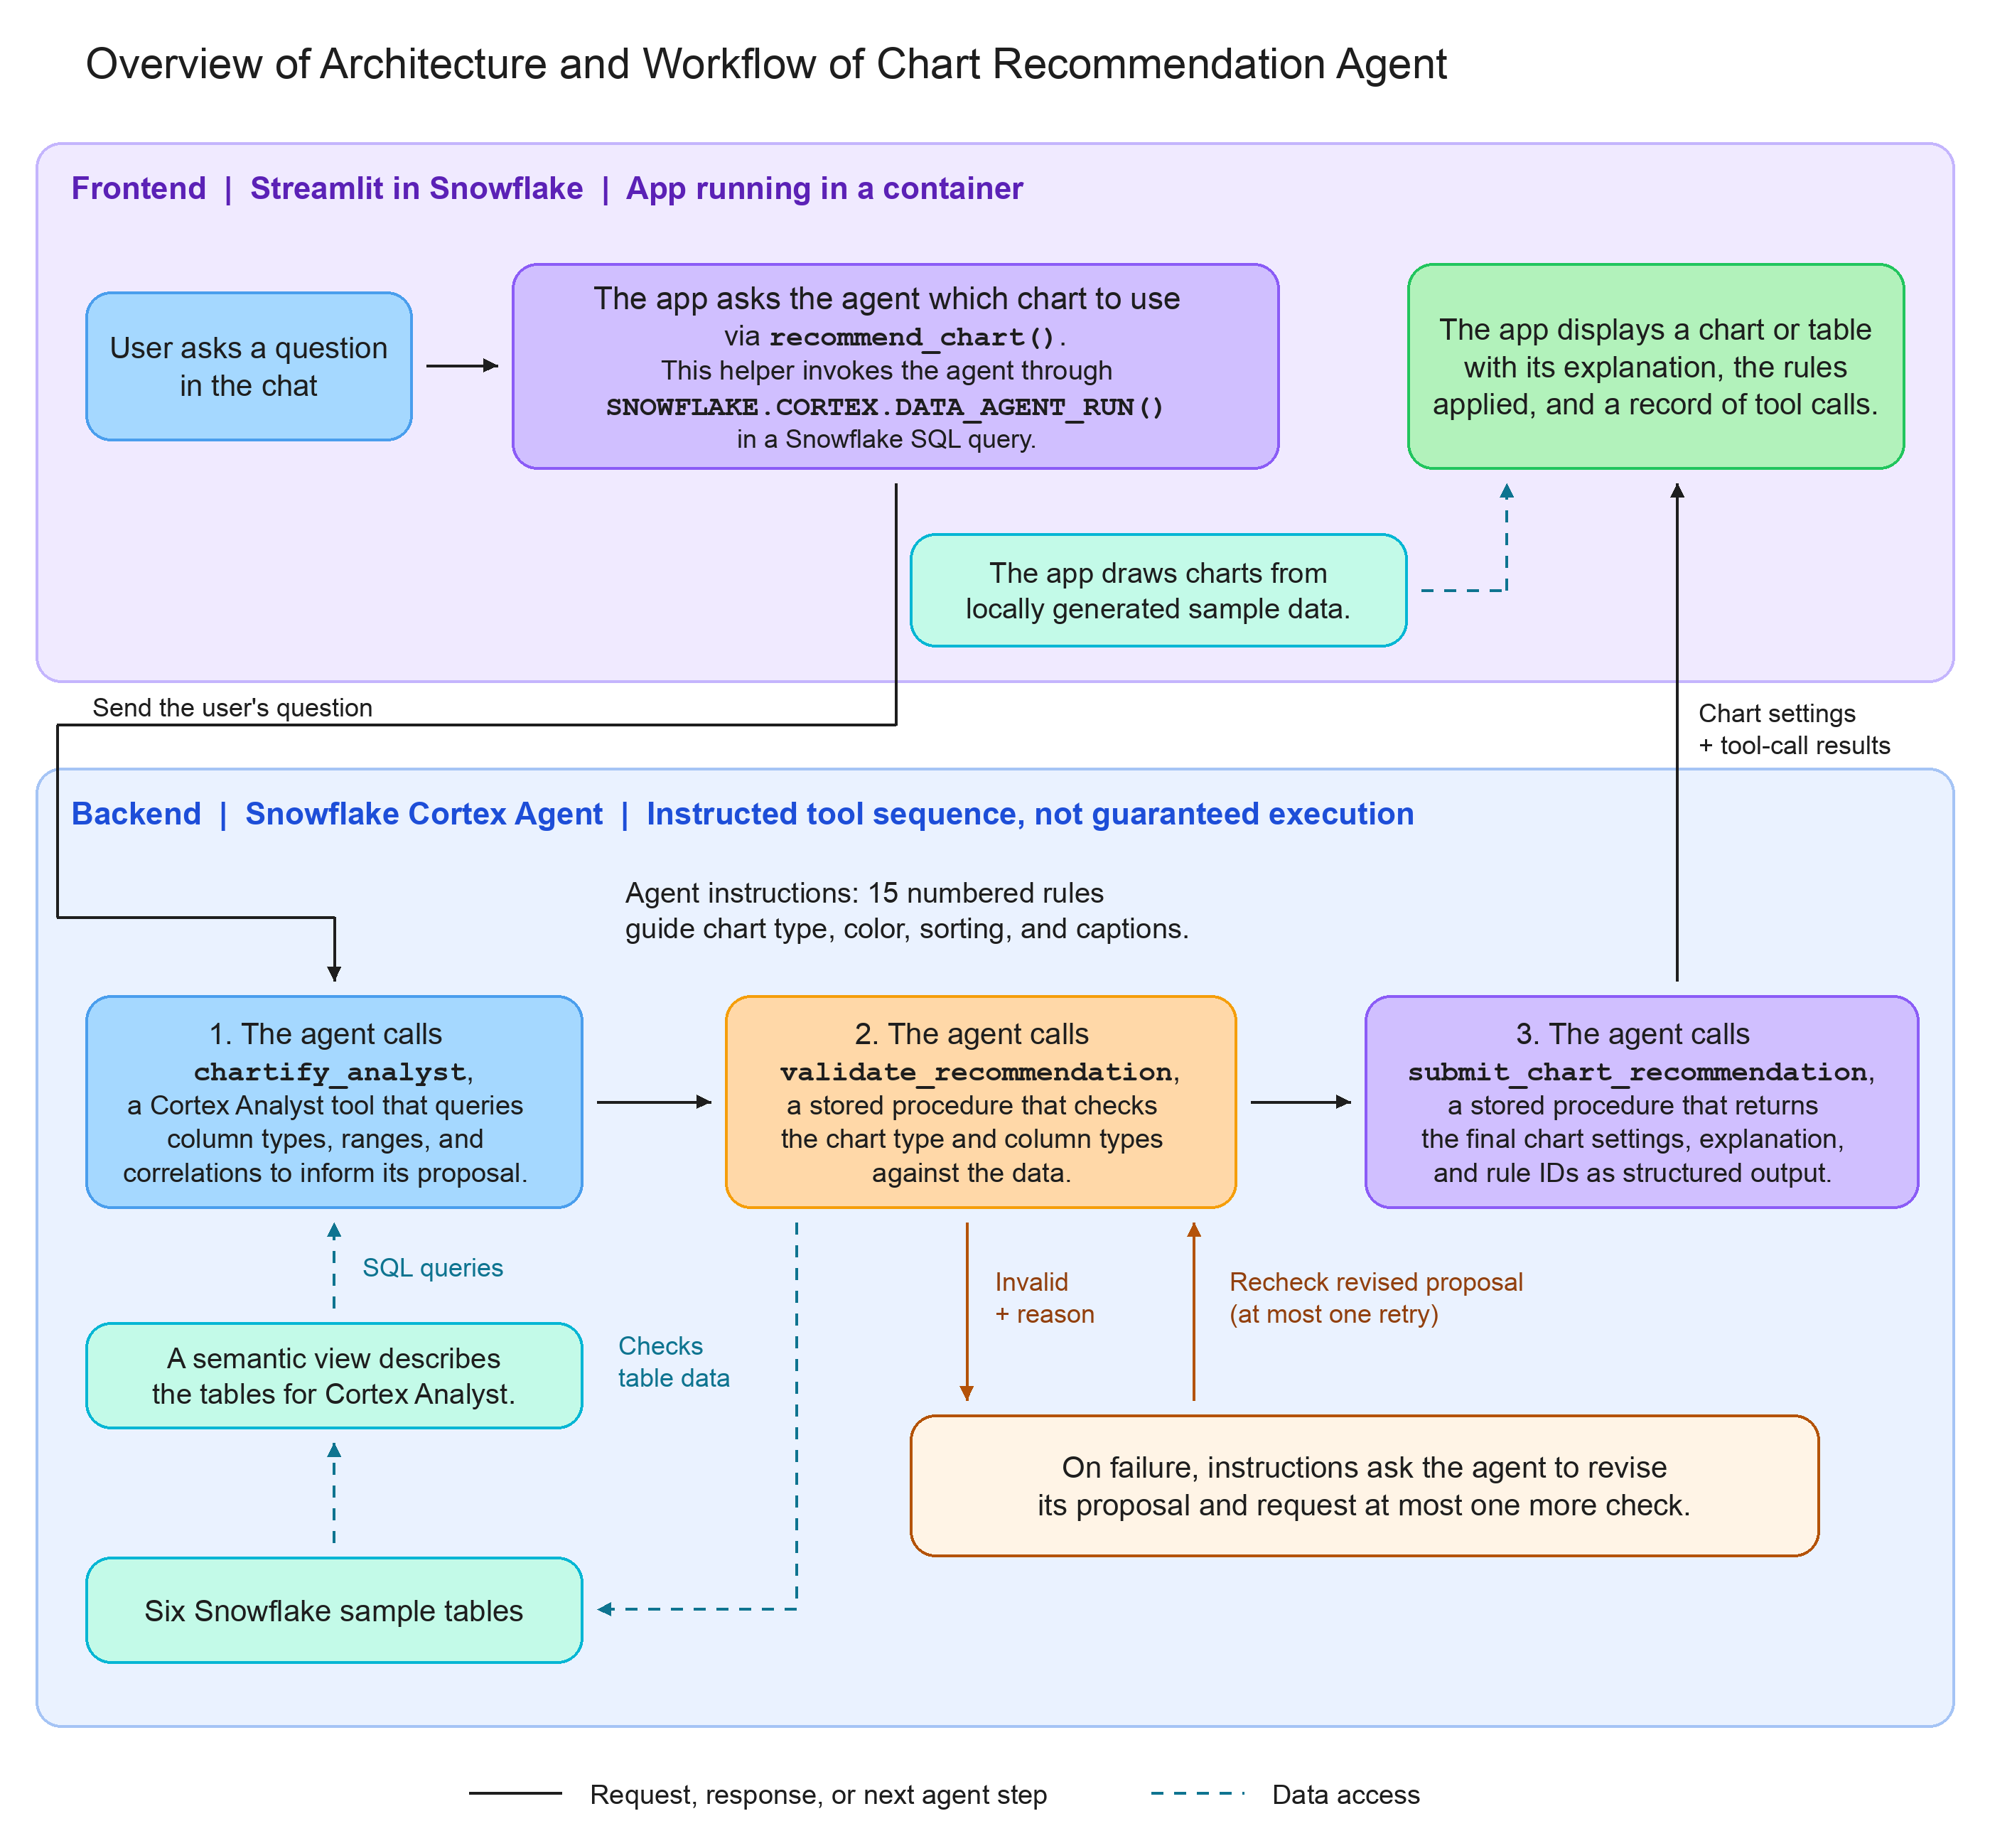
Figure 3. The tool sequence the agent is instructed to follow: query, validate, then submit. If validation fails, the agent can revise its proposal and check it once more.
Each tool has a narrow job. The first gathers facts about the data, the second checks the proposed chart against those facts, and the third hands the final settings back to the app. Table 2 lists them by name.
Table 2. The agent's three tools and what each one does.
| Tool | Job |
|---|---|
chartify_analyst | Uses Cortex Analyst and a semantic view over six Snowflake tables to query column types, values, ranges, and correlations. |
validate_recommendation | Calls a stored procedure to check whether the proposed chart and columns fit the data's structure. |
submit_chart_recommendation | Returns the chart type, order, colors, highlight, explanation, and rule IDs through a structured tool result. |
The validator catches proposals that don't fit the data. A correlation heatmap needs enough numeric columns. A signed-variance chart needs negative values to show. What it can't do is tell you whether labels overlap on screen.
Here's the validator at work on the regional revenue question. The agent proposes a descending horizontal bar chart over REGION and REVENUE, and the validator confirms that the columns fit:
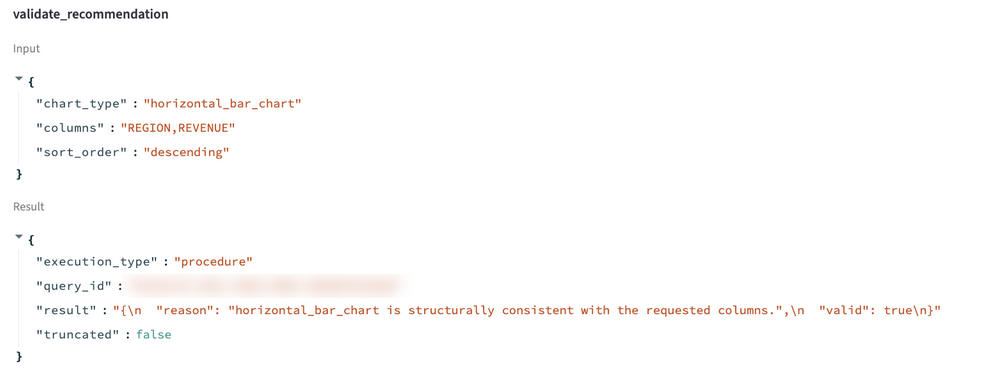
Figure 4. The recorded validation result for the regional-highlight request. The Tool Calls tab lets you inspect which tools ran and what they returned.
The agent specification is where these tools are defined. Here's the part of it that lists the three tools and connects each one to the Snowflake object it calls:
tools:
  - tool_spec:
      type: "cortex_analyst_text_to_sql"
      name: "chartify_analyst"
  - tool_spec:
      type: "generic"
      name: "validate_recommendation"
      input_schema:
        type: "object"
        properties:
          chart_type: {type: "string"}
          columns: {type: "string", description: "Comma-separated column names."}
          sort_order: {type: "string"}
        required: [chart_type, columns, sort_order]
  - tool_spec:
      type: "generic"
      name: "submit_chart_recommendation"
      # input_schema lists chart_type, sort_order, color_scheme, highlight,
      # color_blind_safe, reason, and rule_ids

tool_resources:
  chartify_analyst:
    semantic_view: "CHARTIFY_DEMO.PUBLIC.CHARTIFY_SEMANTIC_VIEW"
    execution_environment: {type: "warehouse", warehouse: "CHARTIFY_WH"}
  validate_recommendation:
    type: "procedure"
    identifier: "CHARTIFY_DEMO.PUBLIC.VALIDATE_RECOMMENDATION"
    execution_environment: {type: "warehouse", warehouse: "CHARTIFY_WH"}
  submit_chart_recommendation:
    type: "procedure"
    identifier: "CHARTIFY_DEMO.PUBLIC.SUBMIT_CHART_RECOMMENDATION"
    execution_environment: {type: "warehouse", warehouse: "CHARTIFY_WH"}
The specification has two parts:
toolsdefines what the agent can call: an Analyst tool for querying data, and twogenerictools whoseinput_schemadescribes the arguments the agent has to supply.tool_resourcesconnects each tool to the Snowflake object that runs it, either the semantic view or a stored procedure, plus the warehouse.
With the tools defined, the app needs a way to send the agent a question. It does that through SNOWFLAKE.CORTEX.DATA_AGENT_RUN, a SQL function that runs the agent and returns its full response:
def _run_agent(question: str) -> dict:
    conn = st.connection("snowflake")
    request_body = json.dumps(
        {"messages": [{"role": "user", "content": [{"type": "text", "text": question}]}]}
    )
    query = """
        SELECT TRY_PARSE_JSON(
            SNOWFLAKE.CORTEX.DATA_AGENT_RUN(?, ?)
        )::string AS response
        """
    rows = conn.query(query, params=[get_agent_fqn(), request_body], ttl=0)
    return json.loads(rows["RESPONSE"].iloc[0])
The function itself is simple. It wraps the question in the message format the agent expects, passes it with the agent's name as bind parameters (placeholders that Snowflake fills in safely when the query runs), and parses the JSON that comes back. ttl=0 stops Streamlit from serving a cached answer when someone asks the same question twice. That response holds every tool call the agent made and every result it got back. The app pulls out the submission to draw the chart and keeps the rest, which is what the Tool Calls tab shows.
Returning Chart Settings to the App
That submission is the last step in the tool sequence. Once a proposal passes validation, the agent calls submit_chart_recommendation and returns its settings as structured fields, so the app can read each value directly instead of interpreting a paragraph of text.
The schema describes those fields, but it doesn't guarantee the agent will call the tool. So the app rejects anything missing, failed, duplicated, truncated, or malformed. When that happens, it keeps the earlier chat turns and shows a Retry button instead of making up a recommendation.
Don't skip this check just because a request succeeded. One of my development runs returned status 200, the HTTP code for a successful request, yet the agent never called the validation or submission tools, and the trace didn't say why. When a request fails, look at the tool trace first.
One more thing to know now: the app draws its charts from local sample data, not from the agent's query results. I'll come back to the full setup in section 5.1 and to that boundary in section 5.2.
3. Testing the Agent
With the rules and tools in place, I started asking questions that exercise different rules. The first surprise turned out to be my fault rather than the agent's.
3.1 Clarifying Categories and the Denominator in "Top Five"
I asked for the top five product lines' share of total revenue. The agent recommended a pie chart.
The agent read the question as a comparison of two groups: the top five product lines combined versus everything else. What I actually wanted was each of the five product lines shown separately.
So I rewrote the question to name each product line separately and to use those five lines' combined revenue as the denominator:
Show each of the top five product lines as a separate share of those five product lines' combined revenue.
With the reworded question, the agent recommended a stacked bar chart instead of a pie. A single bar now spans 100% of the five lines' combined revenue, with one segment per product line, as the bottom-right panel of Figure 5 shows.
That matched the app's fixed data mapping, but I also changed the question. Clearer wording and narrowing a question to fit your demo are two different decisions.
3.2 Inspecting Returned Chart Settings and Rule IDs
With the wording fixed, I ran the rest of the example questions. Table 3 pairs each question I typed in with the chart the agent recommended and the tool calls behind it. Treat these as results from one recorded run rather than guaranteed outputs. Large language models are generally non-deterministic, and agents built on them inherit that, so the same question can come back with a different chart or a different explanation on another run.
Table 3. Recorded recommendations for the example questions.
| Question | Observed recommendation | What the agent did |
|---|---|---|
| Show me revenue by region | Horizontal bars, descending | chartify_analyst queried the regional revenue table; validate_recommendation confirmed a categorical and numeric column pair |
| How correlated are marketing spend, signups, revenue, and churn rate? | Heatmap with a diverging color scale | chartify_analyst computed the correlation matrix with CORR() in SQL: 0.95 for signups and revenue, -0.68 for marketing spend and churn |
| How does actual revenue compare to budget by department? | Diverging bars | validate_recommendation confirmed the chosen column actually contains negative values |
| What's the revenue split between the top 3 regions? | Pie chart | Applied rule 3's three-category case |
| What is average signup rate by day of week? | Bars in weekday order | Treated day of week as naturally ordered (rule 2) instead of ranking by value |
| Give me a raw data table of budget variance by department | Table | The explicit raw-data request overrode the chart rules |
The correlation question shows why the query step matters. Instead of guessing the relationships from column names, the agent measured them in SQL, then picked a chart for a matrix of signed values.
To show what these recommendations look like on screen, I asked several of the Table 3 questions again in the app while writing this article. In that later run, the agent picked the same chart type for each of them. Each panel in Figure 5 pairs a question with the chart it produced: the correlation, budget, and top-three regions questions from Table 3, plus the reworded top-five question from section 3.1 ("Show each of the top five product lines as a separate share of those five product lines' combined revenue").
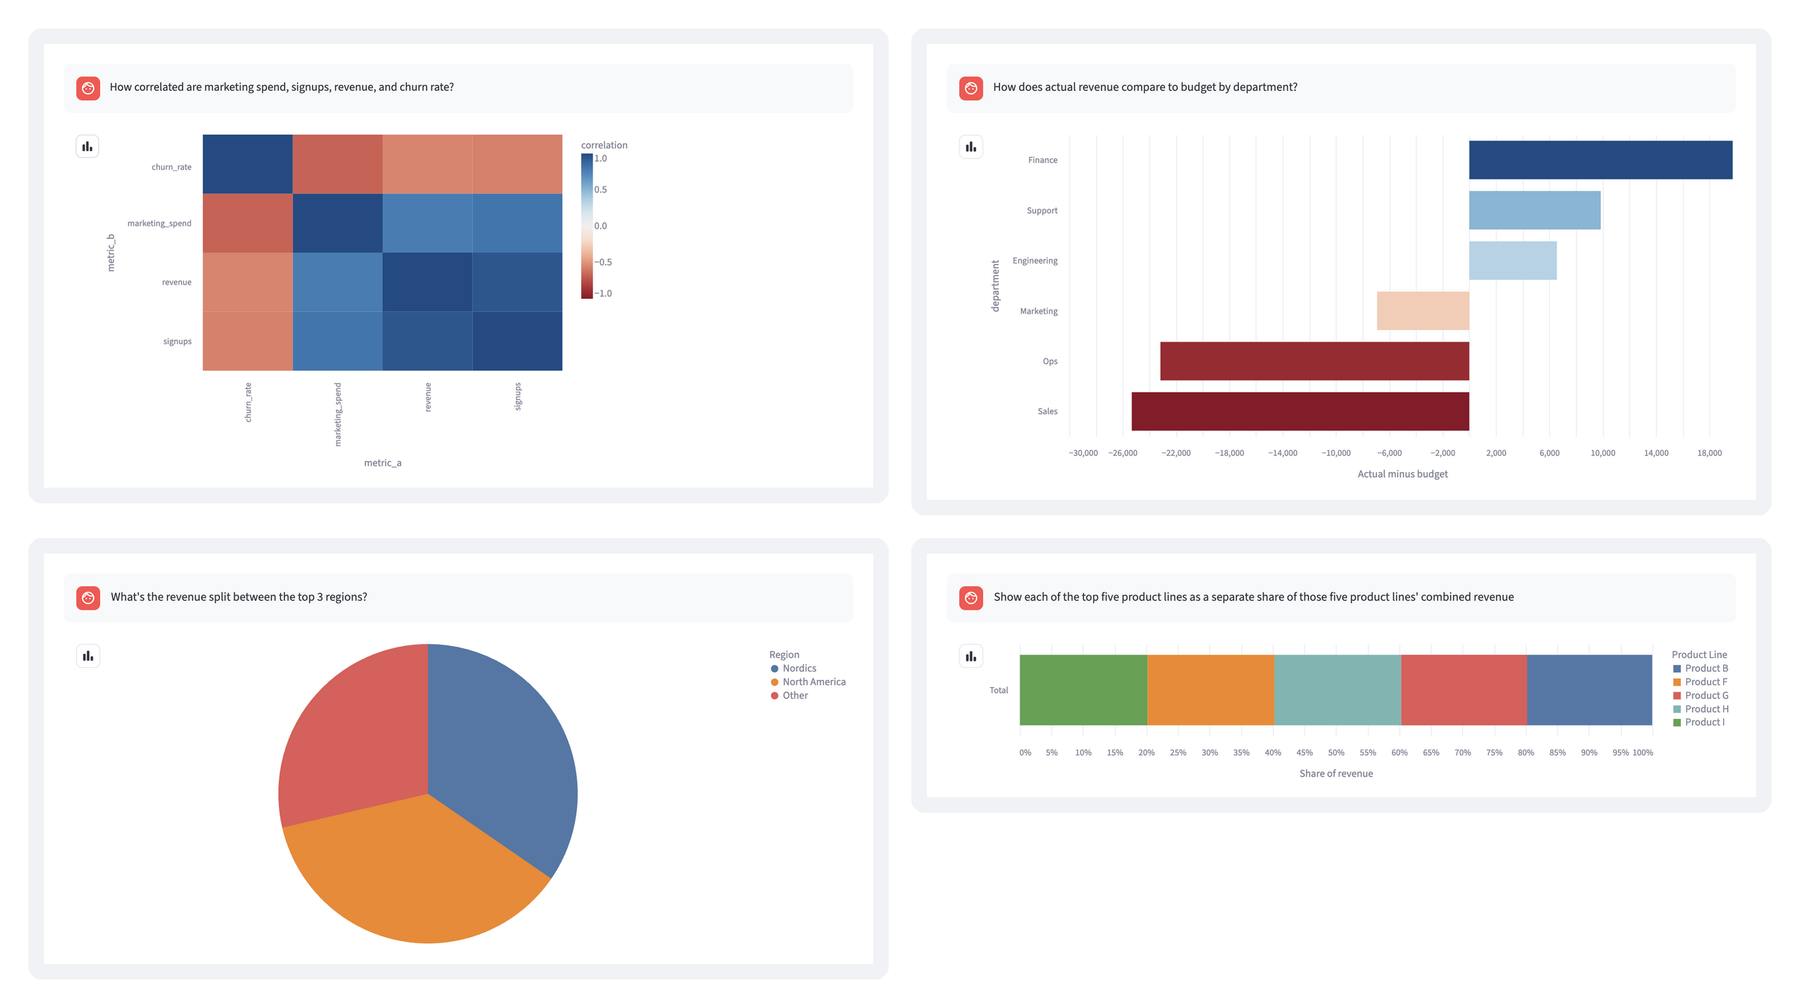
Figure 5. Chart recommendations rendered in the app for four example questions. Top row: a heatmap with a diverging color scale and diverging bars for actual versus budget. Bottom row: a pie chart for three parts of a whole and the reworded top-five question as a stacked 100% bar.
The correlation question produced the heatmap in the top-left panel. Blue cells mark positive correlations and red cells mark negative ones, with white at zero, so churn rate's negative relationship with the other three metrics stands out at a glance.
The budget question needs a chart that shows values above and below a reference point. In the top-right panel, the bars extend right for departments that came in over budget and left for those that fell short, sorted from the largest surplus to the largest shortfall.
The top-three regions question is one of the few cases where the rules allow a pie chart, since there are only three parts of a whole to compare (bottom left). "Other" is one of the eight regions in the sample data, not a bucket for the remaining regions.
For the weekday question, the agent kept the days in calendar order rather than ranking them by value, as rule 2 allows for naturally ordered categories. That run also tripped one of the app's evaluation checks, which I come back to in section 4.2.
Here's the submission the app received for the plain "Show me revenue by region" question, without any request to highlight a region:
{
  "chart_type": "horizontal_bar_chart",
  "sort_order": "descending",
  "color_scheme": "sequential",
  "highlight": "North America",
  "color_blind_safe": true,
  "reason": "North America leads 8 regions; top earns ~2.5x the lowest (APAC).",
  "rule_ids": [2, 12, 14, 13, 15]
}
Every field has a job: chart_type picks the renderer, sort_order and highlight control ordering and emphasis, and color_scheme selects the palette family. reason is the plain-English explanation shown with the chart, and rule_ids lists the rules the agent applied, which the Best Practice tab displays.
This is what makes the recommendation inspectable. You can even see choices the question didn't ask for, like the North America highlight the agent added on its own. In the regional-highlight run behind Figures 2, 4, and 6, I asked for that highlight explicitly. One caveat: color_blind_safe only reflects what the agent claims, and nothing in the app runs an accessibility test to confirm it.
4. Checking the Chart on Screen
Everything so far checks the recommendation. But as the opening example showed, a correct recommendation still has to reach the screen intact.
4.1 Fixing Regional Bars That Appeared in Alphabetical Order
The agent returned sort_order: "descending", yet the chart showed the regions in alphabetical order, as in Figure 1.
The renderer had two bugs: an inverted ascending/descending condition, and a categorical axis that ignored the DataFrame's order.
The fix was to sort the rows first, then tell Vega-Lite the exact category sequence. Here's a simplified version of the descending case, with the zero baseline from the styling helper (the app also handles ascending and natural order):
sorted_region = by_region.sort_values(
    "revenue", ascending=False, kind="stable"
)
spec = {
    "mark": "bar",
    "encoding": {
        "x": {
            "field": "revenue",
            "type": "quantitative",
            "scale": {"zero": True},
        },
        "y": {
            "field": "region",
            "type": "nominal",
            "sort": sorted_region["region"].tolist(),
        },
    },
}
First, the code sorts the DataFrame by revenue. kind="stable" keeps tied regions in their original order. In the spec, "scale": {"zero": True} keeps the value axis at zero, and "sort" passes the sorted region names to the y-axis.
That last line is the actual fix. Without an explicit order, Vega-Lite sorts a nominal axis alphabetically. The full renderer also adds tooltips and the supported color and highlight choices.
The same approach handles the other cases. In Figure 2, North America gets an accent color and the other regions are muted. Weekdays always render Monday through Sunday instead of being ranked by signup rate. Signed bars include zero but keep their negative range, because forcing the lower bound to zero would hide part of the data.
It's also worth testing the fix where the app actually runs. My first fix used st.bar_chart(..., sort=False). It worked on my machine but failed in deployment, because that Streamlit version didn't accept sort. The explicit Vega-Lite order worked in the deployed app.
4.2 Checking Plotted Data and the Final Chart Specification
That sorting bug is why Chartify has an Evaluation tab next to its Best Practice tab. Best Practice lists the rules the agent says it applied. Evaluation checks what the app actually plotted.
The checks are plain Python and Pandas, with no extra model call or Snowflake query. For Vega-Lite charts, the evaluator sees the final specification after styling and the data passed to the chart. For native Streamlit charts, it sees the data and explicit API arguments, but not the encodings the browser resolves.
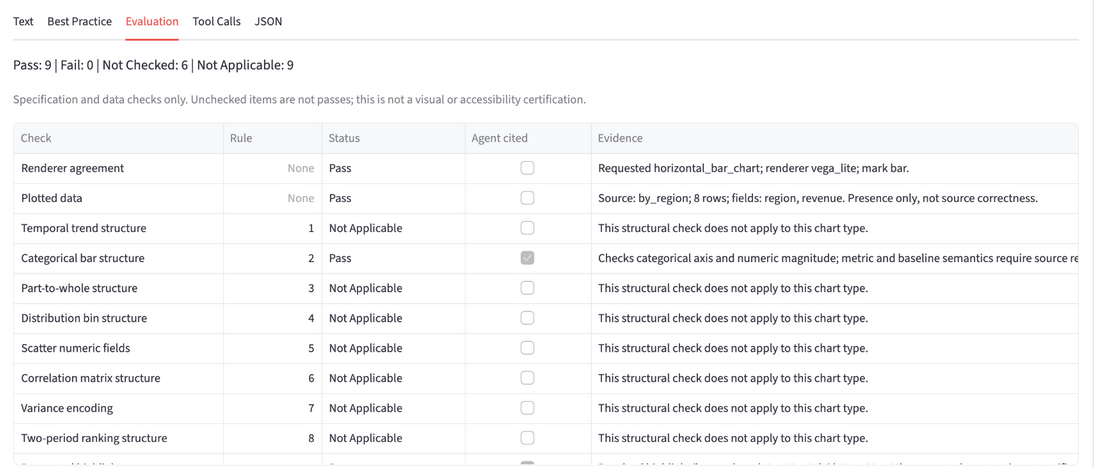
Figure 6. The regional-highlight run's evaluation summary and upper table rows. Each row separates the check result from whether the agent cited the relevant rule.
There are four statuses:
- Pass: the named check succeeded, such as confirming descending category order.
- Fail: the check found a mismatch, such as a requested highlight absent from the plotted categories.
- Not Applicable: the check does not apply to this chart or request.
- Not Checked: the available evidence cannot establish the result.
The checks cover ordering, chart structure, part-to-whole category counts, explicit zero baselines, diverging color midpoints, supported highlights, and caption presence. Others reconcile plotted values against the local source data, such as top-category selection and histogram bin counts. Time-series checks look for missing periods and duplicate or out-of-order timestamps.
The six Not Checked results in Figure 6 matter as much as the nine passes.
The evaluator can't tell you whether the caption is accurate, whether the data answers the question, whether labels overlap, whether the chart is cluttered, or whether it's fully accessible. A chart can pass its ordering check and still need a human to decide if it answers the question. That's why there's no overall compliance score. A single number would hide exactly what you need to see.
Failures show a visible warning below the chart, and the Evaluation tab lists the evidence. The weekday run from section 3.2 is a real example. The question didn't ask for a highlight, but the agent added one on its own to mark the lowest day. Its SQL used Snowflake's DAYNAME() function, which returns three-letter names, so it asked to highlight "Sun". The app's local data uses full day names such as Sunday, so no bar matched, and the evaluator reported "Highlight 'Sun' is absent from encoded categories" (Figure 7).
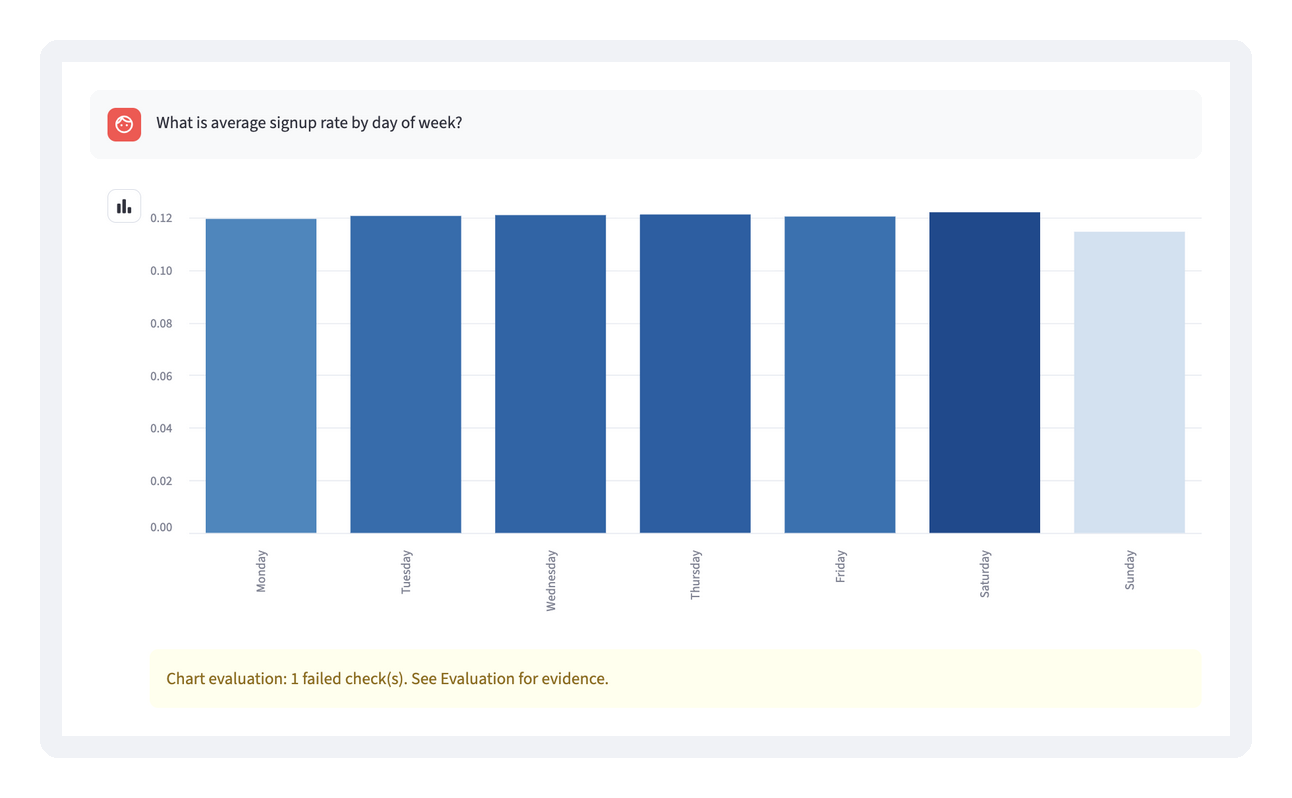
Figure 7. The weekday run's failed highlight check. The days are in the right order, but the requested highlight, "Sun", doesn't match any plotted category, so the app shows a warning below the chart.
The fix belongs in the app rather than the agent: match highlights against abbreviated day names as well as full ones before styling the chart. It's the same lesson as the sorting bug, showing up at the handoff between the agent's query data and the app's local data.
A failure like this doesn't remove the chart, and it doesn't trigger an automatic repair loop. It tells you where to look.
5. Wrapping Up
With the agent built, tested, and checked on screen, here's how the pieces fit together, where the demo stops, and what I took away from building it.
5.1 Putting the Pieces Together
Each part of Chartify so far has been covered on its own. Here's how they connect in a single request, and how the companion repository is organized.
The End-to-End Flow
Here's one question, start to finish:
- The user asks a question in the Streamlit chat input, such as "Show me revenue by region and highlight North America."
- The app calls the agent.
recommend_chart()sends the question to the Cortex Agent throughSNOWFLAKE.CORTEX.DATA_AGENT_RUN. - The agent works through its tools. It queries the data through
chartify_analyst, checks its proposal withvalidate_recommendation, revises once if needed, and finishes withsubmit_chart_recommendation, guided by the 15 rules. - The app validates the submission. It finds the submission in the agent's response and rejects anything missing, duplicated, or malformed. If there's no usable result, it shows a Retry button instead of a chart.
- The app renders the chart.
render_chart()maps the chart type to a native Streamlit chart or a Vega-Lite spec, using the local sample data for that chart type, andstyle_chart()applies the supported ordering, color, and highlight choices. - The app evaluates what it drew.
evaluate_chart()checks the final specification and plotted data, and the results appear with Pass, Fail, Not Applicable, or Not Checked statuses. - The app explains the result. Five tabs show the agent's reason, the rules it applied (Best Practice), the evaluation, the recorded tool calls, and the raw JSON.
Running the Companion Project
To follow along in code, you'll need a Snowflake account with access to Cortex Agents and Cortex Analyst, and Python 3.11. The companion repository generates every backend object the agent calls, including the validation procedure, but setup is still a few reviewed steps rather than one command.
All the code lives in the chart-agents-for-data-viz repository. Table 4 lists the paths you'll use most:
Table 4. Key paths in the companion repository.
| Path | What it contains |
|---|---|
app/app.py | The Streamlit chat interface, sample data, and chart renderers |
app/chart_agent.py | The rules, the agent call, and submission validation |
app/chart_eval.py, app/chart_style.py | The evaluator and the Vega-Lite styling |
cortex_project/ | The exported agent and semantic view specifications |
prepare_backend.py | Generates SQL for the six sample tables, the submission procedure, and the validator |
test_chart_*.py | Local regression tests that don't need a live agent |
To run the app and tests locally with Python 3.11:
python3.11 -m venv .venv
.venv/bin/python -m pip install './app[test]'
.venv/bin/python -m unittest discover -s . -p 'test_chart_*.py'

cd app
CHARTIFY_AGENT_FQN=<your_db>.<your_schema>.CHARTIFY_AGENT ../.venv/bin/streamlit run app.py
The first three commands create a virtual environment, install the app with its test dependencies, and run the tests. The last two start the app from the app/ directory, with CHARTIFY_AGENT_FQN pointing at your agent.
You'll need a Snowflake connection, configured through Streamlit's connection settings, and an agent you can access. To set one up in a fresh account: run the three SQL files that prepare_backend.py generates (sample tables, submission procedure, validator), deploy the semantic view and agent from cortex_project/, then run one question and inspect the tool calls.
Because the validator runs with owner's rights, meaning it uses the privileges of the role that owns it rather than the caller's, it's written so that the agent's text never becomes part of a SQL statement. Column names go in as bind parameters, the lookup only covers the six demo tables, and the negative-value check for diverging bars uses the Snowpark DataFrame API with names read back from INFORMATION_SCHEMA. A unit test feeds it an injection-style column name to confirm that.
5.2 What the Demo Checks and What It Does Not
The Evaluation tab checks one chart at a time. Here's what the project as a whole has and hasn't verified.
Local Tests and Deployed Browser Checks
Start with the tests: the local suite has 63 passing tests. They cover response parsing, recovery, ordering, styling, evaluation, and the validator procedure, and AppTest, Streamlit's built-in app testing framework, exercises all eleven chart and table types with mocked agent calls.
That covers the app's logic, but it doesn't fully cover the deployed interface. I checked the regional chart in the deployed app in dark theme, and the screenshots in this article come from a local light-theme run against the same agent. Broader chart, theme, and viewport coverage is unverified.
If you extend the app, keep the rules in sync. The deployed agent has its own copy of the instructions, and the app keeps a separate copy for follow-up suggestions and the Best Practice tab. Change one and the other doesn't update.
Separate Query and Rendering Data
Next, the boundary I promised to come back to: where the data comes from.
The agent queries Snowflake tables, while the app draws charts from local sample data, with a fixed mapping per chart type: regional revenue for horizontal bars, weekday signup rates for vertical bars, the top five product lines for stacked bars, and the top three regions for pies.
That keeps the experiment manageable, but it also means Chartify recommends charts and doesn't render arbitrary Analyst results. A general-purpose app would need to carry the selected data, filters, and aggregation all the way to rendering, and verify that they answer the user's question.
Checks That Still Require Human Review
Finally, some things no automated check can catch.
A rule can require a caption, but it can't make the caption accurate. Likewise, a zero baseline won't catch a cherry-picked time window. That's why visual review and source-data review still matter.
Simpler Alternatives and When They're Enough
An agent isn't the only way to get better charts, and it isn't always the right one.
- Plain Python rules, no model. If your questions come from a fixed set of dashboards, a lookup from question type to chart spec is faster, cheaper, and fully predictable. It breaks down when people ask questions you didn't anticipate.
- A single structured model call. This was my first version. It's enough when you already know the column types and ranges and can pass them in. It can't notice that a "variance" column never goes negative.
- Opinionated chart templates. Bake the rules into a reusable Vega-Lite or plotting template (sorted bars, zero baseline, one highlight color) and let people pick the template. You get most of the design benefit without any AI.
I reached for an agent because I wanted it to check its choice against real data before committing. If you don't need that check, start with one of the simpler options.
5.3 Lessons Learned
So what would I tell you if you were starting this tomorrow?
Looking back, almost every problem showed up at a handoff: guidance to rules, rules to recommendation, recommendation to screen. The sorting bug, where the agent was right and the renderer wasn't, is the clearest example.
If you're building something like this, here's what I'd do again, grouped by handoff.
From Guidance to Rules
- Start with one question you know how to chart. Write down the chart type, ordering, and emphasis you expect before building anything. That gives you a fixed answer to test both the recommendation and the rendered chart against.
- Write rules as conditions with exceptions. "Sort categories by value, unless they have a natural order" is something an agent can follow. "Make a good chart" isn't. The weekday exception in rule 2 is what kept Monday through Sunday in order.
- Use fixed cutoffs where judgment would vary. Thresholds like three categories for a pie chart make the agent consistent and easy to test, even if the exact numbers are a matter of taste.
From Rules to the Agent's Recommendation
- Let the agent check its choice against the data. A query tool and a validation step catch proposals that don't fit, like a diverging chart for values that are never negative. This is what separates an agent from a single model call.
- Watch the wording of your test questions. The "top five" request showed that the agent can answer a different question than the one you meant. Name the categories and the denominator.
- Return structured settings, and validate them. A schema describes what the agent should return. Your app still has to reject missing or malformed results and offer a retry, even when the request reports success.
- Expect the answer to vary between runs. Asking the same question twice can come back with a different color scheme, or with
rule_idsas a comma-separated string instead of a list. Table 3 shows recorded results, and the app's validation is what keeps that variation from reaching the chart. - Check which account and role your connection uses. When I ran the app locally, my connection pointed at a different account than the agent, and the agent call failed. The app reported it as
invalid_response, which looked like a parsing bug when it was really a permissions problem. CallingDATA_AGENT_RUNdirectly in SQL showed the real error.
From Recommendation to Screen
- Test the rendered chart, not just the recommendation. Inspect the final chart specification and plotted data, and test in the deployed runtime as well as locally. My
sort=Falsefix passed locally and failed in deployment. - Keep "Not Checked" visible. Some things, like caption accuracy and label overlap, still need a human. Saying so beats reporting a single pass score.
Summary
I started with a simple question: what if I gave my chart decisions to an agent? Chartify is the answer, a Snowflake Cortex Agent that recommends charts from 15 rules and a Streamlit app that draws and checks them. The rules combine my own charting decisions with guidance from data visualization literature. The agent uses tools to query and validate against the data, and returns structured settings with the rules it applied. The app draws the chart and checks what it actually sends to the renderer.
Getting a good recommendation was only the start. The rest of the work was getting it to the screen intact and being honest about what the checks still can't verify.
Want to try it? Grab the companion repository, adapt the rules to your own data and chart types, and test one question end to end before you add more.
Further Reading
Visualization Books and Papers
- Storytelling with Data, Cole Nussbaumer Knaflic (2015)
- ColorWise, Kate Strachnyi (2023)
- Fundamentals of Data Visualization, Claus O. Wilke (2019, available online)
- The Truthful Art, Alberto Cairo (2016)
- The Visual Display of Quantitative Information, Edward Tufte (1983)
- Ten Simple Rules for Better Figures, Rougier, Droettboom, and Bourne (2014, open access)
Agent and Charting Documentation
This content is provided as is, and is not maintained on an ongoing basis. It may be out of date with current Snowflake instances
