Snowflake is a native OTLP destination for Claude telemetry
The majority of coding tokens pass through Claude models. Menlo Ventures' 2026 State of Enterprise AI survey puts Anthropic at 55% of enterprise LLM API spend, up from 40% a year earlier, and reports that agents now generate 80% of the tokens on OpenRouter. Coding is where that spend concentrates. Every one of those requests emits a model, a token count, a latency, a tool call, and often the prompt and the response.
That data describes how your company builds software, and the questions worth asking of it are aggregate ones. What did this cost last week. Which application is driving token growth. Which tool call is always slow.
The Claude API exports spans to Snowflake directly
Anthropic lists the platforms the Claude API exports traces to, and Snowflake is one of them. Select it as a Provider in the Console's OpenTelemetry settings, paste the gateway URL and a token, and the API starts shipping spans:
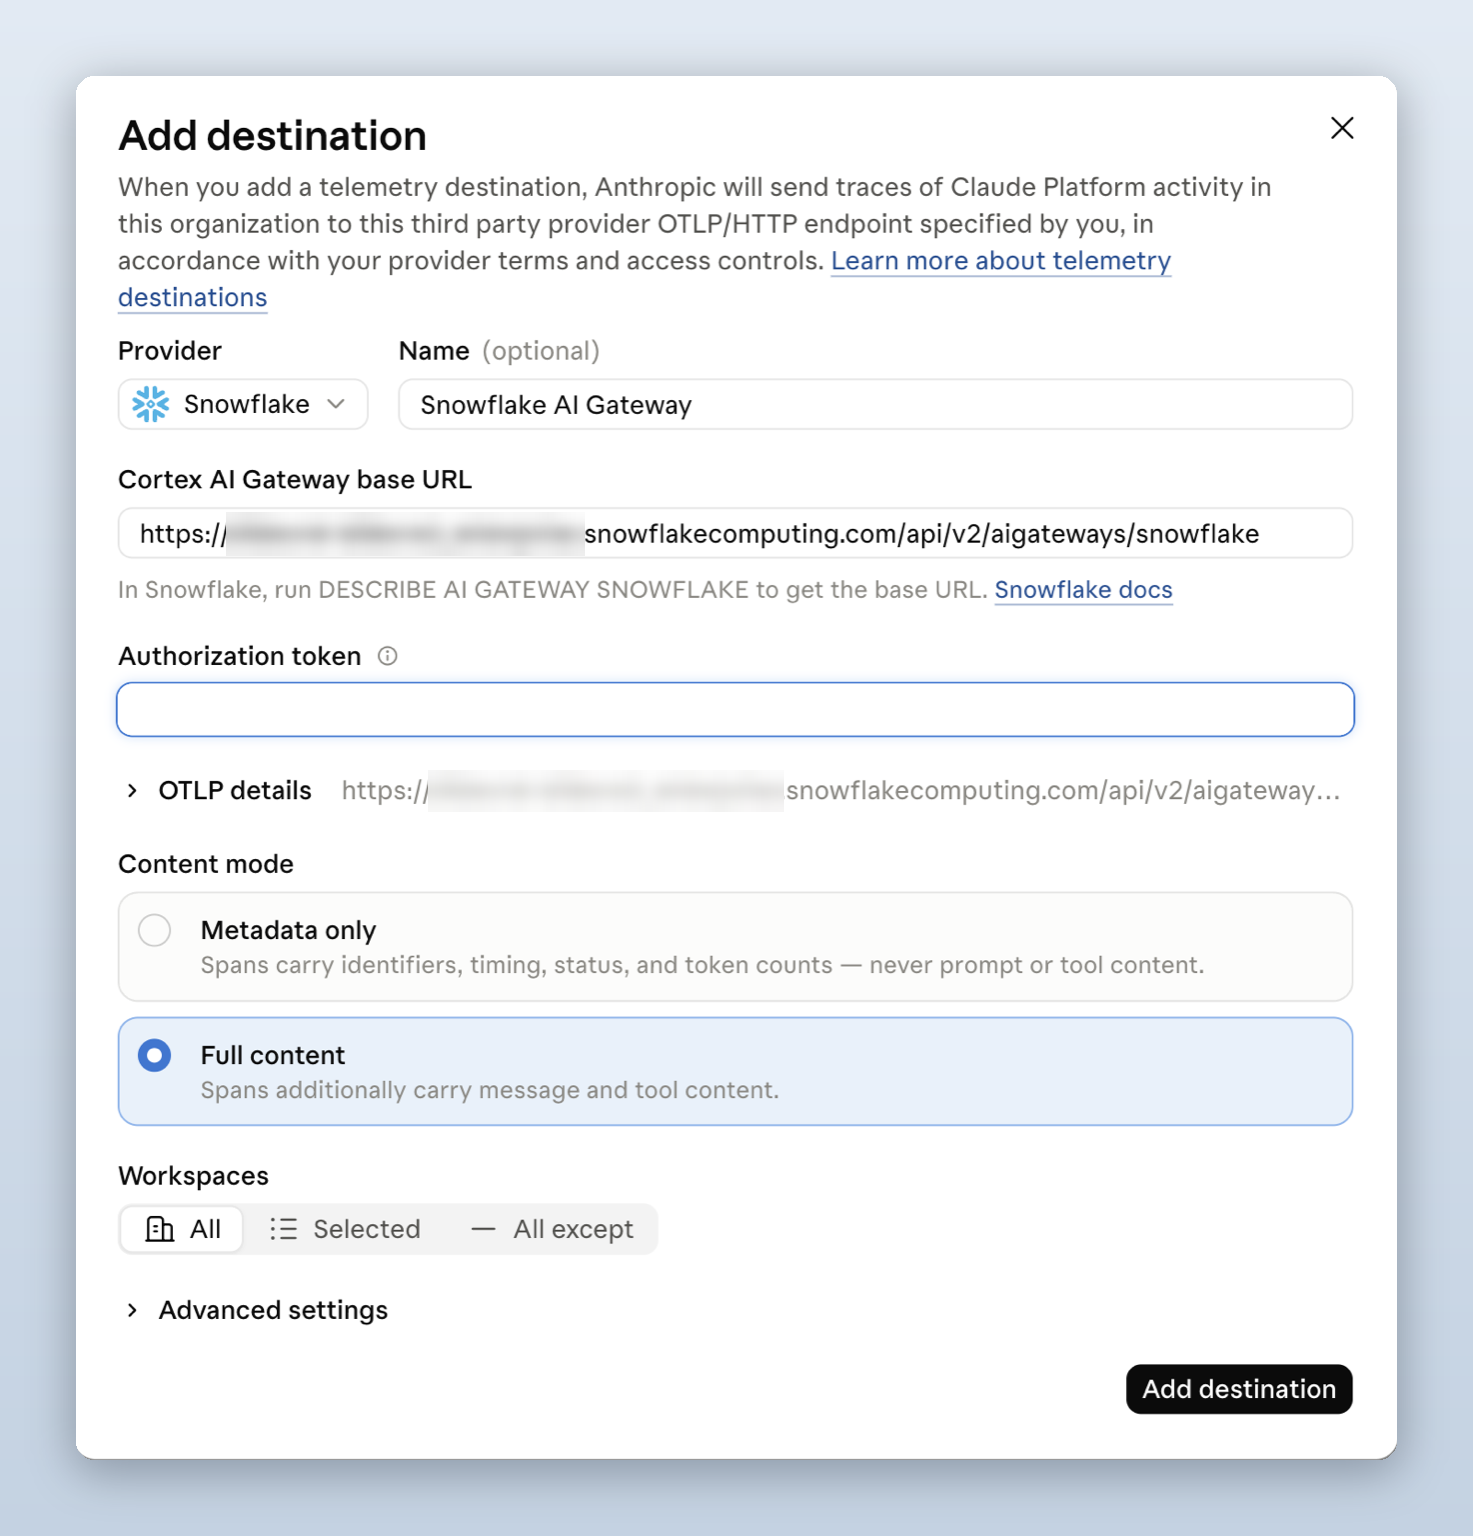
Underneath that form, Cortex AI Gateway is an OTLP server. It takes spans over
http/protobuf or http/json at <gateway-endpoint>/telemetry/v1/traces,
authenticated with the same bearer token used for inference. Those three values
are the whole exporter configuration, and they map to the standard
OTEL_EXPORTER_OTLP_TRACES_* variables. The Claude SDKs, Claude Code, and
harnesses like OpenCode point at the same endpoint.
Claude's spans use the
GenAI semantic conventions
and arrive with those attribute names intact: gen_ai.request.model,
gen_ai.usage.input_tokens, gen_ai.tool.name.
Two switches control what gets recorded. Client telemetry has to be enabled in the gateway specification, which is off by default. Message content is captured only when the destination's content mode and the gateway's payload capture agree. The steps are in Trace Claude requests.
Note: A programmatic access token only works for a user subject to a network policy, so the policy has to admit Anthropic's egress addresses or spans are rejected before reaching the gateway. After saving the destination, More actions → Test sends a test span; the Delivery field reads
No datauntil spans flow.
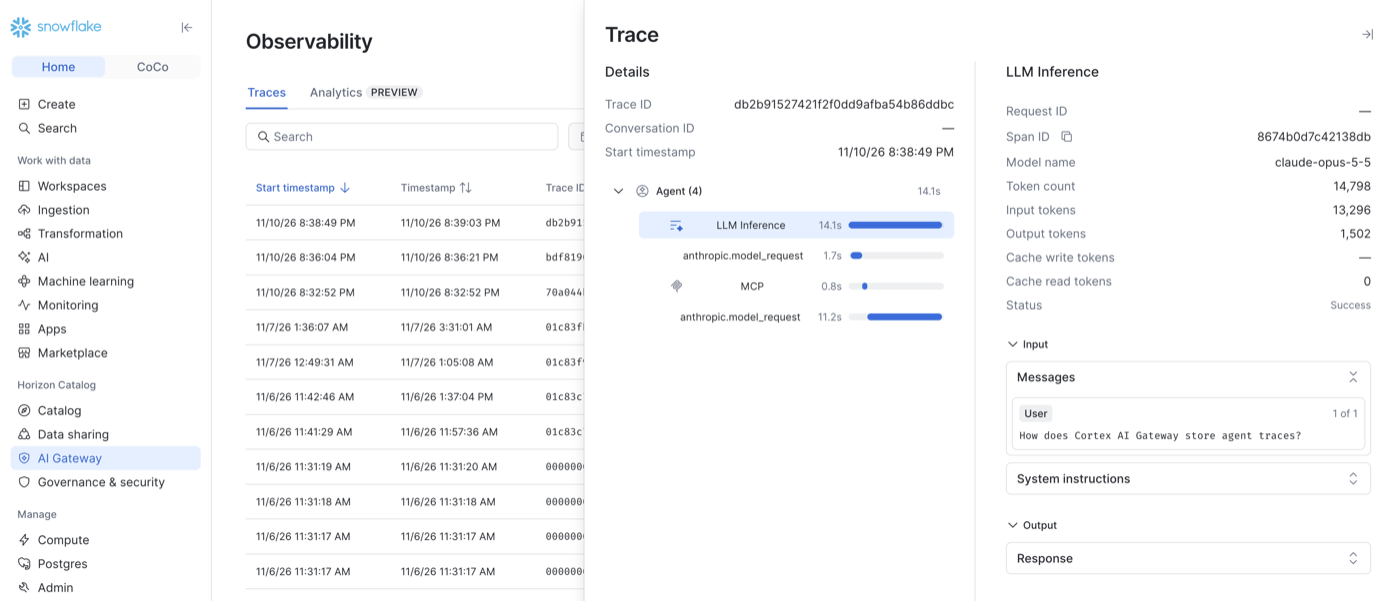
What the API records goes beyond what a client can see. It runs server tools itself and emits a span for each one, so a request that searches the web arrives as a tree: the request, each model run inside it, and the tool call between them.
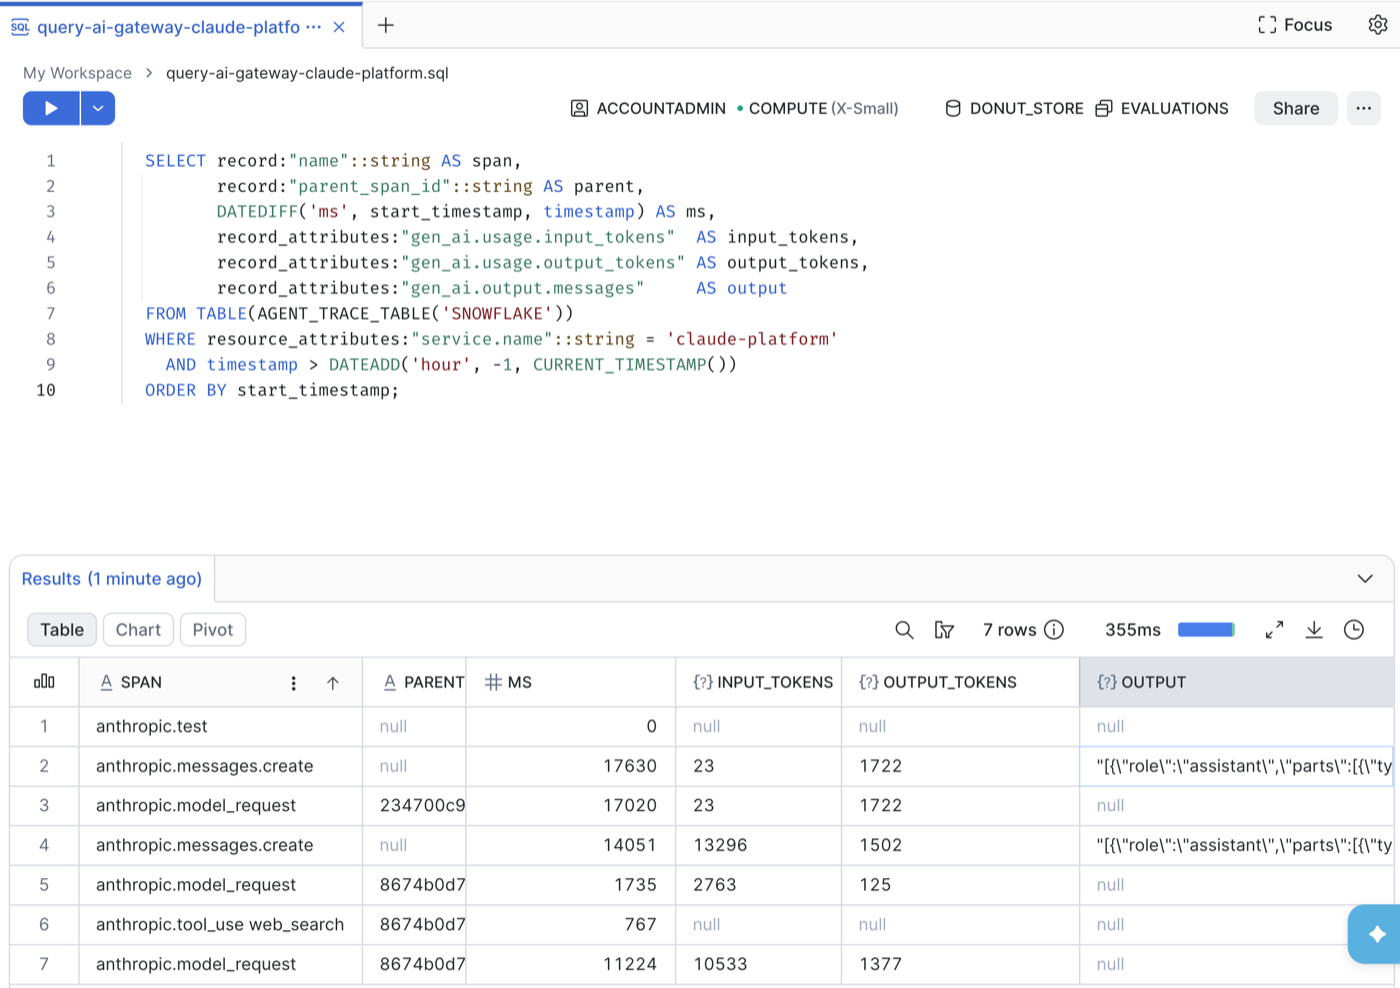
Snowsight renders the same spans as a waterfall under AI Gateway → Observability, reading the prompts and responses from the content attributes:
Querying traces in aggregate with SQL
A waterfall answers questions about one request. Aggregates over the table answer the rest.
Spans are deeply nested and a trace is many rows, so a view does the casting once:
CREATE OR REPLACE VIEW claude_spans AS
SELECT trace:"trace_id"::string                               AS trace_id,
       record:"parent_span_id"::string                        AS parent_span_id,
       record:"name"::string                                  AS span_name,
       resource_attributes:"service.name"::string             AS service_name,
       record_attributes:"gen_ai.request.model"::string       AS model,
       record_attributes:"gen_ai.usage.input_tokens"::number  AS input_tokens,
       record_attributes:"gen_ai.usage.output_tokens"::number AS output_tokens,
       record_attributes:"gen_ai.input.messages"::string      AS input_messages,
       record_attributes:"gen_ai.output.messages"::string     AS output_messages,
       start_timestamp                                        AS started_at,
       DATEDIFF('ms', start_timestamp, timestamp)             AS duration_ms
FROM TABLE(AGENT_TRACE_TABLE('SNOWFLAKE'));
Every trace in the last week that used a tool, with its model calls and token count:
SELECT trace_id,
       MAX(duration_ms)                                             AS total_ms,
       SUM(IFF(span_name LIKE 'anthropic.tool_use%', 1, 0))         AS tool_calls,
       SUM(IFF(span_name = 'anthropic.model_request', 1, 0))        AS model_calls,
       SUM(IFF(span_name = 'anthropic.model_request', input_tokens, 0)) AS input_tokens
FROM claude_spans
WHERE service_name = 'claude-platform'
  AND started_at > DATEADD('day', -7, CURRENT_TIMESTAMP())
GROUP BY trace_id
HAVING tool_calls > 0
ORDER BY input_tokens DESC;
On real traffic that finds the expensive agent turns. Changing the HAVING
clause asks a different question.
Prompts and responses are searchable in place. SEARCH does full-text matching over text and over fields inside VARIANT columns:
SELECT trace_id, span_name, duration_ms
FROM claude_spans
WHERE service_name = 'claude-platform'
  AND SEARCH(output_messages, 'web_search', search_mode => 'OR');
When text volume makes that slow, FULL_TEXT search optimization builds a search access path for those columns, VARIANT included.
Eval scores land in the same table, because an eval harness is another OTLP
client. Pointing an evaluation run's span exporter at the same
/telemetry/v1/traces endpoint writes eval spans into AGENT_TRACE_TABLE beside
the executions they score. With TruLens, carrying the scored record's id on the
eval span makes the score and the execution join on one key.
With scores and spans in one table, "which turns scored badly and cost the most tokens" is a join. So is attribution: the spans join to whatever table says which team owns which application, under RBAC on objects already administered, with the retention and cost model of any other event table. Schedule the query as a task, alert on it, or materialize a daily rollup.
Note: Token counts repeat across levels of the hierarchy, so filter to one span name before summing or the totals double-count. Per-span credits aren't in this table; for billed usage see AI_GATEWAY_USAGE_HISTORY.
Limits, sensitive content, and beta status
Payload capture stores everything users sent, so with it on, the event table is
as sensitive as the conversations themselves. capture_payload.exclude_tags
keeps specific users out of it.
Claude API spans carry no resource_attributes:user, because the API sent them
rather than a Snowflake user. A trace query filtered by user drops them with no
error. Anthropic's OpenTelemetry export is in beta and the Snowsight trace
analytics charts are in Preview. The event table underneath is ordinary.
A span table holds timing, tokens, and text. Nothing in it distinguishes a correct response from a confident wrong one, which still takes evaluation tooling and human judgment. The same endpoint takes client-side spans, which is how the retry, the queue wait, and an application's own tool calls reach the same table. For a coding harness that's two environment variables, covered in Add telemetry to your agent harness.
This content is provided as is, and is not maintained on an ongoing basis. It may be out of date with current Snowflake instances
