Add telemetry to your agent harness
Your team works in coding agents and agentic IDEs first, whether it is Claude Code, Snowflake CoCo, or Cursor. These are long running, often token heavy, and hard to debug when something goes wrong. It is often daunting to understand how well you are using these tools and if you are using them efficiently.
Telemetry, in the form of traces, helps you to understand exactly what your agents are doing by connecting model inference, tool calls, and reasoning steps in one place. Once you have the traces consolidated, you can ask questions like:
- Which agent tools are causing a latency bottleneck?
- What models are most commonly used by your agents?
- What is the cost of a typical coding agent session?
- How much do my coding agents utilize caching, and are there opportunities for improvement?
Answering these questions requires more than instrumenting individual agents or harnesses independently. To answer these questions comprehensively, we want a single observability control plane where you can analyze agents across the many tools, models and sessions with consistent and standardized telemetry.
An AI Gateway provides a common interception point for that control plane. By routing model traffic through the gateway with logging enabled, it provides automatic server-side visibility into every inference request, and can enrich it with client-side spans from the agent harness to reconstruct the full session.

Both sides in the same table means you can answer questions that neither side alone can: why did this session cost four times more than usual, which specific Bash command consumed 60% of the agent's time, and whether provisioned throughput is faster for your workload. Once the spans are in the table, then you have the full picture of what is happening and how to debug.
The rest of the blog walks through the simple steps to make this happen in an example using Claude Code as the coding agent and Cortex AI Gateway, in preview, as the control plane.
A recipe to land your Claude Code traces in Snowflake
I start with:
- A Snowflake account with Cortex AI Gateway enabled
- Claude Code installed (
npm install -g @anthropic-ai/claude-codeor the Claude Code Desktop app) - A Programmatic Access Token (PAT) for your Snowflake account
You'll also need these permissions turned on in your account:
To modify the gateway: MODIFY on the gateway object (SYSADMIN covers both). To query AGENT_TRACE_TABLE: MONITOR privilege on the gateway.
Once the gateway is created, you need to make sure the ENABLE_CLIENT_TELEMETRY flag is set to TRUE on the gateway which is off by default. You can also optionally turn on payload capture.
ALTER AI GATEWAY snowflake FROM SPECIFICATION $$
models:
  - name: '*'
logging:
  enabled: true
  enable_client_telemetry: true
  capture_payload:
    request_response: true
$$
And you can verify the gateway has the expected settings:
DESCRIBE AI GATEWAY snowflake;
Route your agent telemetry to the gateway
First, find your telemetry endpoint.
The telemetry endpoint path is:
<GATEWAY_BASE_URL>/telemetry/v1/traces
Get your gateway's base URL from SHOW AI GATEWAYS. It looks like:
https://myaccount.snowflakecomputing.com/api/v2/aigateways/snowflake
So your telemetry endpoint is:
https://myaccount.snowflakecomputing.com/api/v2/aigateways/snowflake/telemetry/v1/traces
Then, update your Claude Code settings to route through the telemetry endpoint by updating ~/.claude/settings.json. Replace YOUR_PAT.
{
  "env": {
    "ANTHROPIC_BASE_URL": "https://myaccount.snowflakecomputing.com/api/v2/aigateways/snowflake",
    "ANTHROPIC_AUTH_TOKEN": "<YOUR_PAT>",
    "ANTHROPIC_MODEL": "claude-opus-4-5",
    "ANTHROPIC_SMALL_FAST_MODEL": "claude-haiku-4-5",
    "CLAUDE_CODE_ENABLE_TELEMETRY": "1",
    "CLAUDE_CODE_ENHANCED_TELEMETRY_BETA": "1",
    "OTEL_TRACES_EXPORTER": "otlp",
    "OTEL_EXPORTER_OTLP_TRACES_PROTOCOL": "http/protobuf",
    "OTEL_EXPORTER_OTLP_TRACES_ENDPOINT": "https://myaccount.snowflakecomputing.com/api/v2/aigateways/snowflake/telemetry/v1/traces",
    "OTEL_EXPORTER_OTLP_TRACES_HEADERS": "Authorization=Bearer <YOUR_PAT>",
    "OTEL_SERVICE_NAME": "claude-code"
  }
}
Launch Claude and run any task. Spans are sent at the end of each interaction turn, not in real-time, so you need at least one complete turn before anything appears.
In Snowsight, open a new SQL workspace and run the following query that will query Claude Code traces from the AGENT_TRACE_TABLE.
SELECT
  MIN(start_timestamp) AS earliest,
  MAX(start_timestamp) AS latest,
  COUNT(*) AS total_client_spans,
  COUNT_IF(record:name::string = 'claude_code.llm_request') AS llm_spans,
  COUNT_IF(record:name::string = 'claude_code.tool') AS tool_spans,
  COUNT_IF(record:name::string = 'claude_code.interaction') AS interaction_spans
FROM TABLE(AGENT_TRACE_TABLE('snowflake'))
WHERE resource_attributes['service.name']::string = 'claude-code'
  AND start_timestamp > DATEADD('hour', -1, CURRENT_TIMESTAMP());
Rows confirm client spans are landing.
Analyze your traces
The quickest way to look at a single session is the Observability page in Snowsight, under AI & ML » AI Gateway » Observability. It lists every trace the gateway recorded, and selecting one opens the span tree for that turn.
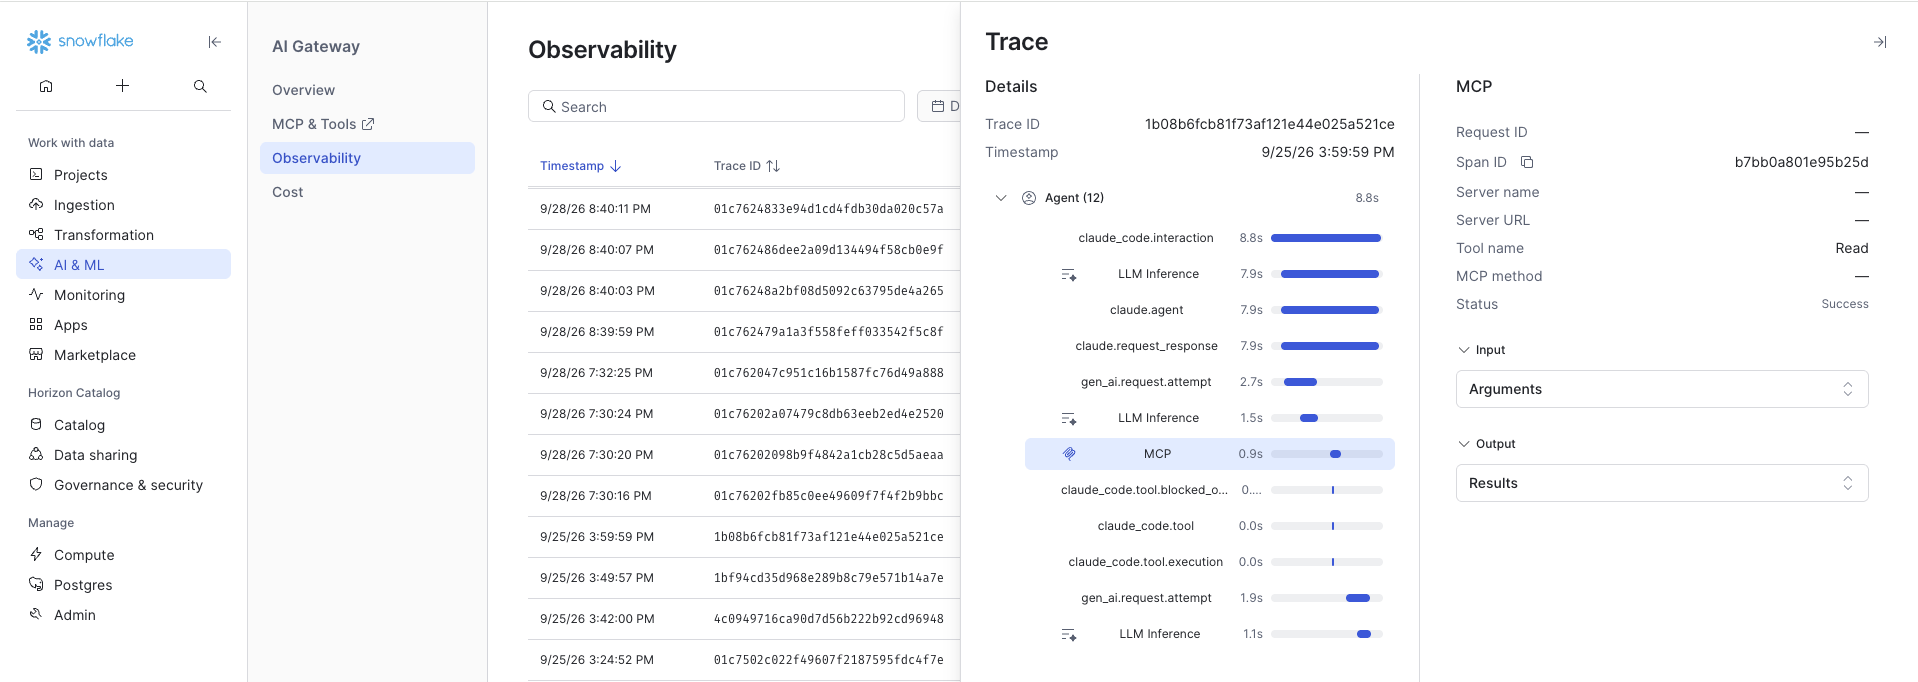
The client spans Claude Code exported, like claude_code.interaction, claude_code.tool, and claude_code.tool.execution, sit in the same tree as the gateway's server-side LLM Inference spans. You can read the turn top to bottom: the model calls, the Read tool call Claude Code made between them, and how long each one took. The panel on the right shows the details of the selected span.
That view works one turn at a time. To find patterns across sessions, query the same spans with SQL.
With both server and client spans in the same table, you can start with attribution to understand what models and tools are being used, dig into long running sessions, and get a clear picture of the cost of your agents.
Consider an agent editing files and running validation after each change. The full_command attribute in claude_code.tool spans tells you exactly what ran. If you cluster spans by command across sessions, you can see whether the same validation step is running after every edit instead of once at the end. Then, you can test an update to the system prompt and validate with telemetry in the gateway.
As a second example, you can take the same approach to improve caching; cache_read_tokens are captured on model inference server spans so you can catch if you are invalidating the cache. If hit rate is low from turn one, look for non-deterministic content near the start of the context: timestamps, current directory, git state, or anything injected by the harness that differs between requests. If hit rate starts high and drops over a long session, the context has grown past the cached prefix and compaction helps. In both cases, the trace data provided from both client and server telemetry in the gateway gives you enough to diagnose the problem and verify improvement.
Where to go next with agent traces
Cortex AI Gateway is Snowflake's control plane for agent traffic. Whether the caller is a Snowflake-native agent, a Claude Code session, or an SDK client, every model request routes through a single governed layer; one place for access policy, cost attribution, and model routing.
This content is provided as is, and is not maintained on an ongoing basis. It may be out of date with current Snowflake instances
