Sep 29, 2026/5 min readProduct and Technology
Beyond Incident Response: Turning OpenTelemetry into an Enterprise Data Asset


One of the most interesting shifts I've seen working with customers at Snowflake is the evolution of our conversations about observability.
A few years ago, engineering leaders were focused on instrumentation and visibility: How do we collect more telemetry? How do we reduce mean time to resolution? How do we gain better visibility into increasingly complex systems?
Today, OpenTelemetry and modern observability platforms such as Observe by Snowflake are making many of these questions easier to answer. Observability conversations can now start with business metrics and outcomes, not logs, metrics and traces. The goal is no longer just to understand what's happening in distributed systems but to connect technical data to what it means for the business.
That shift raises a set of practical questions for engineering teams:
- How long should we retain telemetry?
- How do we connect operational data with customer and business data?
- How can telemetry support analytics and AI?
- How do we ensure observability data remains open and under our control?
These questions are not theoretical. They emerge as soon as an incident's technical impact becomes a question of customer churn, revenue and business impact.
Observability doesn't end when the incident ends
Consider a hypothetical large financial services company serving millions of customers. Like many digital businesses, even a few minutes of degraded performance can affect customer experience, increase support volume and put revenue at risk.
During a production incident, the engineering team noticed elevated latency in a customer-facing payment service. Initially, it was unclear where the issue originated: in the application, in an upstream dependency or in the underlying infrastructure. The team had no immediate way to determine which customers or transactions were being affected.
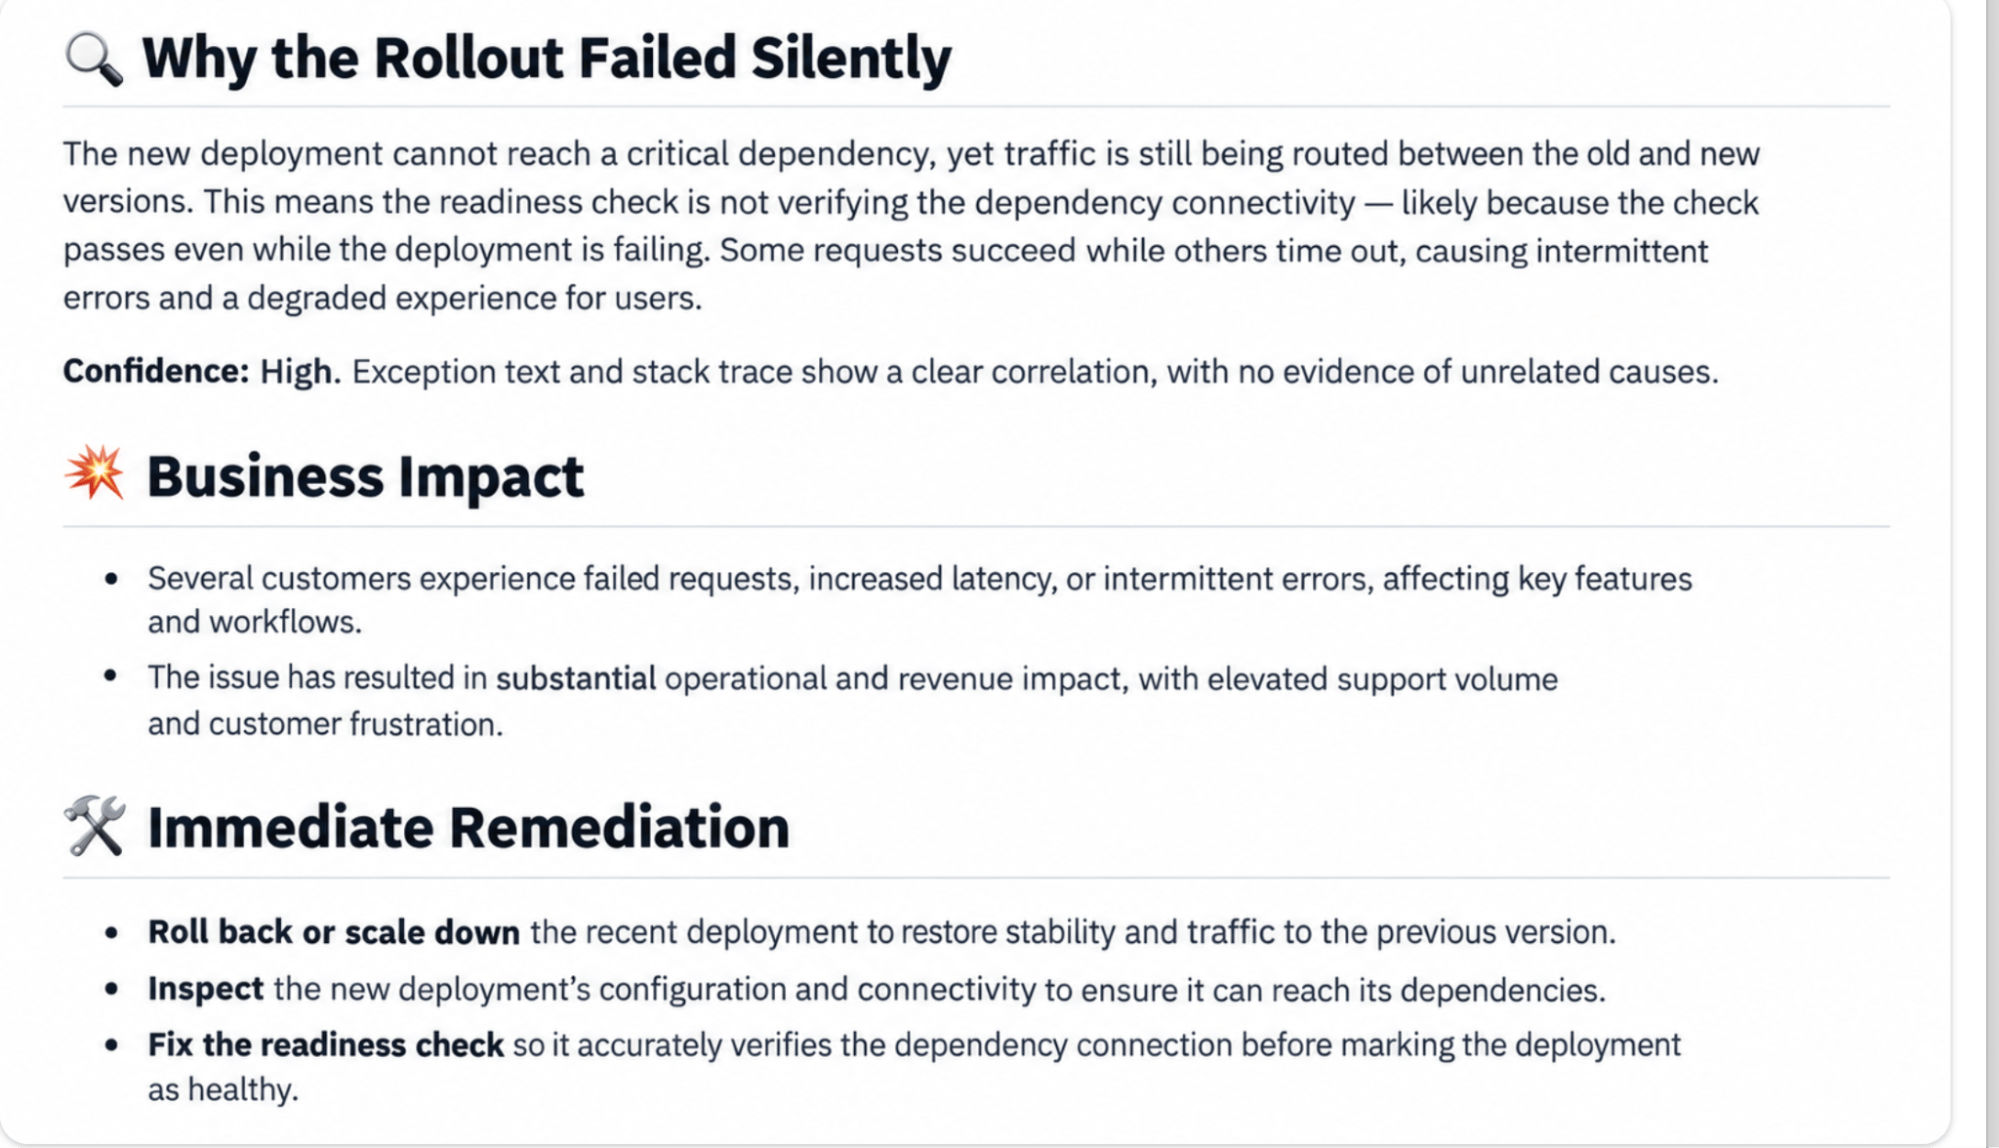
The team used Observe's Observability Context Graph and AI site reliability engineering (AI SRE), engineers unified disparate telemetry streams to isolate the malfunctioning component, mapped its downstream effects through complex dependencies and brought the environment back to a healthy state.
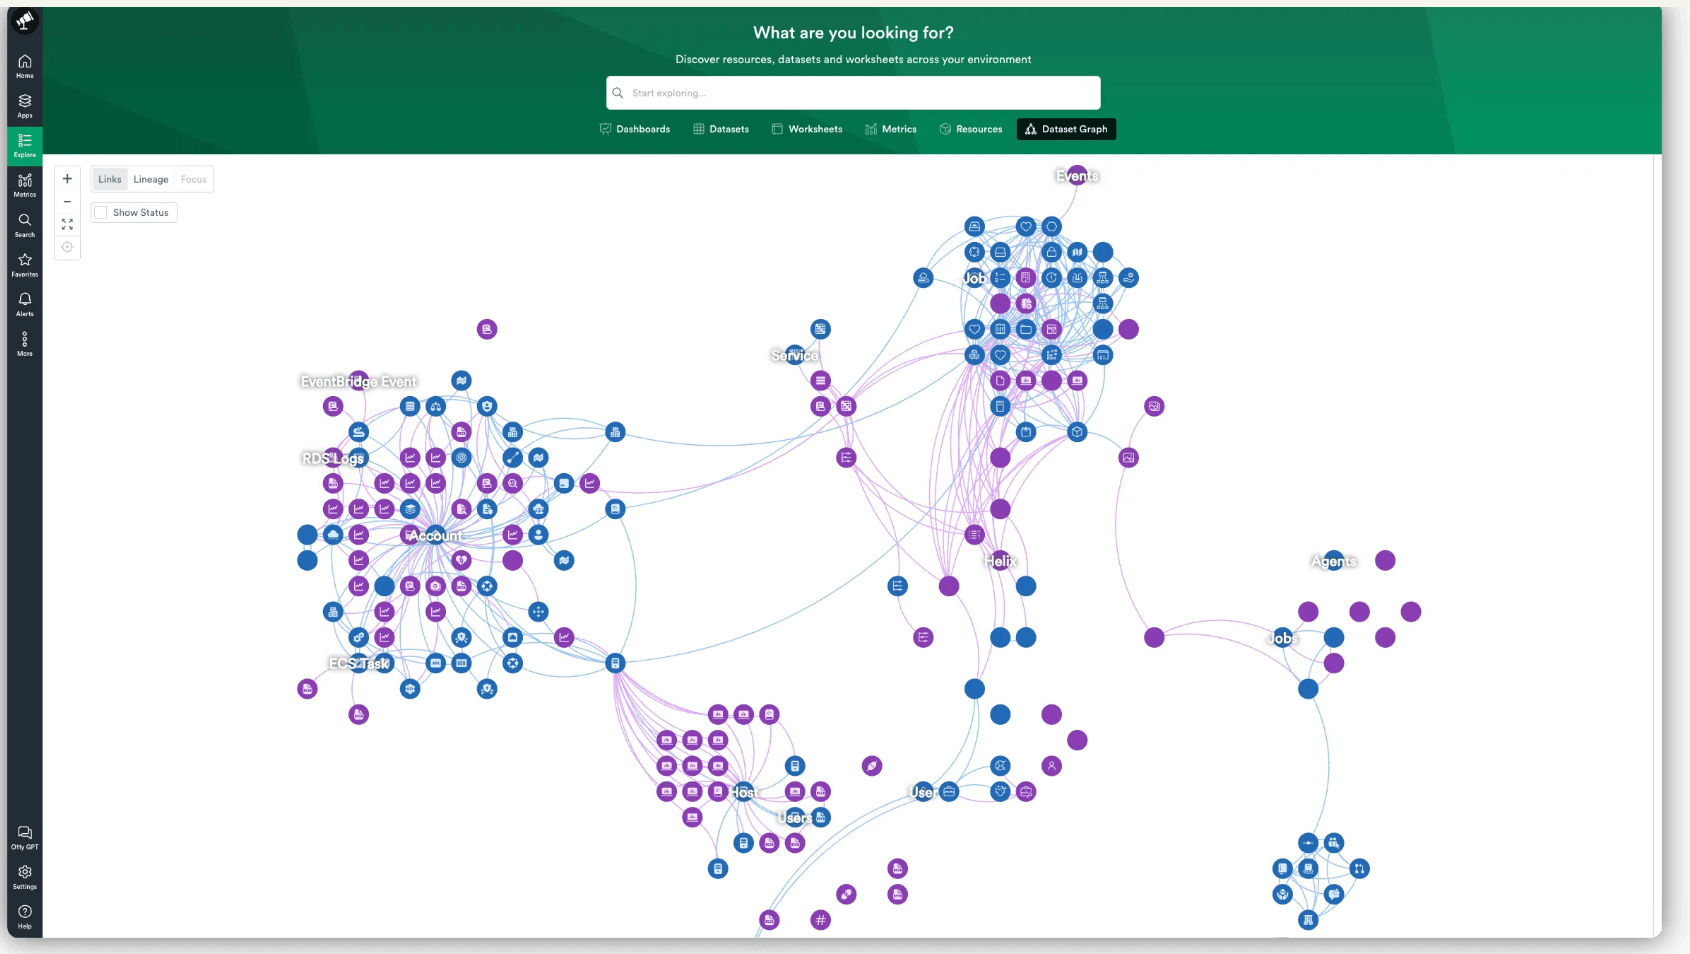
Operationally, the incident was over. But strategically, it was just beginning.
The engineering team had answered "What broke?" The executive team, however, immediately began asking follow-up questions:
- What was the customer impact?
- How much revenue was at risk?
- Were certain payment providers affected more than others?
Is this an isolated incident or the start of a broader reliability trend?
Getting the answers required combining operational telemetry with customer accounts, payment transactions, deployment history and product usage. At this point, observability stopped being only an operational problem and became a data problem.
From root cause to business impact
Enriching operational telemetry with customer, product and financial context gave the financial organization's engineering and business leaders a shared view of the incident's impact. Rather than stopping at root cause analysis, the team could quantify the impact on its customers, estimate revenue at risk and prioritize remediation based on business outcomes.
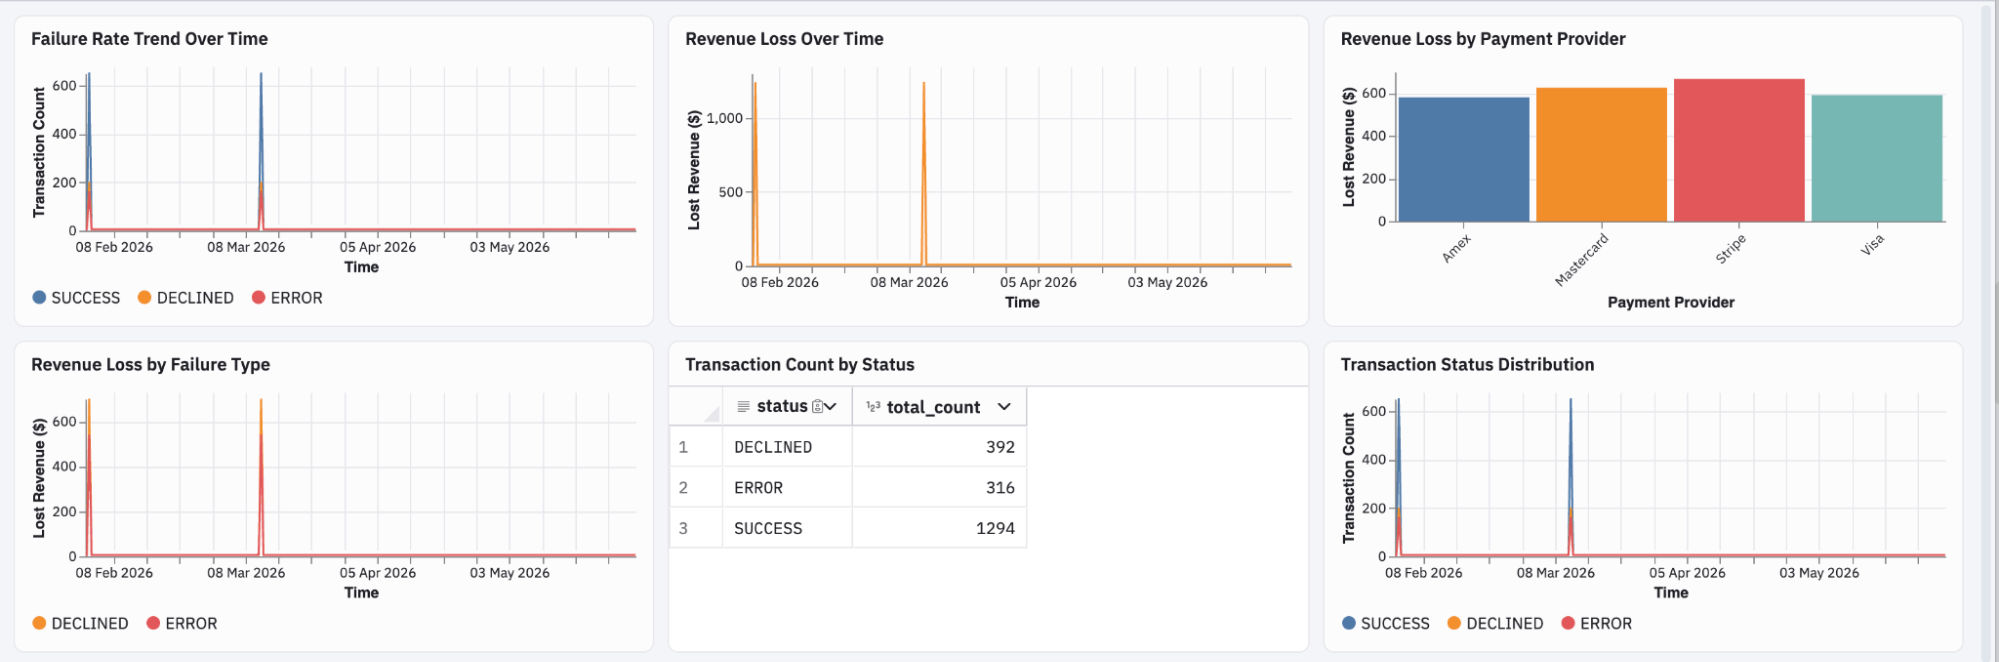
This is the broader application of observability: The same data that helps engineers restore production can also help leaders understand customer impact, identify long-term reliability trends, improve engineering decisions and power AI.
Instead of asking only what failed, organizations can understand what the impact is. Once telemetry is connected to business context, incident response becomes the starting point of analysis, not the endpoint. The next question is how to retain, govern and reuse observability data across analytics, AI and operational workflows.
Why open observability matters
As engineering organizations mature their observability practices, they are discovering that telemetry has value far beyond the incident window. Logs, metrics and traces are becoming long-lived enterprise assets: data that should be retained, governed and enriched alongside customer, product and business data.
This is where open observability comes into focus. The OpenTelemetry standard provides a consistent, vendor-neutral way to instrument applications. Open technologies such as Apache Iceberg™ are changing how organizations store and manage enterprise data by separating storage from compute and enabling interoperability across multiple engines. Learn more about Observe on Apache Iceberg (currently in private preview.
Together, these technologies create a foundation where telemetry doesn't have to live exclusively inside an operational platform. Organizations can retain it as an open data set they control — one that can be governed consistently, analyzed alongside enterprise data, and used across analytics, AI and operational workflows.
How Snowflake and Observe complement each other
The question I hear most often from engineering leaders is how their observability platform and data platform should work together. The answer becomes clear when we look closely at the incident lifecycle.
One misconception is that bringing telemetry into Snowflake replaces an observability platform. What I have seen in the field is that customers generally see them as complementary, not exclusionary.
When engineers respond to an incident, they need operational workflows that bring data and context together to quickly understand and resolve issues. Snowflake provides the data foundation, while Observe adds purpose-built observability workflows, AI SRE and the Observability Context Graph to connect logs, metrics, traces and infrastructure relationships — helping teams move from data to actionable context and restore service faster.
Post-incident analysis is a different challenge. Teams need to connect telemetry with customer and financial data to identify long-term trends. Once telemetry data is in the Snowflake AI Data Cloud, it can be enriched and analyzed as a strategic enterprise asset.
As AI becomes central to engineering workflows, having telemetry alongside enterprise data allows teams to identify patterns and anomalies that would be difficult to find in disconnected systems.
During an incident: Purpose-built observability with Observe
When production is degraded, engineers need answers immediately. Purpose-built observability platforms such as Observe are designed for that operational workflow. AI SRE helps teams investigate incidents, surface anomalies and summarize insights, while the context graph connects applications, infrastructure, logs, metrics and traces into a unified view of the system.
Together, these capabilities give engineers the context they need to understand what happened and restore service as quickly as possible.

After the incident: Enterprise context through Snowflake
Once service is restored, the same telemetry can be connected with customer, transaction, financial, product and deployment data. Teams can use that broader context to quantify business impact, identify recurring patterns and prioritize reliability investments.
This is where Snowflake extends observability's value. Telemetry can be retained and analyzed alongside the rest of the enterprise, supporting governed analytics and AI without separating technical data from the business context needed to interpret it.
Snowflake and Observe are complementary by design
Observe provides operational intelligence for real-time incident resolution. Snowflake extends the value of telemetry as an open, governed asset for long-term analysis and AI. Together, they are designed to support the full lifecycle of observability:
- Instrument and collect signals with open standards
- Investigate incidents with fast, contextual operational workflows
- Connect telemetry with business data to quantify impact
- Retain and govern the resulting data for analytics, reliability engineering and AI
The goal is not to choose between an observability platform and a data platform. It is to connect the platform that engineers use during an incident with the data the enterprise uses after it.
Continue the observability conversation
Telemetry is no longer just operational data — it is enterprise data. When organizations treat it as such, they move beyond incident response and can begin learning continuously from their systems.
How is your organization thinking about this evolution? How are you connecting operational telemetry with the rest of your enterprise data? And how could a more open, governed approach help your teams turn reliability signals into business insight?
Learn more about Observe by Snowflake or reach out to us at snowflake.com/en/product/observe/contact/.
Disclosures
This article contains forward-looking statements, including about our future product offerings, and are not commitments to deliver any product offerings. Actual results and offerings may differ and are subject to known and unknown risk and uncertainties. See our latest 10-Q for more information.
Jul 30, 2026Product and Technology
Unlocking Open Observability with Observe on Apache Iceberg

Sep 8, 2026Core Platform
The OpenTelemetry Collector is your open source data pipeline

May 5, 2026Observability
Observe by Snowflake: Observability Meets the AI Data Cloud