Sep 8, 2026/9 min readCore Platform
The OpenTelemetry Collector is your open source data pipeline


The OpenTelemetry (OTel) Collector does what your proprietary telemetry pipeline does. Routing, filtering, transformation and publishing to multiple backends, all as configuration with no license attached. It also puts your governance controls inside your own environment, so PII is redacted and sovereignty is enforced before anything leaves, with the config itself as your evidence. You get that on the open standard your backends already speak, without a specialized tool in the path of your most sensitive data.
The OpenTelemetry Collector is your open source data pipeline
Telemetry pipelines are now a standard line item in the observability budget. The pitch is familiar to every engineering team. Agents ship everything to a centralized node, which then routes, filters, transforms and forwards your telemetry. You decide what data a backend will see, so cost and compliance stay under your control.
It is a good pattern and for a long time it described real functionality that open source couldn't match, leaving only costly proprietary offerings. That is no longer the case. The OpenTelemetry Collector, a vendor-neutral application that collects, processes and exports telemetry data, does all this natively as simple configuration with no license attached.
What a telemetry pipeline is actually for
Looking at telemetry pipelines, there are four core functions that are the primary drivers for adoption of such a setup.
Routing: Whether for compliance, diverse observability solutions or varied use cases, you want to send your telemetry to the right destinations. This may mean sending metrics, traces and logs to your observability platform, while sending archival or compliance data to an S3 bucket.
Filtering: Core to realizing value is ensuring you're keeping the data that is useful, dropping any noise before it's ingested into your platforms. This could include health check spans, debug logs from a chatty service, disused metrics or duplicate infrastructure telemetry from overlapping agents.
Transformation: Be it to redact, enrich or reshape fields in flight, you can support your compliance needs, contextual enrichment and any business-specific requirements through this stage. Often this looks like normalizing inconsistent attribute names, attaching environment metadata, removing sensitive PII values, and adding organizational and CMDB attribution.
Forwarding: When your data needs to reach multiple backends, such as during a migration or for retention obligations, you can route one telemetry stream to several destinations at once. Often this exists where your data caters to multiple business use cases, with a full-fidelity copy to cheap object storage for compliance and general reporting, and a filtered copy to the platform your engineers query frequently.
The OpenTelemetry Collector as your pipeline
By diving into your core telemetry pipeline functions and use cases, you can start to understand how the OpenTelemetry Collector fits into the picture. You can address each of the four primary functions through OpenTelemetry Collector components with only configuration. No custom code or bespoke extensions are required to achieve this today.
Routing is achieved through the routing connector. Your conditions are defined and operate at the individual metric, log or span level, as broad or granular as needed. Each matched stream is handed to its own pipeline, with its own exporters and processors. This gives you pathways to differentiate data, flow through your pipeline and egress as needed.
Filtering leverages the filter processor. Conditions are written in OpenTelemetry Transformation Language (OTTL). It drops matching data as it reads it, before it reaches an exporter. For traces, the tail sampling processor can make decisions once it has assembled the full trace. You can compose policies to keep errors and slow requests while sampling healthy traffic at a low probabilistic rate, retaining a statistically useful baseline without sending every trace to your telemetry backend.
Transformation uses the transform processor, also driven by OTTL conditions. You can rename, set, delete, hash, parse and convert data in your telemetry payloads, whether this be for the purpose of enrichment, standardization, or redactions and compliance, across metrics, traces and logs. When coupled with a routing processor, you can achieve low-level situational-based transformations of your data to meet differing teams' and backend-specific requirements.
Forwarding here is a part of the native OpenTelemetry Collector configuration architecture. Pipelines define your inputs, filters, transforms or other processors, and the corresponding exporters for your various data backends. These backends typically speak OpenTelemetry Protocol (OTLP), though support exists for a variety of industry standards, including AWS S3.
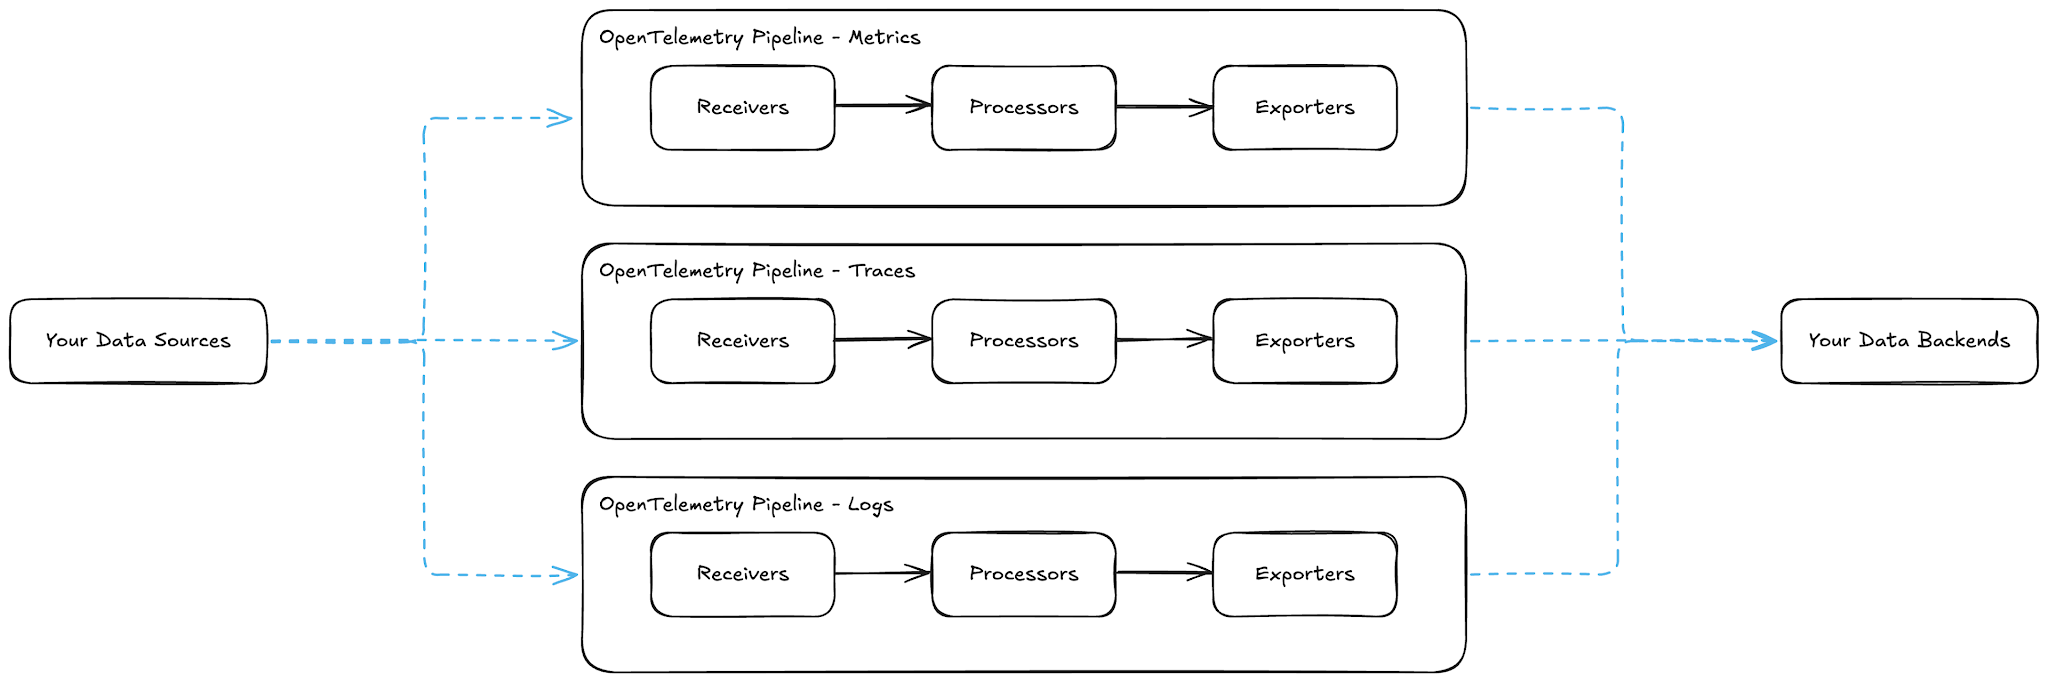
The OpenTelemetry Collector, once all four of these functions are configured to align with a considered design of what you collect, keep and discard, now operates as your own open source telemetry pipeline.
Operating the OpenTelemetry pipeline at scale
As you take your pipeline design to production, two operational considerations arise, focusing on operational stability. Both are configuration you own, and you can adjust them as needed. These are platform resiliency and scalability.
By default, your collector's exporter queue lives in memory, so a restart loses whatever is in flight. The file storage extension backs that queue with disk, so the collector can resume where it stopped, providing the equivalent functionality of the disk-backed buffering commercial pipelines advertise.
When tackling dynamic load patterns, collectors must be able to operate under that load. The collector provides two primary configurations to alleviate pressure within your environment.
In the first configuration, you can run collectors in an agent-style setup, where they sit close to your source applications. This provides buffering and lower load volumes per collector, often in setups such as a Kubernetes sidecar or a monolithic host. Typically this is labeled as an agent configuration.
Your second configuration exists to handle your organization's complete telemetry volume. The collectors provide support for Horizontal Pod Autoscaling (HPA), ensuring that you can scale both up and down, as telemetry load fluctuates throughout the day. This exists as the gateway pattern, and is the predominant location for your organization's company-wide telemetry data controls and handling.
Supporting governance requirements in your pipeline
Governance is often a strong requirement, and a key component of a telemetry pipeline. The focus here is that all data that leaves your environment has already been scrutinized and correctly handled to support your regulatory and organizational requirements. The OpenTelemetry Collector addresses this directly, supporting both agent and gateway patterns, all operating within your environment.
A common requirement is addressing personally identifiable information (PII) redaction and field masking. The collector leverages the redaction processor to block or mask attribute values by pattern. This can be extended using the transform processor you explored earlier to hash or truncate values you want to keep in a non-identifying form. A value redacted at collection is not forwarded to your backends, which means there is no deletion path to build and no backend retention setting to trust.
Given collectors run where your workloads run, data residency and sovereignty sit inside your own environment. Telemetry from a sovereign service can be filtered, transformed and routed to a sovereign destination, without transiting infrastructure in another jurisdiction.
In support of regulatory compliance programs such as HIPAA, SOC 2 and GDPR, you can demonstrate that enforcement occurs before data egress, with your governance policy configuration serving as auditable evidence, plus the absence of telemetry data and attributes in your data stores. This removes the need to work around a third party's retention policy.
Where Observe by Snowflake® fits into your telemetry pipeline
A telemetry pipeline is only as useful as the platform at the end of it. For observability tooling, this is your OTLP-compatible backend.
Observe by Snowflake is OTel-native and accepts OTLP directly. You can point your OTLP exporter at Observe and the data lands in its original shape — resource and scope attributes intact. No need for a proprietary agent, no format conversion and no schema to declare up front.
Observe applies schema on demand, so you can shape and reshape telemetry after ingestion, rather than committing at collection time to the questions you will later want to ask. That suits a collector-driven pipeline. The collector enforces what must never leave your infrastructure, with everything that does leave staying open to further shaping later. Filtering therefore becomes a decision about cost and governance, not a guess at tomorrow's investigations and use cases.
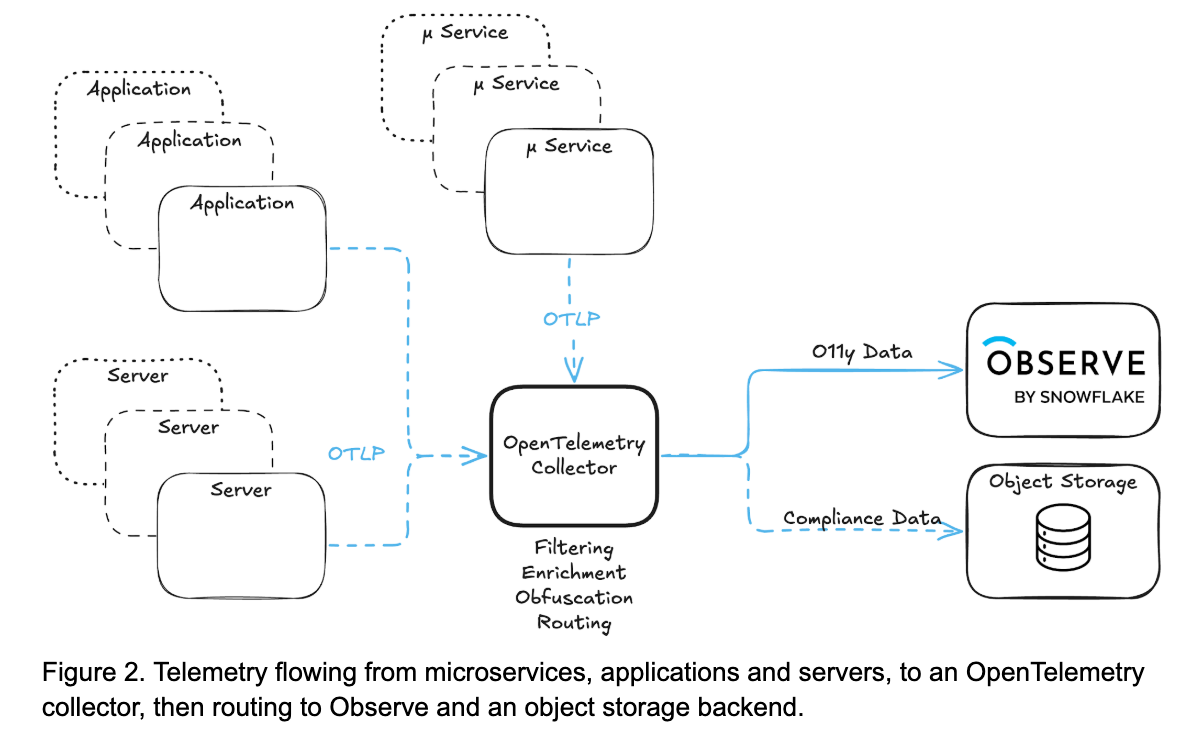
For teams who would rather not worry about what is and isn't included in the various versions of the community-supported collector builds, the Observe Agent is a supported distribution of the OTel Collector, with defaults and packaging for common environments. It makes the core pipeline requirements simple to achieve while adhering to OpenTelemetry standards, with the commonly needed extensions bundled in. Being purpose-built for Observe also buys you a few things a community build cannot, such as fleet monitoring with each agent reporting its own health and internal metrics, tagged by instance, along with the Kubernetes data collection and attribute enrichment that powers Kubernetes Explorer in Observe. None of that costs you the portability. It takes standard OpenTelemetry configuration and exports OTLP wherever you point it, so the pipeline you build here is the same pipeline you could point elsewhere.
Observe is built on the same open standards as the collector, without compromising on capability, which means neutrality is something you keep rather than something we ask you to give up on arrival.
Vendor neutrality is a strategy
Cutting a license cost is easy to measure, but it's often only one part of a bigger picture.
The reason worth planning around is what it costs you to change your mind. On an OpenTelemetry pipeline, moving backends is an exporter block and a redeploy. On proprietary agents, it means reinstrumenting your services, one team at a time. That is why those migrations sit on the roadmap for years instead of getting done.
Your instrumentation, your pipeline config and the operational knowledge your team has built up are all yours to keep, and every major platform now takes OTLP. Dashboards and saved queries live with the backend, so those get rebuilt, but you don't have to go back to your service owners to redo the instrumentation underneath them. OpenTelemetry frees your telemetry data from lock-in.
The collector is well understood and is already carrying production telemetry for many organizations, with an active upstream and a wide component ecosystem behind it. Run it as your pipeline and you drop a license cost, you take a third party out of the path of your most sensitive data, and you keep the option to change your mind later.
