Oct 14, 2026/5 min readProduct and Technology
Why Observability Needs a Context Graph

Modern observability generates enormous amounts of telemetry, but telemetry alone doesn’t explain how the pieces of a system relate. When an incident fires, the hardest part usually isn’t finding the alert — it’s understanding what happened across services, infrastructure and dependencies. The Observability Context Graph in Observe by Snowflake closes that gap by turning raw telemetry into queryable data sets you can link together. So when an incident hits, users can trace why something broke, not just what broke.
The context graph is the architectural layer in Observe that organizes telemetry into a connected map, letting users quickly navigate their entire system for insights instead of manually digging through individual events. It lets users visually explore connections in their raw data to see what’s happening inside their environment.
Learn more about Observe by Snowflake and how it turns telemetry into insights — fast.
Context graph building blocks: Data sets, links and correlation tags
The Observability Context Graph sits on top of the data lakehouse, the single destination for all your observability data. The way these two interact is central to how Observe helps teams investigate faster.
First, raw telemetry is routed from external infrastructure to the Telemetry Data Lakehouse through an integration or collector. Observe then organizes and shapes this data into data sets, which connect both through links directly and through shared correlation tags:
- Data sets: Observe shapes incoming telemetry into data sets, such as Kubernetes logs, Prometheus metrics and trace spans. Resource data sets identify individual resources — virtual or physical objects such as Kubernetes pods and containers, users, products and shopping carts — using a primary key, which can contain one field or a combination of fields.
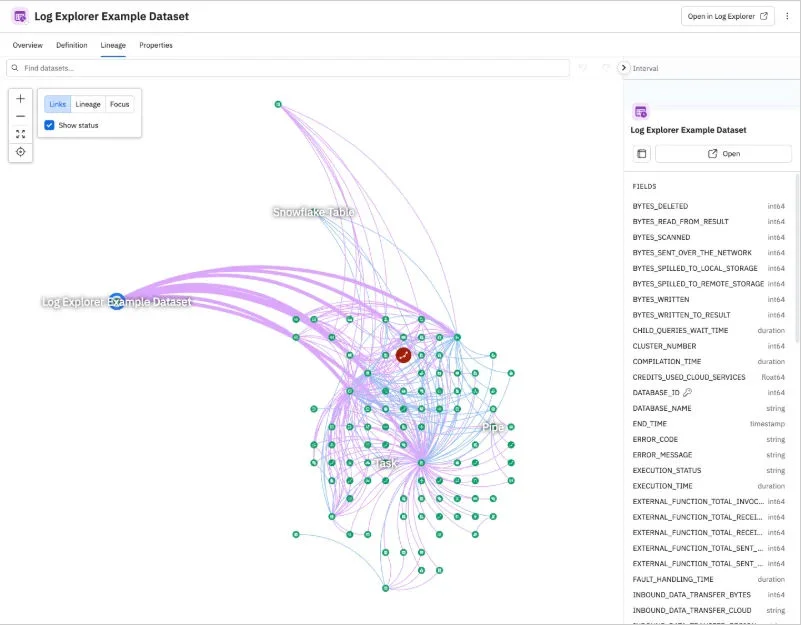
- Links connect data sets: Primary and foreign key links connect data sets based on resource identity. For example, a pod resource can link to the node it runs on. Lineage shows a different relationship between data sets: which data sets were used to build another data set. You can explore these relationships through the Links, Lineage and Focus views, briefly covered below.
- Correlation tags connect data across data sets: Correlation tags label fields, such as “cluster.name” or “service.name,” that represent the same concept across data sets. When fields share a correlation tag, Observe can use matching values to find related data. Many tags are automatically applied based on supported conventions. These searchable tags also help Observe’s AI site reliability engineer (AI SRE) map a term such as “apiserver” to the right data.
Together, these connections form the Observability Context Graph: Data sets are its “nodes,” and the links and lineage between them are its “edges.” Correlation tags add a complementary layer for navigating across data sets through shared concepts. Links, lineage and tags make it possible to investigate across connected data sets instead of examining each in isolation.
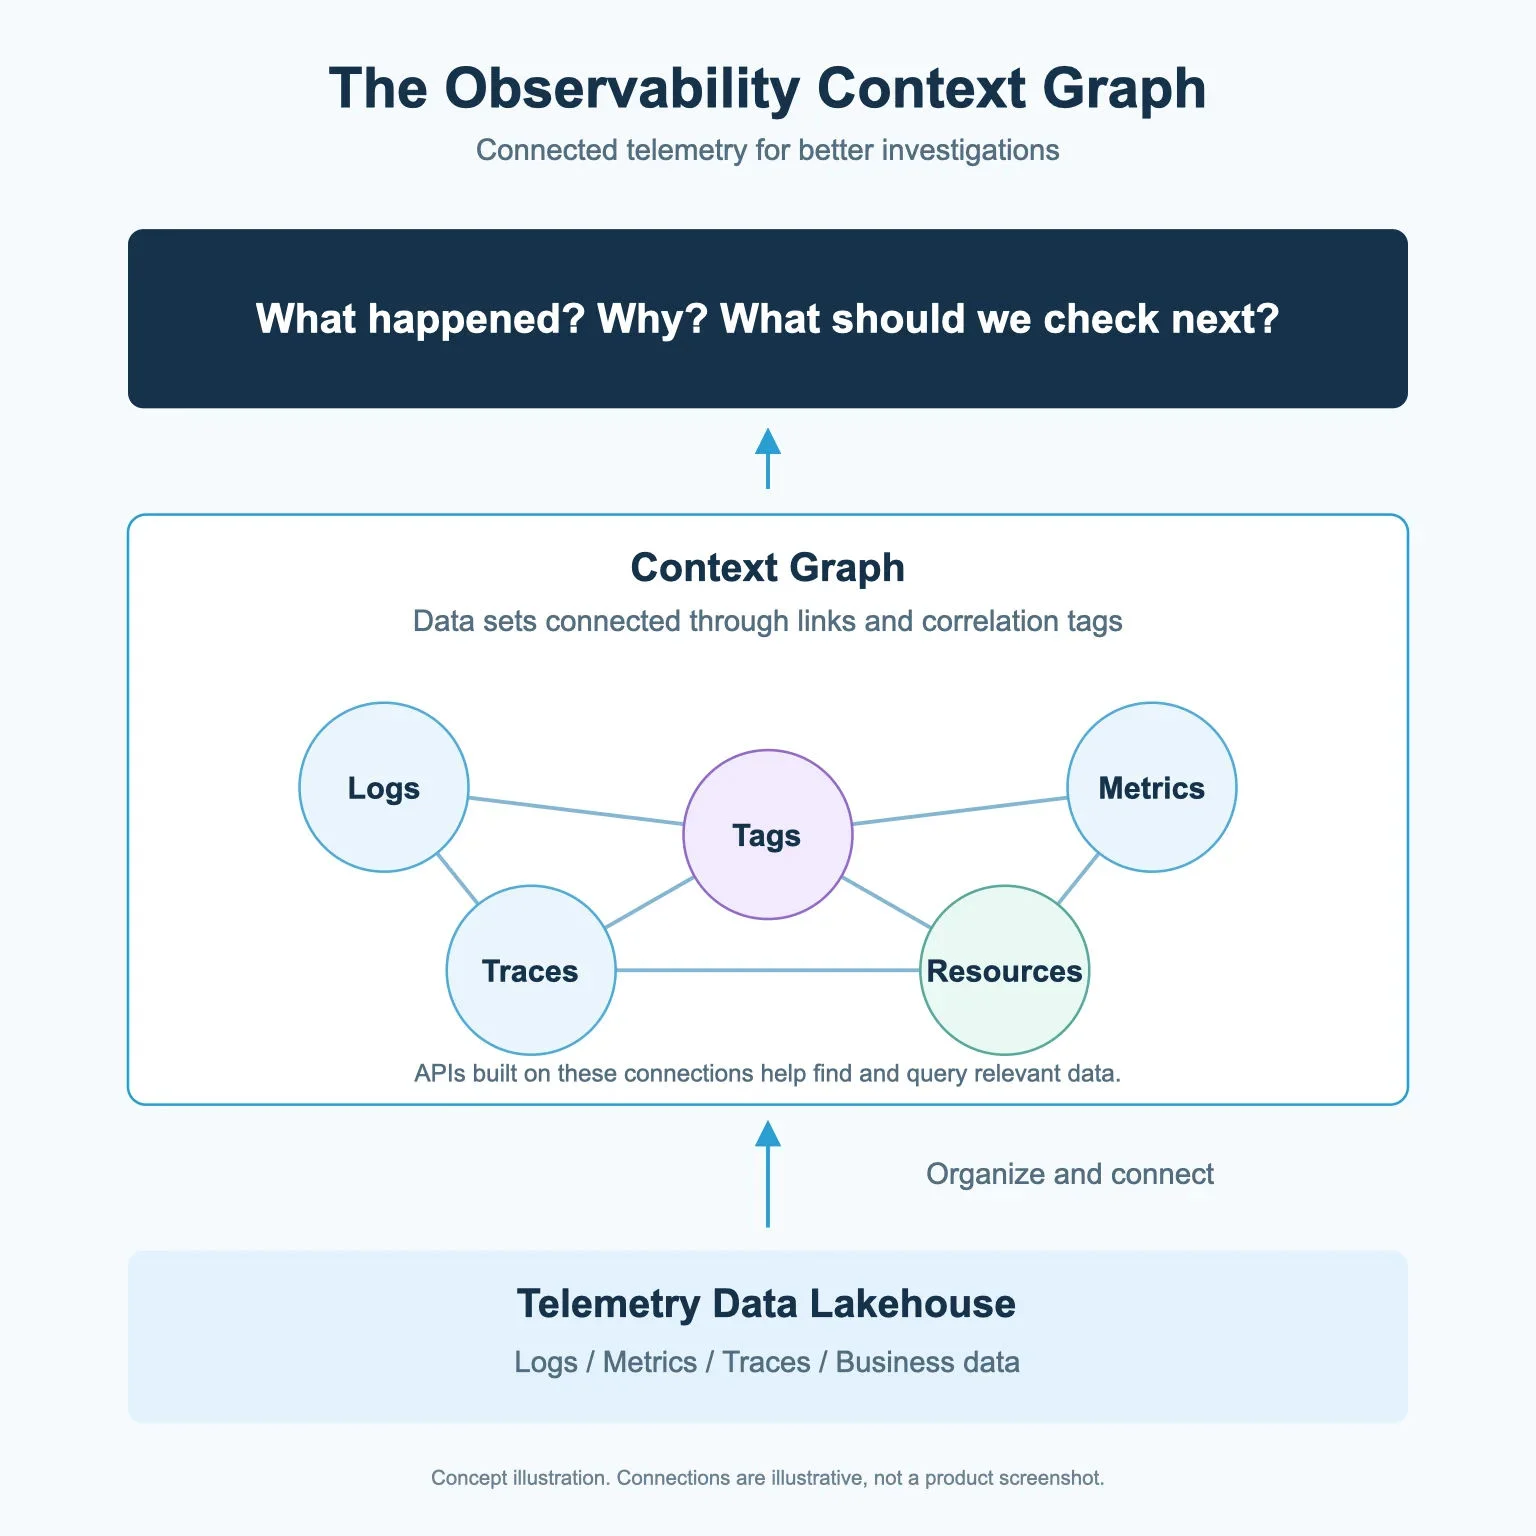
The AI SRE uses these connections to find relevant data and help teams investigate why something broke, not just what broke. Why did the payment service go down at 3 a.m.? How did the latest deployment affect customers downstream? Do we need to increase our node count after deploying the latest feature? The Observability Context Graph provides the context to investigate these questions, reducing the work that teams would otherwise do manually correlating events and resources.
How to visually explore connections in the Observability Context Graph
The context graph works behind the scenes, but you can access the data it’s built on through the Observe user interface.
On the data set page, you can inspect a data set’s schema, properties, correlation tags and relationships. The Links and Focus views show data set connections, while the Lineage view shows how data sets were derived. Observe also has a separate tag management page where you can view all correlation tags in one place. These views help users inspect data set relationships and trace data origins.
How the Observability Context Graph turns connections into answers via APIs
The context graph is queryable through APIs that traverse the same connections that form the graph (data sets, links and correlation tags). These APIs help agents identify services and resources, find related data and use the results to continue an investigation.
The context graph is an agentic surface; because it’s not simply a user interface, the APIs within the graph must be agent friendly. They’re designed to return accurate, relevant answers quickly, without using unnecessary tokens.
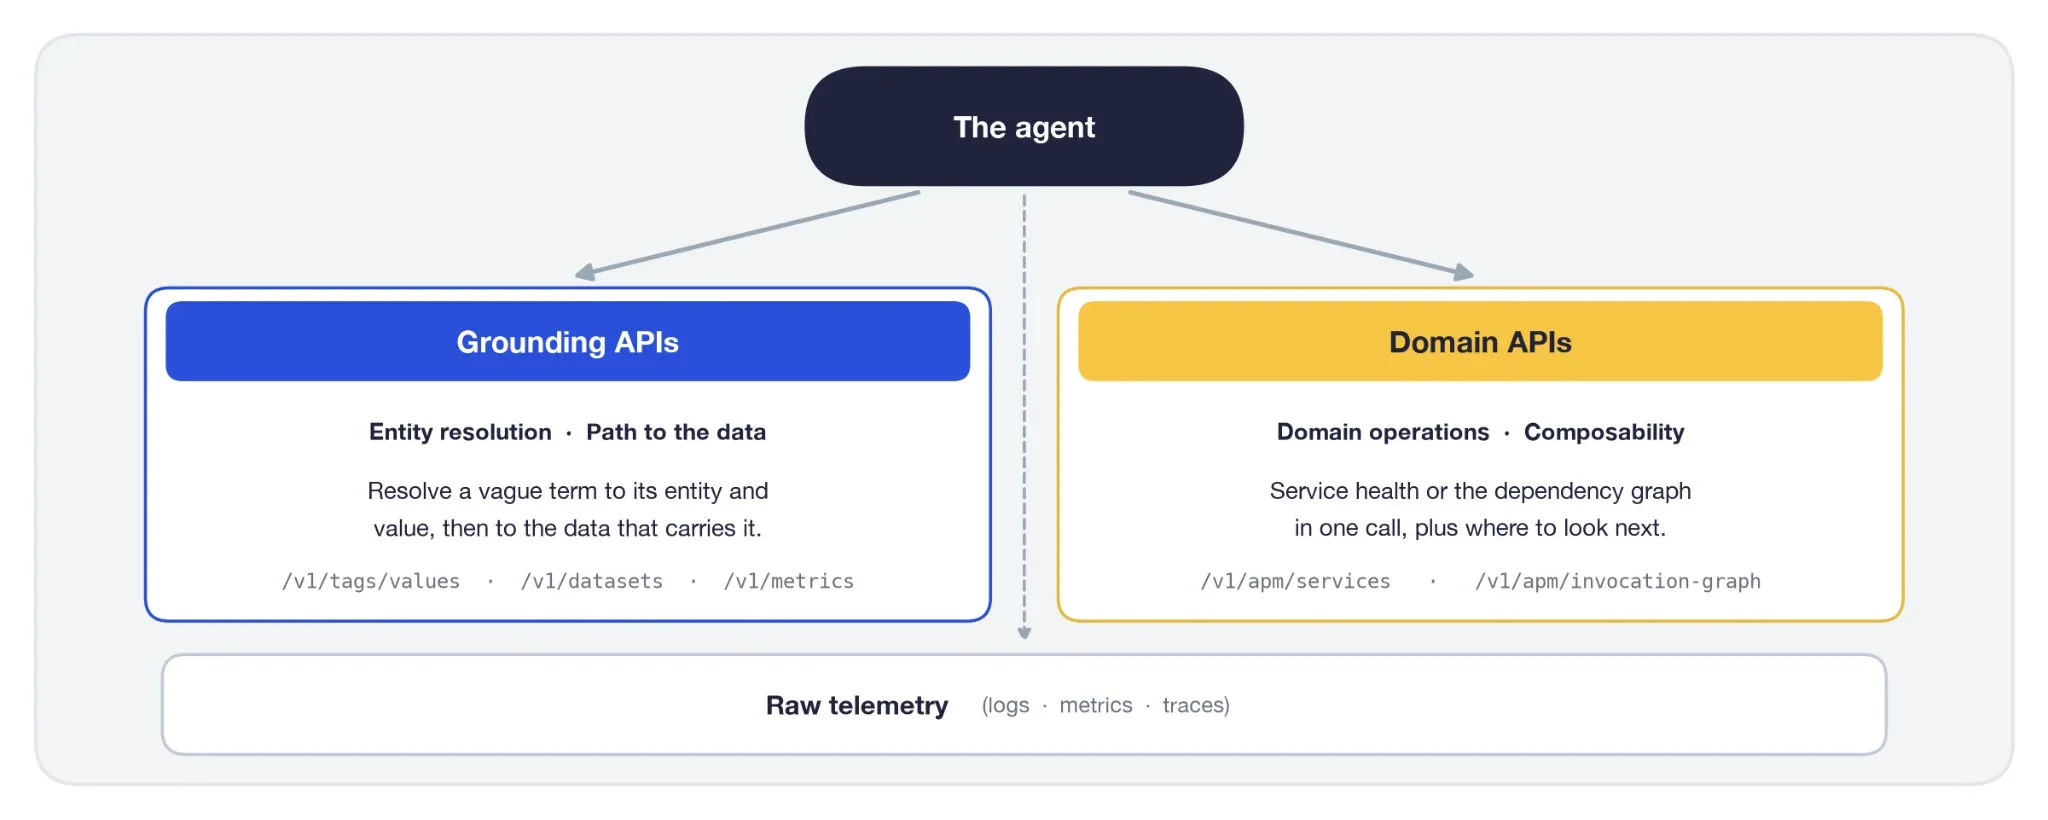
While the Links, Lineage and Focus views let you explore those connections manually, the APIs let you traverse the graph from code or let Observe’s AI SRE do it on your behalf. This makes the graph queryable.
A traversal follows the graph the same way an investigation does. It starts from a term (“payments,” “apiserver”) and uses the “search tag values” API to resolve it to the correlation tag values that identify the service or resource — the same tags that link that concept across data sets. From there, the “list of data sets” and “list metrics” APIs help locate the data sets and metrics associated with it. Because correlation tags are searchable metadata, this works even when an environment has thousands of them.
The graph also encodes observability expertise directly, so common investigations don’t require manually reassembling raw telemetry. A single call to the “list APM services with RED metrics” API can return service rate, errors and duration, while the “invocation graph” API maps service-call relationships. Because each answer points back to the data set, metric and time window behind it, the next step in the investigation is targeted rather than a blind search.
Get started with Observe by Snowflake
To get the benefits of the Observability Context Graph, you first need to get infrastructure data into the Telemetry Data Lakehouse. We recommend using the Observe Agent to collect your data, but you can also use custom integrations or an existing OpenTelemetry collector.
Explore Observe by Snowflake to see how connected telemetry supports faster investigations.

Aug 19, 2026Product and Technology
Troubleshoot Incidents Faster by Giving Your AI SRE Unified Telemetry and a Context Graph

Aug 13, 2026Product and Technology
Connect AI Agents to Your Telemetry with the Observe MCP Server and CLI
Sep 25, 2026Product and Technology
Customer Journeys at Capital One: Observability from Business Impact to Root Cause