Sep 25, 2026/6 min readProduct and Technology
Customer Journeys at Capital One: Observability from Business Impact to Root Cause


An incident starts with symptoms: a spike in 500s, a latency regression or a drop in conversions, for example. The first questions come quickly: What broke, and how are customers impacted?
Traditional observability begins at the service layer, not at customer impact. Dashboards turn red, alerts fire, and teams work outward from infrastructure and application signals to simultaneously estimate customer impact and isolate root cause. This translation from infrastructure signals to business impact often depends on institutional knowledge: Which services power checkout or sit behind account summary? To answer a simple executive question such as “How many people can’t log in?” a team must gather in a breakout room to estimate the impact, then reconcile that estimate during the postmortem.
Capital One addresses this gap directly in its blog post “Observability with Automated Customer Journey Graphs.” Its approach turns the investigation around: Start at the customer interaction layer, then drill down through service and infrastructure layers. When an investigation begins with the business interaction already defined, impact is clear and the path to mitigation and root cause becomes the sole focus.
To do this, Capital One created customer journey graphs in which nodes represent customer interactions and edges show how users move through the experience. Health signals and traffic are overlaid on the graph, turning it into an operational surface for aggregating impact before diving into service-level details.
Capital One implemented this approach in Observe by Snowflake using telemetry ingested into Observe’s data lake, including real user monitoring (RUM) logs, clickstream data and API access logs. In Observe, Capital One modeled and enriched data with interactions and services after ingestion and without app-level instrumentation. This business context is defined once and applied automatically for consumption and collaboration by any persona involved in troubleshooting.
The journey-first workflow in practice: e-commerce example
Step 1: Start at the customer interaction
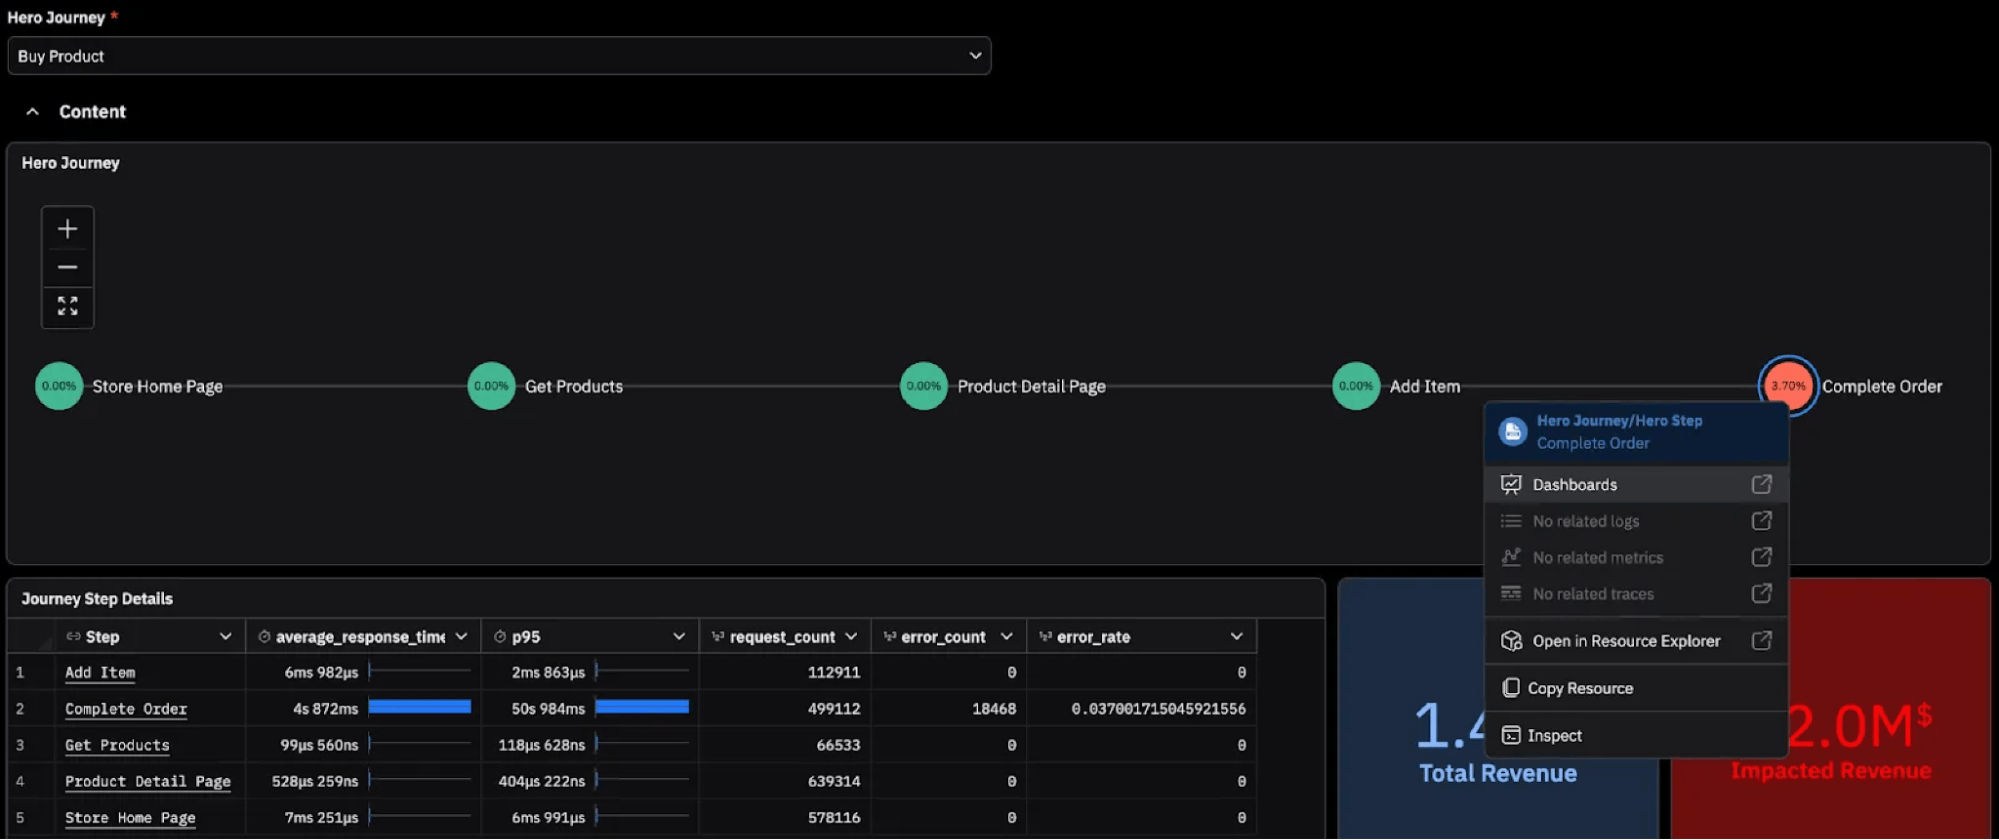
Consider the “Buy Product” journey: Home → Get Products → Product Details → Add Item → Complete Order. In legacy tools, seeing raw log errors or spikes in infrastructure metrics such as CPU or memory usage does not immediately reveal whether purchases are blocked or how widespread the impact is. In a journey-first model, you begin with degradation in the customer experience.
Starting with a customer journey in Observe, you can immediately see the scope of the impact. Measuring impact should be the first step in any incident. Observe aggregates rate, errors and duration (RED) metrics and unique sessions into context that matters. Your investigation starts with business impact already defined.
Step 2: Drill down to the failing operation
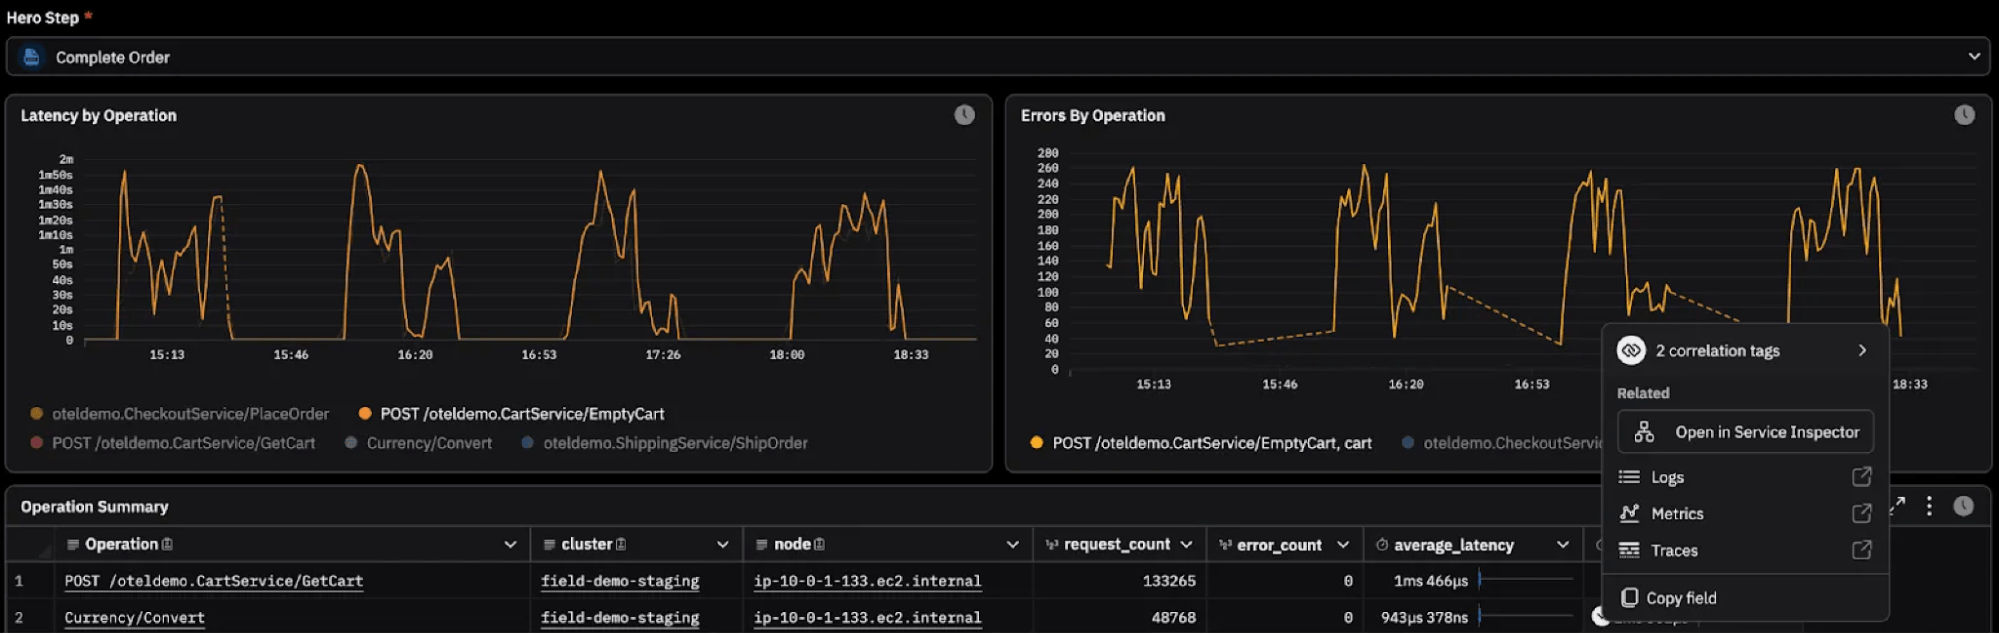
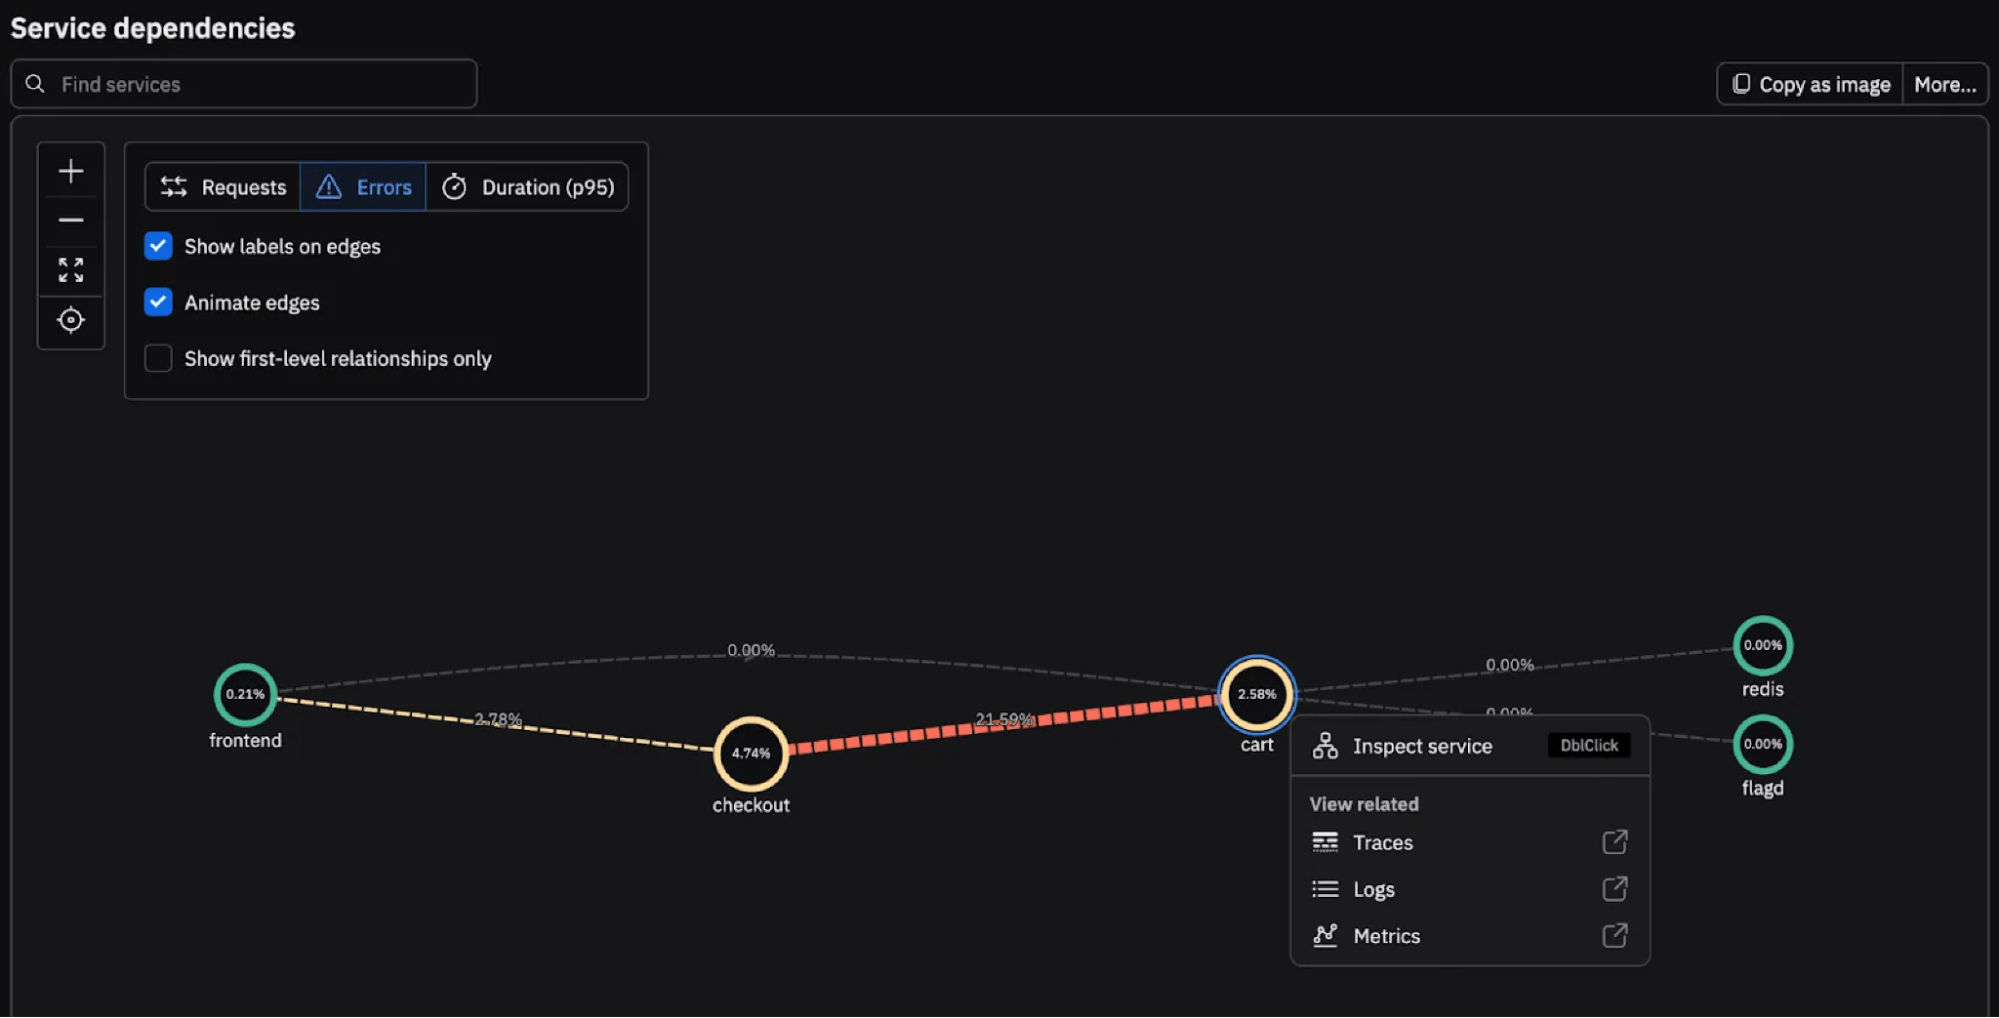
Once the Complete Order interaction is identified as degraded, your next question concerns ownership and scope. From Complete Order, you pivot into a service- or operation-level breakdown. In this example, the EmptyCart operation within the cart service is driving latency and errors. The investigation narrows from a failing customer step to a specific operation. Executives verify impact and severity while site reliability engineers (SREs) identify the problem service from the same dashboard and data, minimizing time wasted reconciling results from different tools.
Step 3: Confirm with traces and logs
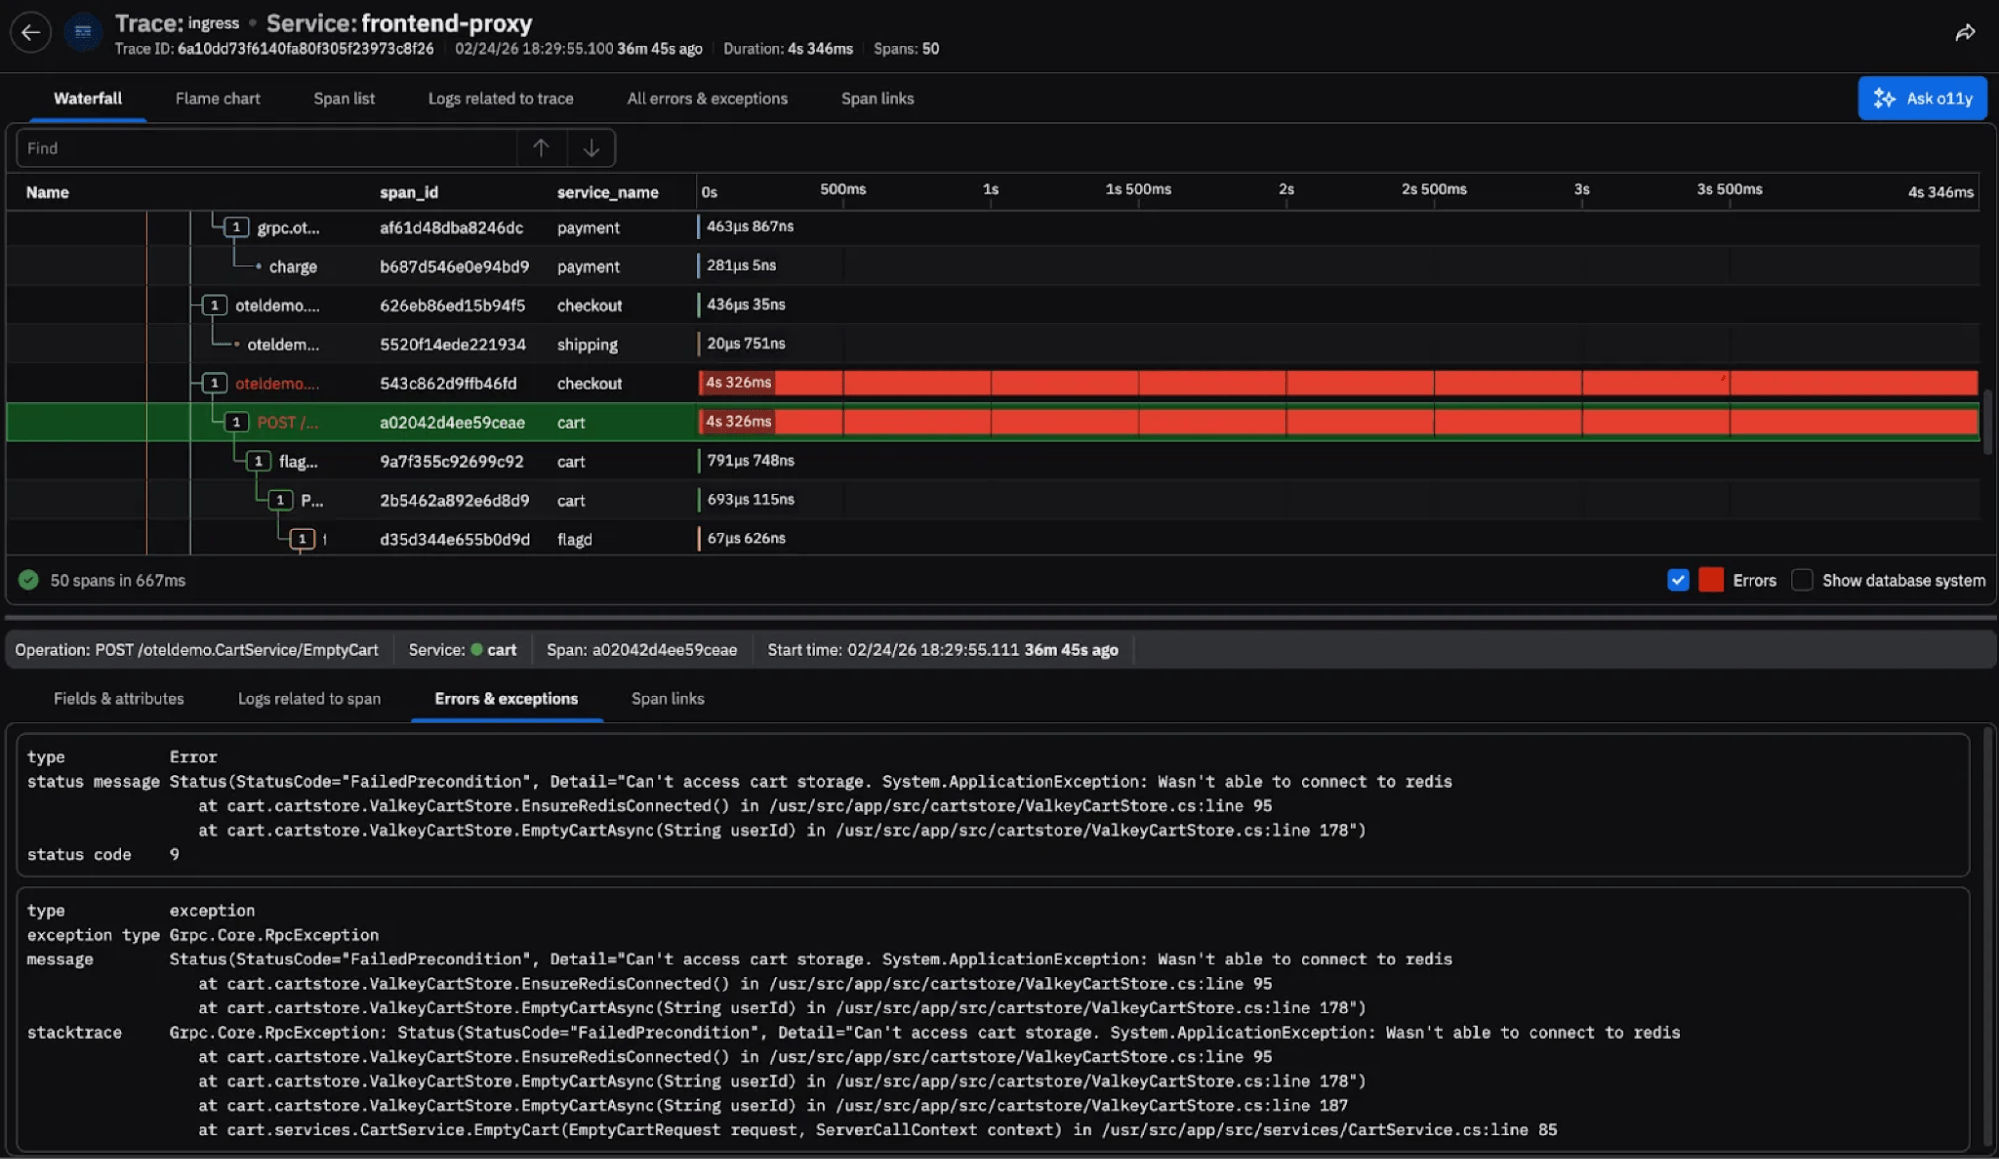
Once the root cause service has been identified, SREs can surgically page the responsible app team and continue the investigation into the related telemetry. Pivot into traces to see where time is spent and where the error originates for a specific request, then drill into the logs associated with the downstream failing span. The incident narrative is now clear: Users can’t complete an order → failing downstream service → trace failure for a related request → explicit error message (root cause). With customer journeys, SREs in this example determine that customers cannot complete checkout because the EmptyCart operation cannot retrieve what was in the cart from Redis right as the paged app team joins the call.
This example demonstrates exploratory incident analysis. Starting from customer impact, the responder narrows the investigation by following relationships in the telemetry data lake — interaction to service, service to operation, operation to trace and trace to log — until the failure mode is confirmed. The structure is defined in the data, but the investigation itself is still driven by people. Engineers decide where to pivot next, which signals matter and how to summarize the findings for the rest of the room. That synthesis is essential, but it takes time under pressure.
AI SRE: Accelerating the path to root cause
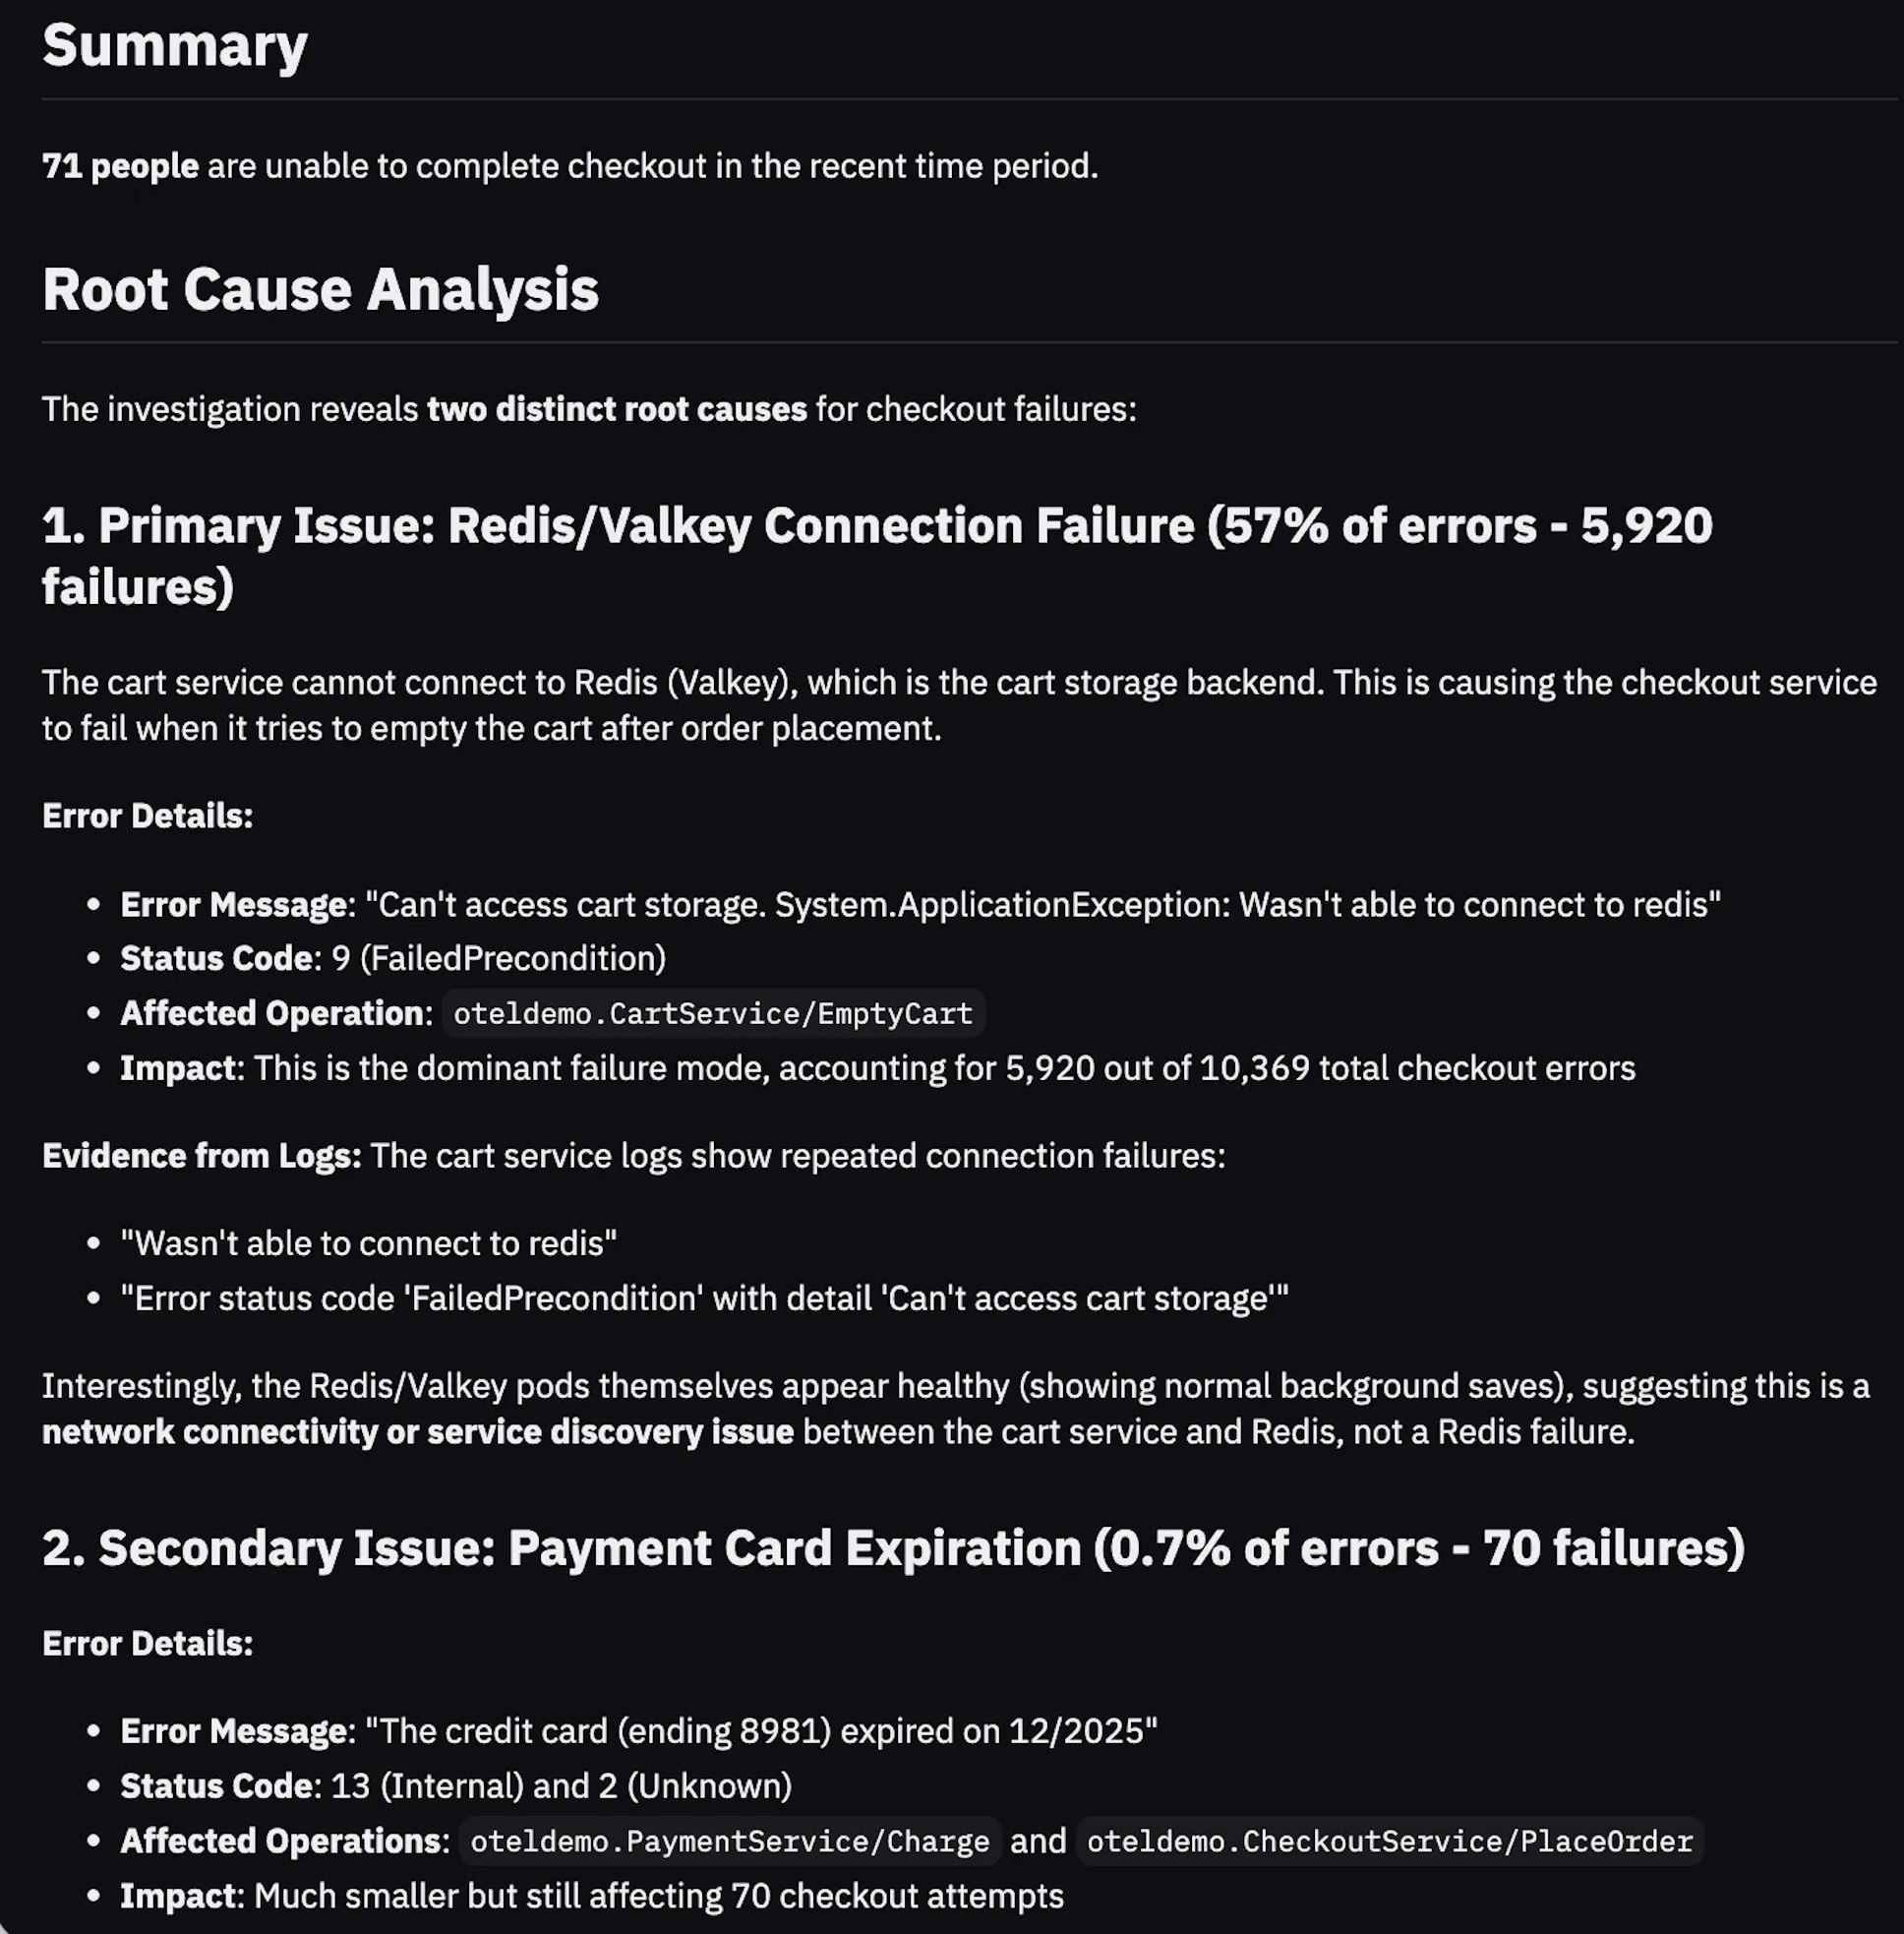
AI SRE operates over the same observability context graph in the telemetry data lake that powers the journey flow. Instead of manually navigating each step, an engineer can ask, “What’s causing the spike in failed payments?” AI SRE traverses the connected interactions, services, traces and logs and returns a guided investigation with supporting evidence and interactive query cards for deeper analysis, all in seconds.
AI SRE can deliver substantial productivity gains in observability workflows. Customers report completing tasks about 4x faster on average, with some investigations up to 10x faster. (Learn more about how the AI SRE uses unified telemetry and the context graph to cut investigation time.)
AI SRE also follows the relationships defined in your data. The same connections that link business impact to implementation guide the investigation, reducing the time between question and answer while preserving the evidence trail.
Customer journeys within the larger observability context graph
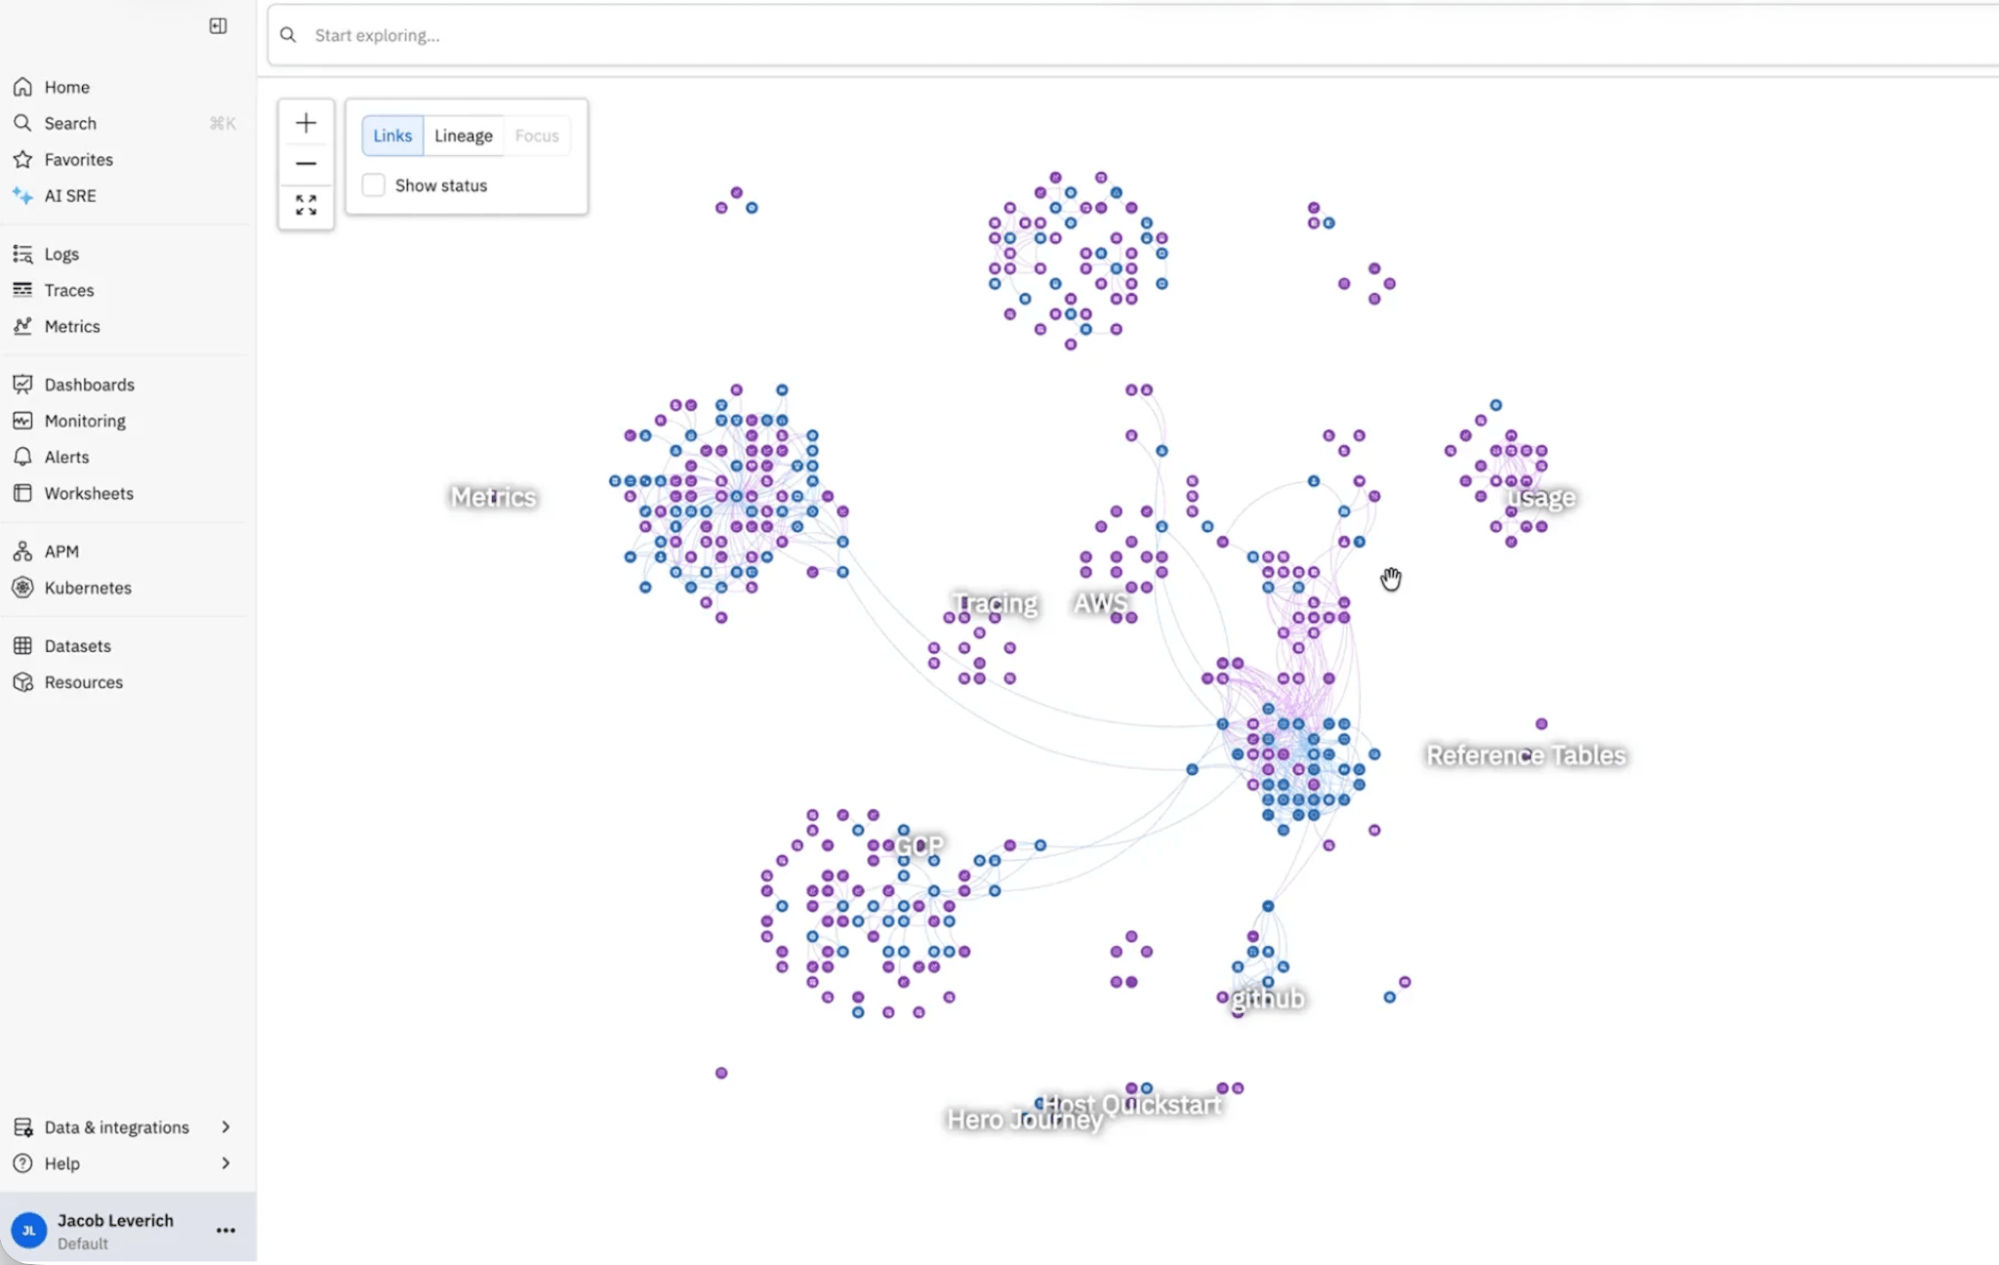
The journey flow above is one domain within a broader observability context graph in Observe. All telemetry ingested into the telemetry data lake is connected through modeled relationships that reflect how services, infrastructure and business entities interact.
Customer journeys organize part of that graph around business interactions. Other domains connect cloud resources, change data and external systems such as AWS and GitHub to the services they affect. Each node and edge reflects relationships defined in the data model rather than a predefined dashboard.
When you pivot from a journey step to a service, or from a service to a trace, you are traversing that larger graph. AI SRE operates over the same structure. Journeys are one business-aligned entry point into a shared model of how your systems and business context connect.
Observability from business impact to root cause
Customer journeys in Observe show how starting from business impact reshapes the investigation from chaos to procedure. Because Observe is built around relationships in the context graph built on top of a telemetry data lake, you can pivot across different kinds of data based on how your systems and business entities are actually connected.
A journey graph is one way to organize those relationships, and it’s fully supported as part of Observe’s core functionality. The same mechanism applies to any entity you model in your data: customers, transactions, shipments, devices, phone calls and claims. Once those relationships are defined, they become context for analysis without learning dashboards and runbooks during the incident with AI SRE.
This is the shift Capital One describes: Begin with what customers are experiencing, then move through only the related data with context intact. In Observe, customer journeys are one domain within a broader observability context graph built on the telemetry data lake. Because that graph reflects how systems and business entities connect, the path from business impact to root cause is already defined, which can result in faster and more efficient investigations.
Learn more about Observe by Snowflake and how it turns telemetry into insights — fast.