

Augmented Analytics: From Automated Insight to Confident Action
Augmented analytics brings AI into more of the analytical process, helping teams investigate data faster. The real test is whether those faster answers still carry the context, controls and evidence people need to trust them.
AUGMENTED ANALYTICS DEFINED
Augmented analytics is an approach to analytics that uses AI and automation to assist people in interpreting data, investigating questions and producing decision-ready insights with less manual effort.
A single analytical question can involve a surprising amount of work: finding and preparing the relevant data, choosing an analytical method, writing or adjusting a query, checking the result and explaining what the finding means. Augmented analytics applies AI, machine learning (ML) and automation across that workflow, helping analysts reduce repetitive work while giving business users more direct ways to explore data, including through natural-language questions.
However, AI puts more pressure on the data, governance and evaluation systems around analytics because it takes on more of the choices previously handled by people. Data quality, business context, permissions and validation determine whether an AI-assisted result is reliable enough to inform a decision. That foundation is still a work in progress for many organizations. In research from MIT Technology Review Insights and Snowflake, just 22% of more than 275 business leaders said their organizations have a data foundation for generative AI that is “highly ready.”
What is augmented analytics?
Augmented analytics uses AI, ML and natural-language technologies to assist with parts of the analytics workflow, including data preparation, querying, insight discovery, explanation, visualization and collaboration.
Sometimes the process starts with a person asking a question. In other cases, the system detects an anomaly, change or relationship that deserves attention. In either case, AI assists with the analytical work while people retain responsibility for interpreting consequential results and deciding what to do next.
What distinguishes augmented analytics is the way those capabilities are connected across the analytical process. A natural-language question, for example, might trigger query generation, statistical analysis and an explanation of the result within the same experience. The goal is to reduce the manual transitions between analytical steps while preserving the evidence and context needed to evaluate the result. Human ownership is particularly important in enterprise analytics, where answers must inherit established business definitions and access controls.
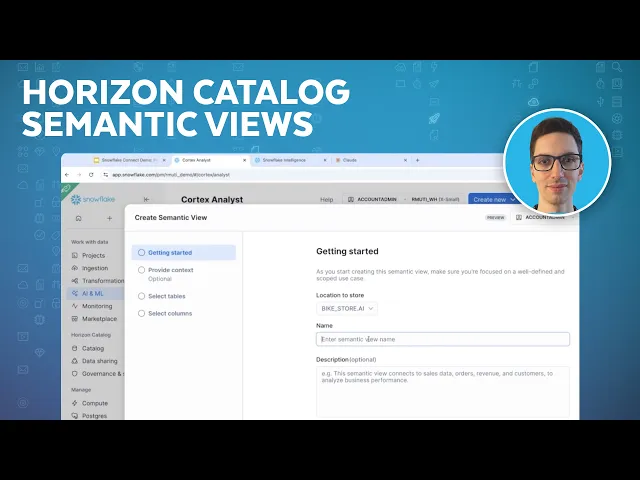
See how semantic views give AI-powered analytics the business context needed to interpret questions and generate more reliable answers:
How augmented analytics turns data into answers
Turning raw data into decision-ready insight with augmented analytics relies on a continuous loop that grounds the data in business context and refines itself with every decision.
Context
The first step is context. The system needs to know what the relevant entities, metrics, relationships, permissions and freshness rules mean before it can interpret the request correctly. Without that layer, even a well-formed query can answer the wrong business question.
Analysis
Next comes analysis. Depending on the request, the system might generate SQL, compare a result with a threshold, apply a statistical or ML method or combine evidence from structured and unstructured data. The method should follow the question — a descriptive comparison, anomaly investigation and forecast require different analytical logic.
Explanation
The result then has to be explained in a form the decision-maker can use, such as a chart, table, narrative summary or combination of the three. For consequential analysis, the explanation should preserve enough source context that a reviewer can see where the result came from and how it was produced.
Review and action
From there, the workflow moves into review and action. Routine questions may need little intervention, while ambiguous, regulated or high-impact decisions call for closer scrutiny. The person responsible for the decision checks assumptions, resolves uncertainty and decides on an action.
Feedback
Finally, feedback closes the loop. Verified questions, corrected metric mappings, accepted or rejected insights and user behavior all create feedback that teams can use to improve future performance.

Augmented analytics vs. traditional BI
Traditional business intelligence (BI) typically gives users dashboards, reports and tools for exploring established metrics and recurring business questions. Augmented analytics builds on that foundation by using AI and automation to reduce some of the manual steps involved in querying, discovery and explanation.
For example, in a traditional BI environment, a sales leader might filter a report to investigate a decline in revenue. With augmented analytics, the same user could ask in natural language why revenue declined, have the system generate the appropriate query, identify contributing segments and return a narrative explanation for review.
Augmented analytics combines AI, automation and analytical methods. These analytical methods include predictive analytics, which estimates what’s likely to happen, and prescriptive analytics, which evaluates possible actions. ML supplies methods for identifying patterns or generating predictions, while generative AI supports tasks such as translating natural-language questions into SQL or summarizing analytical results. An augmented analytics system may use any of those capabilities as part of a broader analytical experience.
Why augmented analytics needs trusted business context
Consider a seemingly straightforward question: “Which suppliers are responsible for the most late deliveries?” Before analyzing anything, the system has to resolve several questions. What qualifies as late: after the requested date, a promised date or an internally adjusted date? How should partial shipments count? Which supplier gets attribution when an order contains products from several vendors? Those choices determine the result just as much as the SQL does.
Business definitions give data a shared meaning
Enterprise data is rarely explained via column names alone. Metrics, dimensions and categories often depend on rules that live in documentation, BI models or subject matter expertise.
For augmented analytics, those definitions need to be available to the system during analysis. Otherwise, a natural-language request can map to a technically valid calculation that doesn’t match the way the organization actually measures the business.
Relationships and grain shape the answer
Context also includes how data fits together. An order table, shipment table and supplier table might each contain the information needed to investigate late deliveries, but joining them incorrectly could duplicate records or attribute a delay to the wrong supplier.
Time grain creates similar problems. A monthly metric can’t always be meaningfully compared with a daily one, and some measures shouldn’t be summed across periods at all.
By representing those relationships explicitly, augmented analytics systems have more information for determining which data to use and how to combine it.
Permissions and freshness constrain what the system should use
The relevant answer also depends on what a user is allowed to see. The system should identify the permissions of the user and expose only that data. For example, a procurement manager might have access to supplier performance data but not negotiated pricing or other restricted information.
Freshness is another important factor. A question about today’s delivery delays, for example, shouldn’t rely on a table that refreshes once a week.
Governance therefore has to travel with the analysis. Role-based access controls must apply to the governed data and objects being queried, rather than requiring organizations to create a separate copy of the data for the AI interface.
Verified examples provide a reference point
Some questions recur often enough that teams already know what the correct analysis should look like. Those examples are useful context too. Natural-language questions can be paired with SQL that’s been confirmed as correct. When similar questions come up later, the system can use relevant verified queries as examples.
Context reduces ambiguity, but it doesn’t remove the need for review. For consequential analysis, teams should still be able to inspect the generated SQL, source objects and assumptions behind the answer, particularly when an unusual question falls outside the patterns the system has seen before.
COMMON PITFALL
A common mistake is treating technically correct SQL as proof of a correct answer. A query can run perfectly while using the wrong metric definition, join path, time grain or population.
Enterprise augmented analytics use cases
The strongest augmented analytics use cases tend to share a few characteristics: the questions recur, the underlying definitions are clear and someone owns the decision that follows.
- Self-service business questions: Recurring requests, such as revenue by region, product performance or customer retention, often consume analyst time even when the underlying analysis is well understood. Natural-language access gives business users a more direct route to those answers while the domain team retains ownership of the metrics.
- Proactive anomaly and driver discovery: Finance, operations, product and revenue teams often need to be alerted to meaningful changes shortly after they occur. An augmented workflow might flag an unexpected drop in conversions, for example, then identify the products, regions or customer segments associated with the shift and link the explanation back to supporting data.
- Predictive and scenario analysis: Teams forecasting demand, churn, capacity or risk frequently move between historical analysis and estimates of what comes next. Augmented workflows give users a more accessible way to query those results and explore scenarios, while dedicated predictive analytics methods handle the underlying estimation.
- Narrative and visual explanation: A detailed analytical result isn’t always the format an executive, frontline employee or external audience needs. Generative AI supports first drafts of charts, summaries and explanations, provided the underlying metrics are defined consistently and teams review material intended for consequential or external use.
- Embedded analytics: Analytical questions increasingly appear inside operational applications and workflows. A user reviewing an account, for example, might ask why usage dropped without leaving the application. When the workflow moves from insight into action, organizations need explicit thresholds, approvals and an audit trail.
Risks, limits and the role of human judgment
Augmented analytics can reduce manual analytical work, but it’s susceptible to errors. Some originate in the data or analytical logic, while others arise because the system lacks context that a human user would recognize immediately. Generative AI introduces an additional concern: an incorrect result can be presented fluently and with confidence, making the error difficult to detect.
Analytical errors can enter at multiple points
An augmented analytics workflow can go wrong before the final answer is ever generated. A join might duplicate rows, or a stale table might be used for a question about a current situation. A non-additive metric could be aggregated incorrectly, or ambiguous language might map to the wrong population. Even with correct calculations, the interpretation can still overreach — a relationship between two variables doesn’t establish causation, for example.
Recent research from Snowflake AI Research and Brown University illustrates the problem. In AvalancheBench, systems were evaluated on end-to-end analytical correctness rather than whether the pipeline merely completed. In one ecommerce use case, even the strongest configuration of a leading coding agent correctly identified only 26% of the segments, events and relationships the benchmark expected it to find. Errors introduced earlier in the analysis propagated into the final result.
Because those errors can enter at different stages, reviewers need visibility into the analytical path: source data, generated SQL, metric definitions and relevant assumptions. Checking only the final chart or summary isn’t enough.
Data doesn’t contain every piece of business context
An AI analytics system works with the information available to it. For example, it may identify a sharp decrease in product usage without knowing that a planned customer migration occurred that week, or find an apparent performance difference among groups without recognizing a policy change that affected how the data was collected.
Historical data can also preserve historical inequities or patterns that an organization doesn’t want to reproduce. A statistically strong relationship isn’t automatically an appropriate basis for a business decision. This is why domain expertise remains essential. People bring knowledge of events, operational constraints and consequences that may never appear explicitly in the underlying data.
Fluent answers can encourage too much confidence
Augmented analytics changes the way people encounter analysis. Instead of examining a query or building a chart themselves, users may receive a polished explanation immediately. Fluency and completeness can make that answer feel more authoritative than the evidence supports.
Human judgment has a specific role: determining whether the assumptions fit the situation, recognizing context the system doesn’t have and deciding how much evidence is necessary before acting. As augmented analytics handles more of the mechanics of analysis, those judgment calls must remain with the people accountable for the decision. Source references, generated queries, clarification requests and explicit review steps give users something concrete to inspect before relying on an answer.
How to implement augmented analytics responsibly
The safest way to introduce augmented analytics is to start small enough that teams can see exactly where it works and where it breaks. A bounded set of business questions gives them something concrete to test against: Are the right data sources being used? Do the answers match established metrics? Where do users need clarification or analyst review?
Once those answers are understood, teams can expand by domain, carrying forward the definitions, permissions, test cases and review practices that proved useful in the pilot.
- Choose a repeatable decision or question: Identify the intended user, the current delay, relevant source systems, the person who owns the decision and the consequences of a wrong answer. Questions that appear frequently and have measurable outcomes make strong candidates.
- Prepare the data and permissions: Resolve freshness, quality, identity, lineage and access issues within the pilot scope. An AI interface still depends on the data underneath it.
- Assign owners to business definitions: Domain teams should approve and maintain the metrics, relationships and other semantic context used in the workflow. Track changes over time so revisions to a definition trigger appropriate testing.
- Build a representative test set: Use questions people actually ask, paired with verified SQL and expected results. Include ambiguous wording, multi-table joins, time comparisons and known edge cases rather than testing only the easiest examples.
- Pilot with domain users: During early use, capture unanswered questions, corrections, clarification requests and escalation points. Those interactions reveal where the system interprets intent well and where a person still needs to intervene.
- Measure quality as well as adoption: Useful measures include answerability, SQL correctness, agreement with certified metrics, time to answer, clarification rate, review rate, adoption among intended users and analyst hours returned. Connect those operational measures to the outcome of the decision whenever possible.
- Expand by domain: Once the test set, business definitions and ownership model hold up for one area, extend the approach to another. Changes to data structures, permissions, metrics or models should trigger another round of evaluation.
QUICK TIP
Build your initial test set from questions people actually ask. Recurring analyst requests, dashboard usage and query history are often better starting points than synthetic examples because they expose the ambiguity and edge cases the system will encounter in production.
How Snowflake supports augmented analytics
Snowflake supports analytics, including augmented analytics, through a shared foundation of governed data and business context. Semantic Views provide business-aware definitions for dimensions, metrics and relationships over governed data. Cortex Analyst uses that context to translate natural-language questions into SQL for structured-data analysis and returns the generated query alongside the answer, giving users and reviewers visibility into how the result was produced.
For knowledge workers working across a broader set of enterprise information, Snowflake CoWork provides an interface for working with structured and unstructured data, producing cited answers and, where configured, interacting with governed tools.
Cortex Agents support teams building managed agent workflows, while Cortex AI Functions analyze unstructured content such as text, images, audio and video inside Snowflake. For predictive workloads, Snowflake ML provides capabilities spanning feature management, model training, inference, observability, explainability and lineage.
Across those workflows, the architectural principle stays consistent: use the capabilities appropriate to the question while preserving governed access, shared business meaning and a path to verification.
Trust has to keep pace with automation
Augmented analytics gives teams new ways to reduce the manual work between a question and a decision, but faster analysis only helps when the result is grounded in trusted data, shared business context and appropriate review. As AI takes on more of the analytical process, the surrounding architecture has to carry more of the burden for consistency, access control and verification.
KEY TAKEAWAY
Augmented analytics only pays off when speed is matched by trusted data, shared business context and human review — the surrounding architecture, not the AI alone, is what makes fast answers reliable.
Frequently Asked Questions
Your common questions about augmented analytics, answered by Snowflake experts.
How can an organization measure the return from augmented analytics?
Start with a baseline for a bounded use case, then track measures such as time to trusted answer, analyst hours returned, answerability, correction and escalation rates, and adoption among the intended users. Connect those measures to the business outcome of the decision as well. Faster answers indicate productivity gains; whether those answers improve a decision is a separate question.
What should enterprises evaluate when choosing an augmented analytics platform?
Look closely at how the platform handles business definitions, multi-table relationships, permissions, structured and unstructured data, generated-query visibility, verified questions, ambiguous requests, human review and ongoing monitoring. Integration with existing BI and operational workflows also deserves attention. Testing real business questions and known edge cases usually reveals more than comparing feature checklists.
Explore Analytics Resources
Explore Analytics Topics
Deep dives into every aspect of analytics
