


Blog
Workload optimization
Easily identify and resolve performance inefficiencies across queries, warehouses and storage so your data teams spend less on compute and wait less for results.






OVERVIEW
Snowflake tunes performance while your workloads run, gives you targeted controls and keeps a clear record of what changed and how much it helped.
Most platforms make performance an expert's job: Size the compute, partition the tables, manage the caching layer, add a third-party tool. On Snowflake, optimization runs continuously inside the engine, improving as your queries change.

Queries speed up on their own
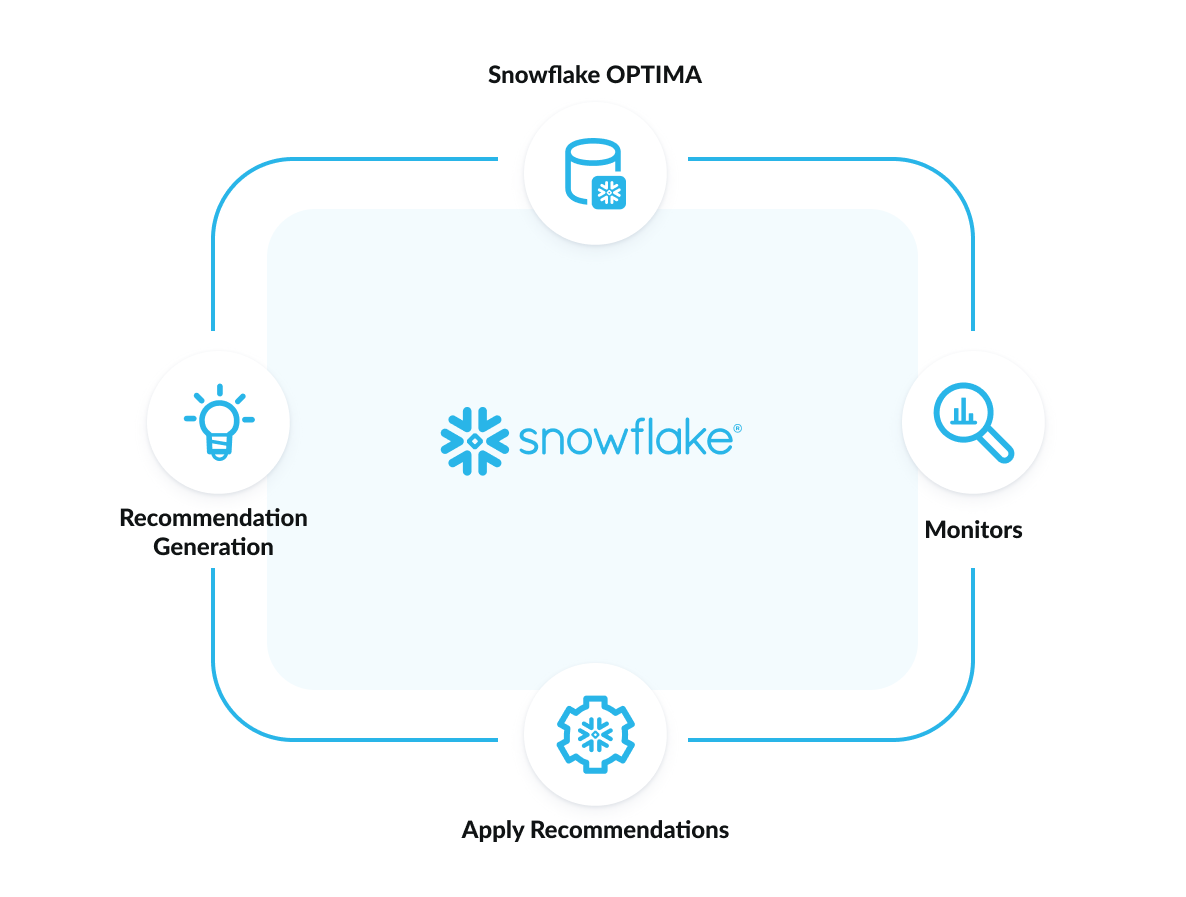
Snowflake Optima spots recurring patterns in your query history and accelerates them, without keys to choose* or indexes to build.

Compute spend drops
Smarter pruning and purpose-built table controls cut the bytes each query reads: fewer scanned bytes, fewer credits on the same workload.

Diagnose slowdowns in plain language
Performance Explorer tracks workload health; Snowflake CoCo reads the execution plan and tells you what to fix.
Benefits
Faster performance without the complexity
Performance that compounds
Let recurring workloads get faster the more they run
The reports you run daily shouldn’t need a tuning project to stay fast. Snowflake Optima studies your query history, then builds hidden search indexes, custom pruning metadata and improved query plans for the patterns it finds, with no DDL to write.
Controls you apply deliberately
Maximize performance for your most critical and demanding queries
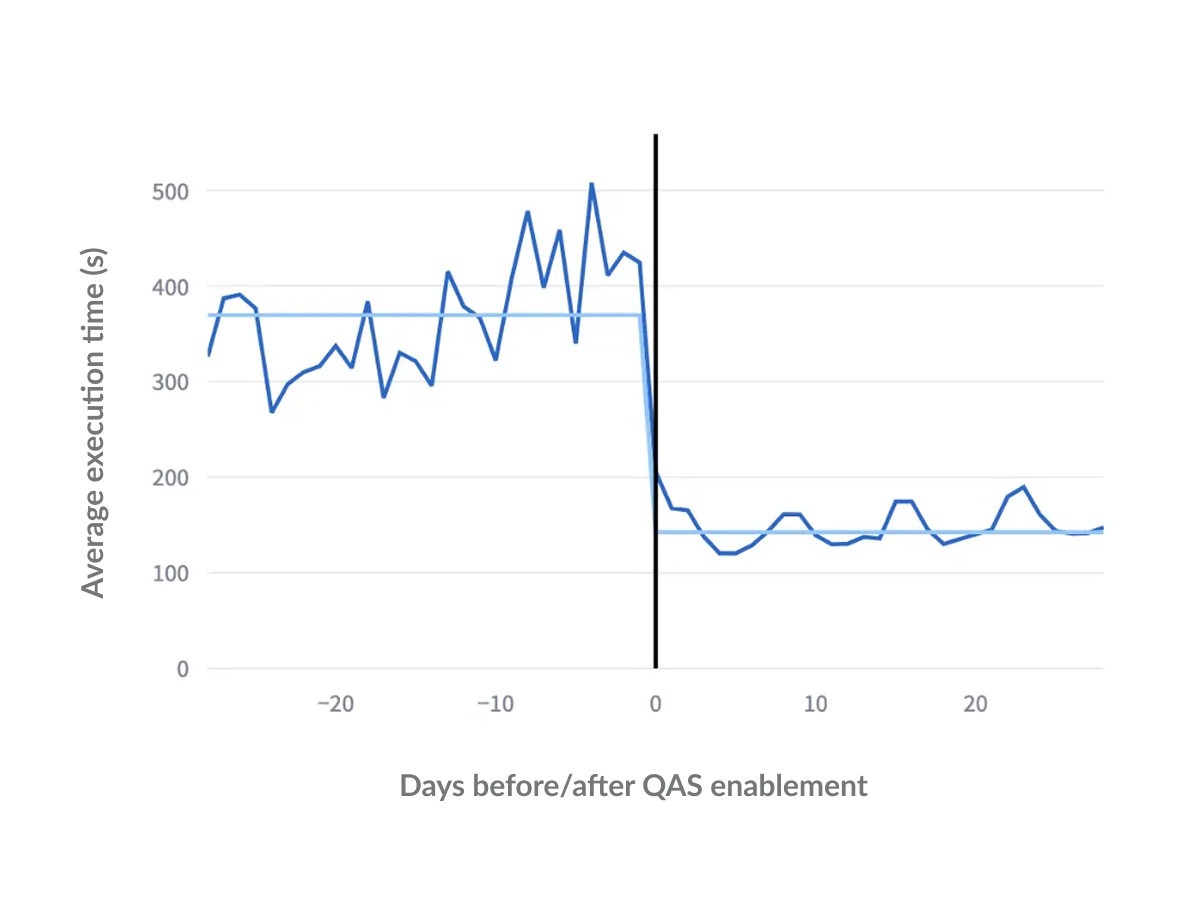
For the workloads you know best, Snowflake gives you purpose-built controls to optimize them, whether you’re reorganizing how tables are stored, pre-computing expensive aggregations, accelerating selective lookups, or offloading scan-heavy outliers.
Diagnosis without a database expert
Immediately pinpoint what changed and why
Easily see, review and implement changes to improve performance. Performance Explorer brings query, warehouse and table health into one view, Query Insights surfaces likely causes, and Snowflake CoCo explains and provides optimization suggestions in plain language.

Complex reporting went from months to minutes
The Executive Office of Education moved its analytics workloads onto Snowflake. Analysis that once took months now returns in minutes, on a quarter of the processing power, saving $1.5 million a year.
- 93% Faster analysis
- $1.5M Annual savings

Fully managed service
Keep the gains without an upgrade project
Optimization improvements reach your account as Snowflake ships them, so the efficiency you get in a year is better than the efficiency you get today. There is no release to schedule, no migration to plan and no downtime to absorb.

Features
Build on what keeps your workloads fast
Optimizing Snowflake Performance
Frequently Asked Questions
How Snowflake optimizes query performance, which controls to use, what they cost and how to confirm they worked.
What is workload optimization in Snowflake?
Workload optimization is the set of techniques that make queries run faster and consume less compute. Snowflake handles it at three layers: Snowflake Optima applies tuning automatically based on real query history; Automatic Clustering and Search Optimization Service target specific table patterns; and Performance Explorer shows what is happening across queries, warehouses and tables. Most of it requires no configuration.
Do I need to set clustering keys or build indexes myself?
For many workloads, no. If you use Gen2 or adaptive warehouses, Optima Indexing identifies recurring queries from history and optimizes them. Teams with well-understood and performance-sensitive access patterns can still set a clustering key or Search Optimization Index explicitly.
How is Snowflake Optima different from Materialized Views and Search Optimization Service?
Optima is automatic and inferred from your query history; the others are controls you choose and apply. Optima decides what to accelerate and does it in the background. Search Optimization Service and Materialized Views let you target a known pattern deliberately, such as point lookups on a large table or an expensive aggregation that runs on a schedule. Many accounts use these features and Optima together.
Does workload optimization cost extra?
It depends on the capability. Optima applies its optimizations automatically as part of the platform. The features you enable yourself, including Automatic Clustering, Search Optimization Service, Materialized Views and Query Acceleration Service, consume serverless compute when they run, which appears on your bill. The tradeoff is usually favorable: less data scanned per query means fewer credits consumed by the query itself.
How do I confirm an optimization actually helped?
Performance Explorer tracks query, warehouse and workload health over time, so you can compare execution before and after a change. Query Insights highlights the specific contributors to slow execution and flags regressions. For a single query, Query Details shows the execution profile, operator statistics and how effectively partitions were pruned. Snowflake CoCo can walk through any of these and explain what changed.
How do I get started?
Start by finding out where the waste is. Run the workload performance analysis skill to get guided diagnostics on partition pruning, query spilling, cache use, clustering and warehouse sizing across your account. It surfaces which tables would benefit from Search Optimization Service and which queries are eligible for Query Acceleration Service, so your first changes are the ones with the most headroom.
How do I use CoCo to manage my performance?
To manage performance with CoCo, you can use the built-in workload-performance-analysis CoCo skill to run diagnostic health checks and analyze historical query execution directly within Snowsight, CoCo CLI or Desktop. By asking natural language questions or using page context like Analyze with CoCo in Query Details, Query History or Performance Explorer, CoCo queries ACCOUNT_USAGE views to identify root causes behind disk spilling, poor partition pruning, low cache efficiency or bad clustering, while recommending optimizations such as Search Optimization Service (SOS) or Query Acceleration Service (QAS) candidates.
