Ebook
10x Faster Incident Troubleshooting: The AI SRE Playbook
Learn how AI-driven observability accelerates incident investigation, improves root cause analysis, and dramatically reduces MTTR.
Use Case
Correlate logs, metrics and traces across your full environment with the Observe by Snowflake AI SRE to pinpoint root cause and suggest fixes — wherever you work.
Overview
Investigate your full environment and surface root cause automatically with Observe by Snowflake AI SRE. Unify all telemetry and turn hours of investigation into minutes, at enterprise scale and lower cost.

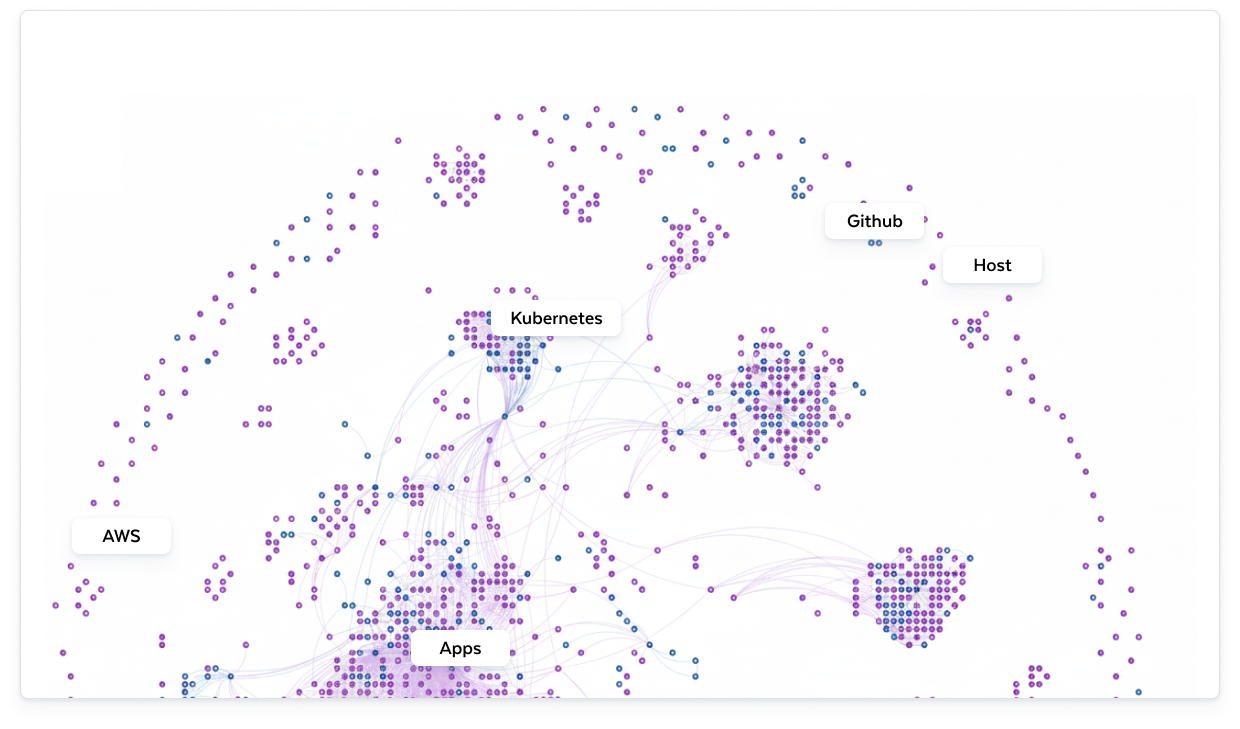
Map relationships across services and infrastructure, giving AI SRE the grounding to isolate root cause and cut investigation times.

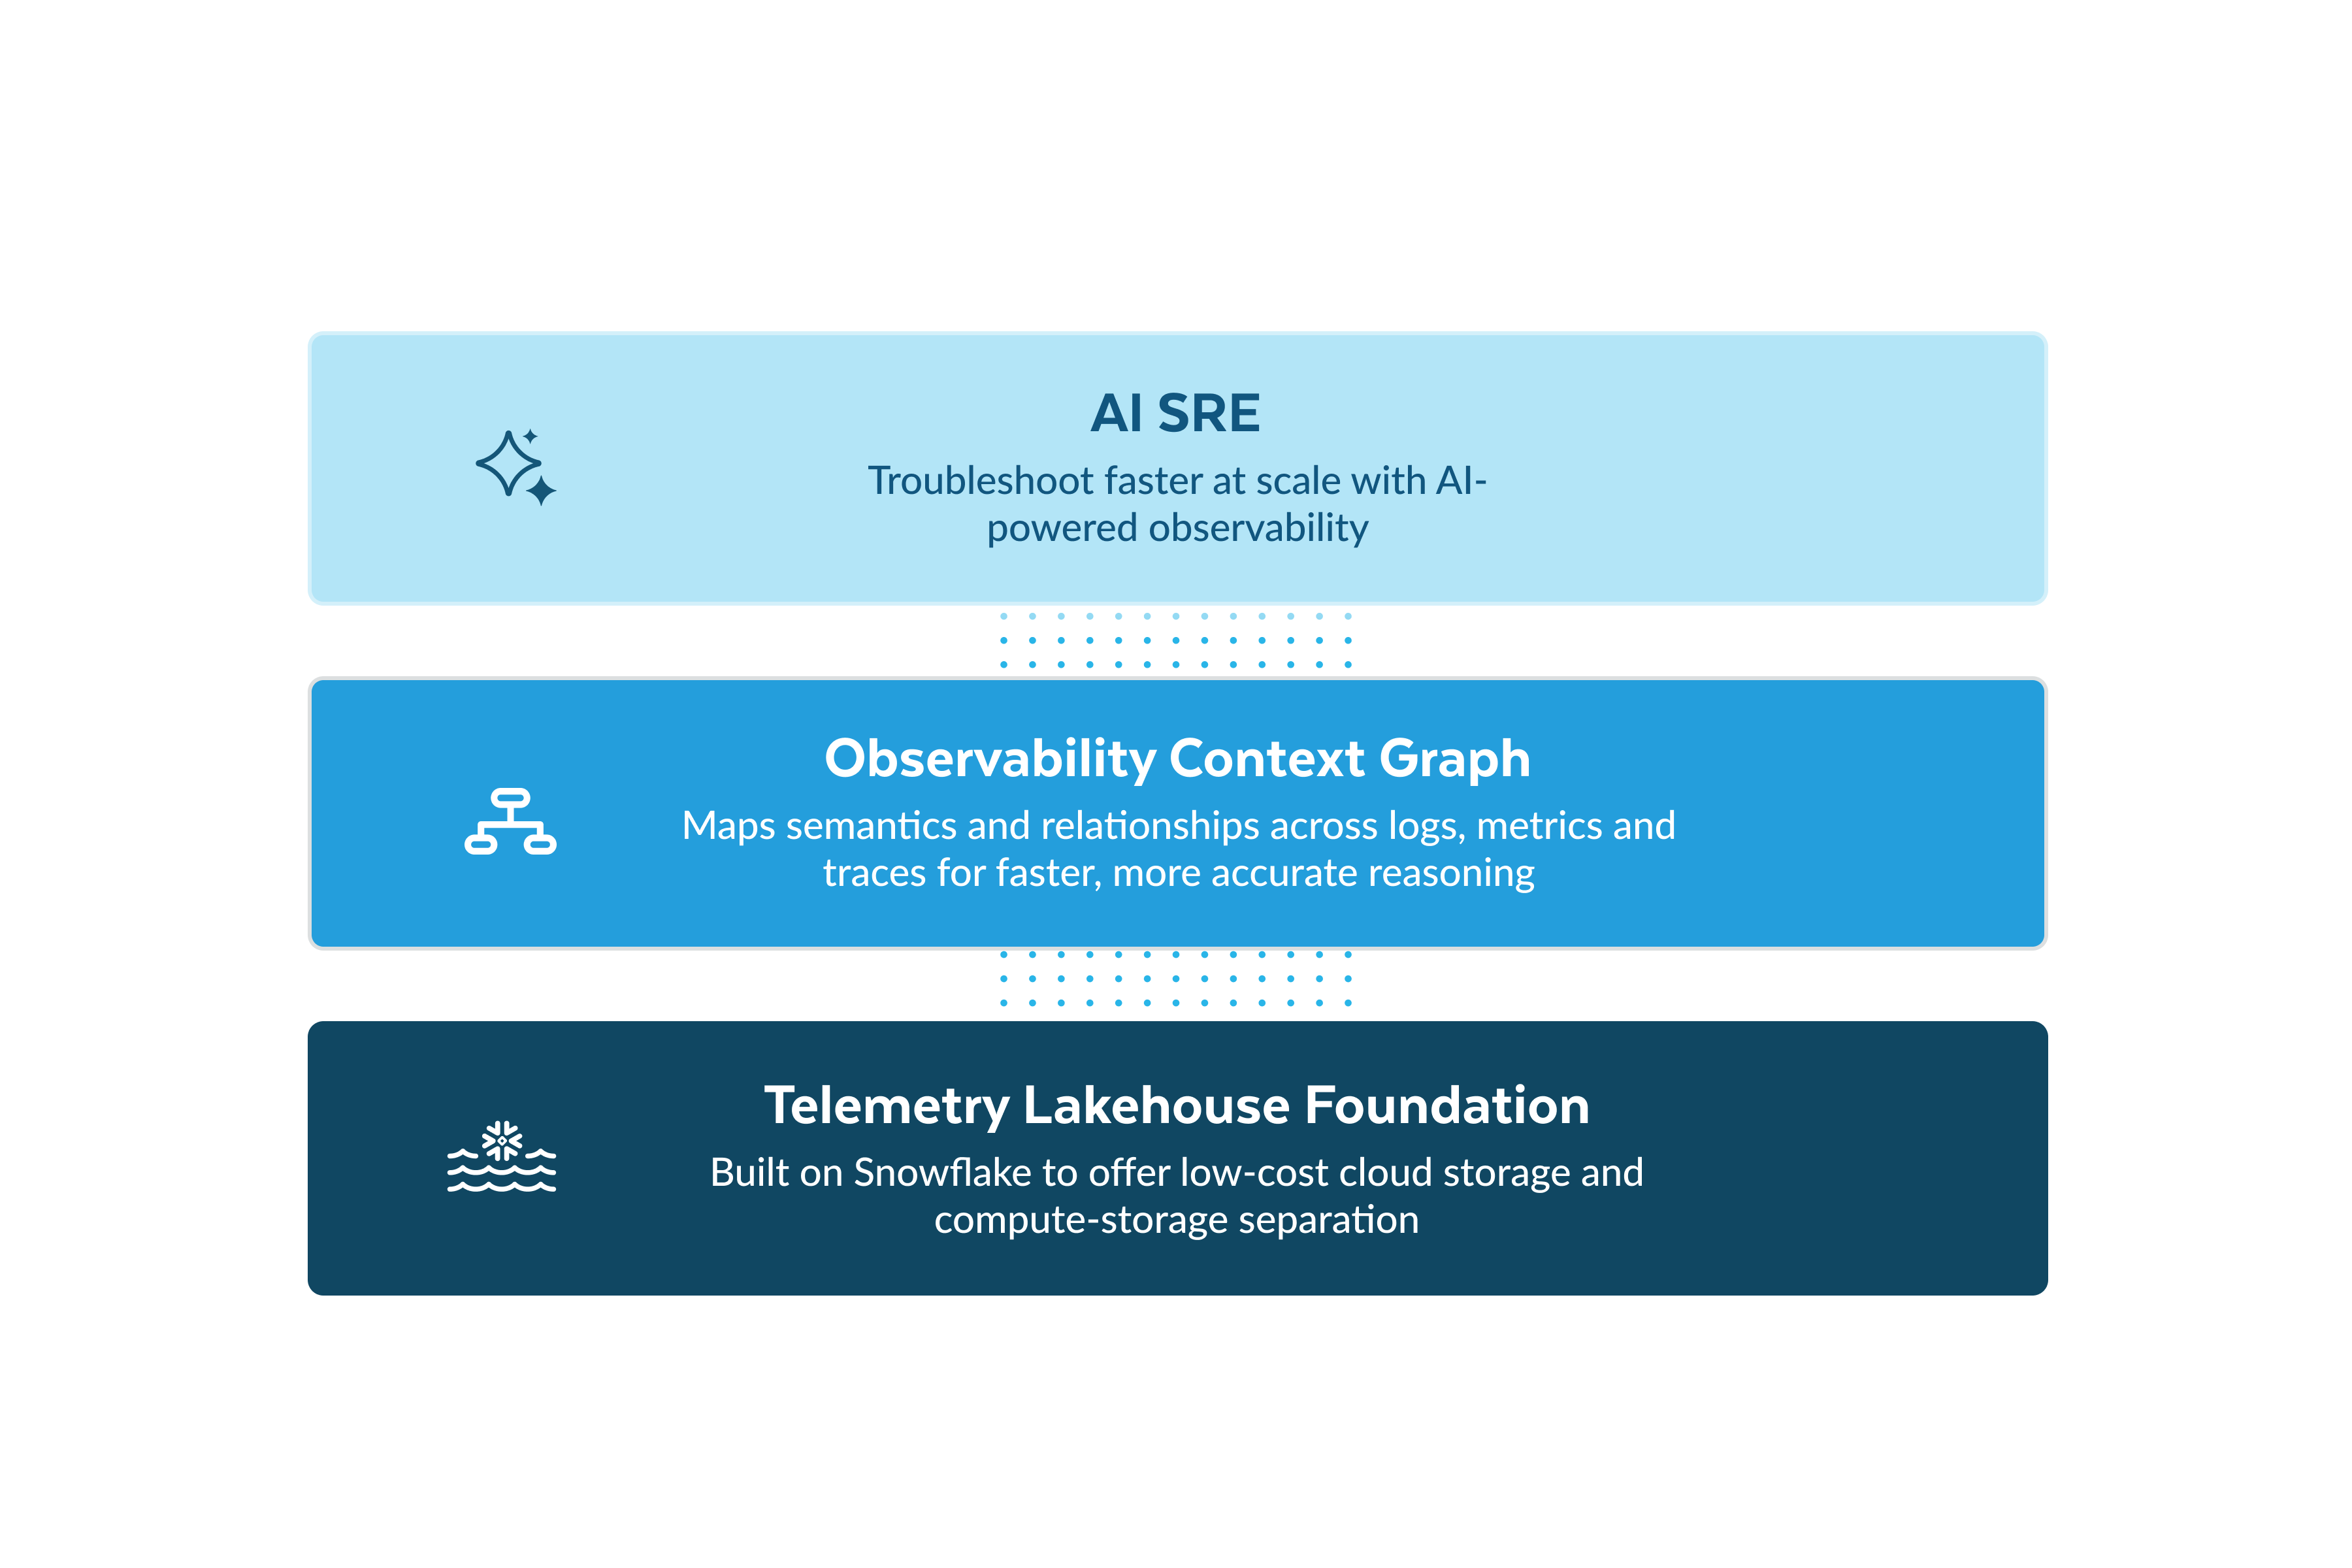
All telemetry flows into a unified, low-cost data lakehouse while the Observability Context Graph keeps AI queries efficient at scale.

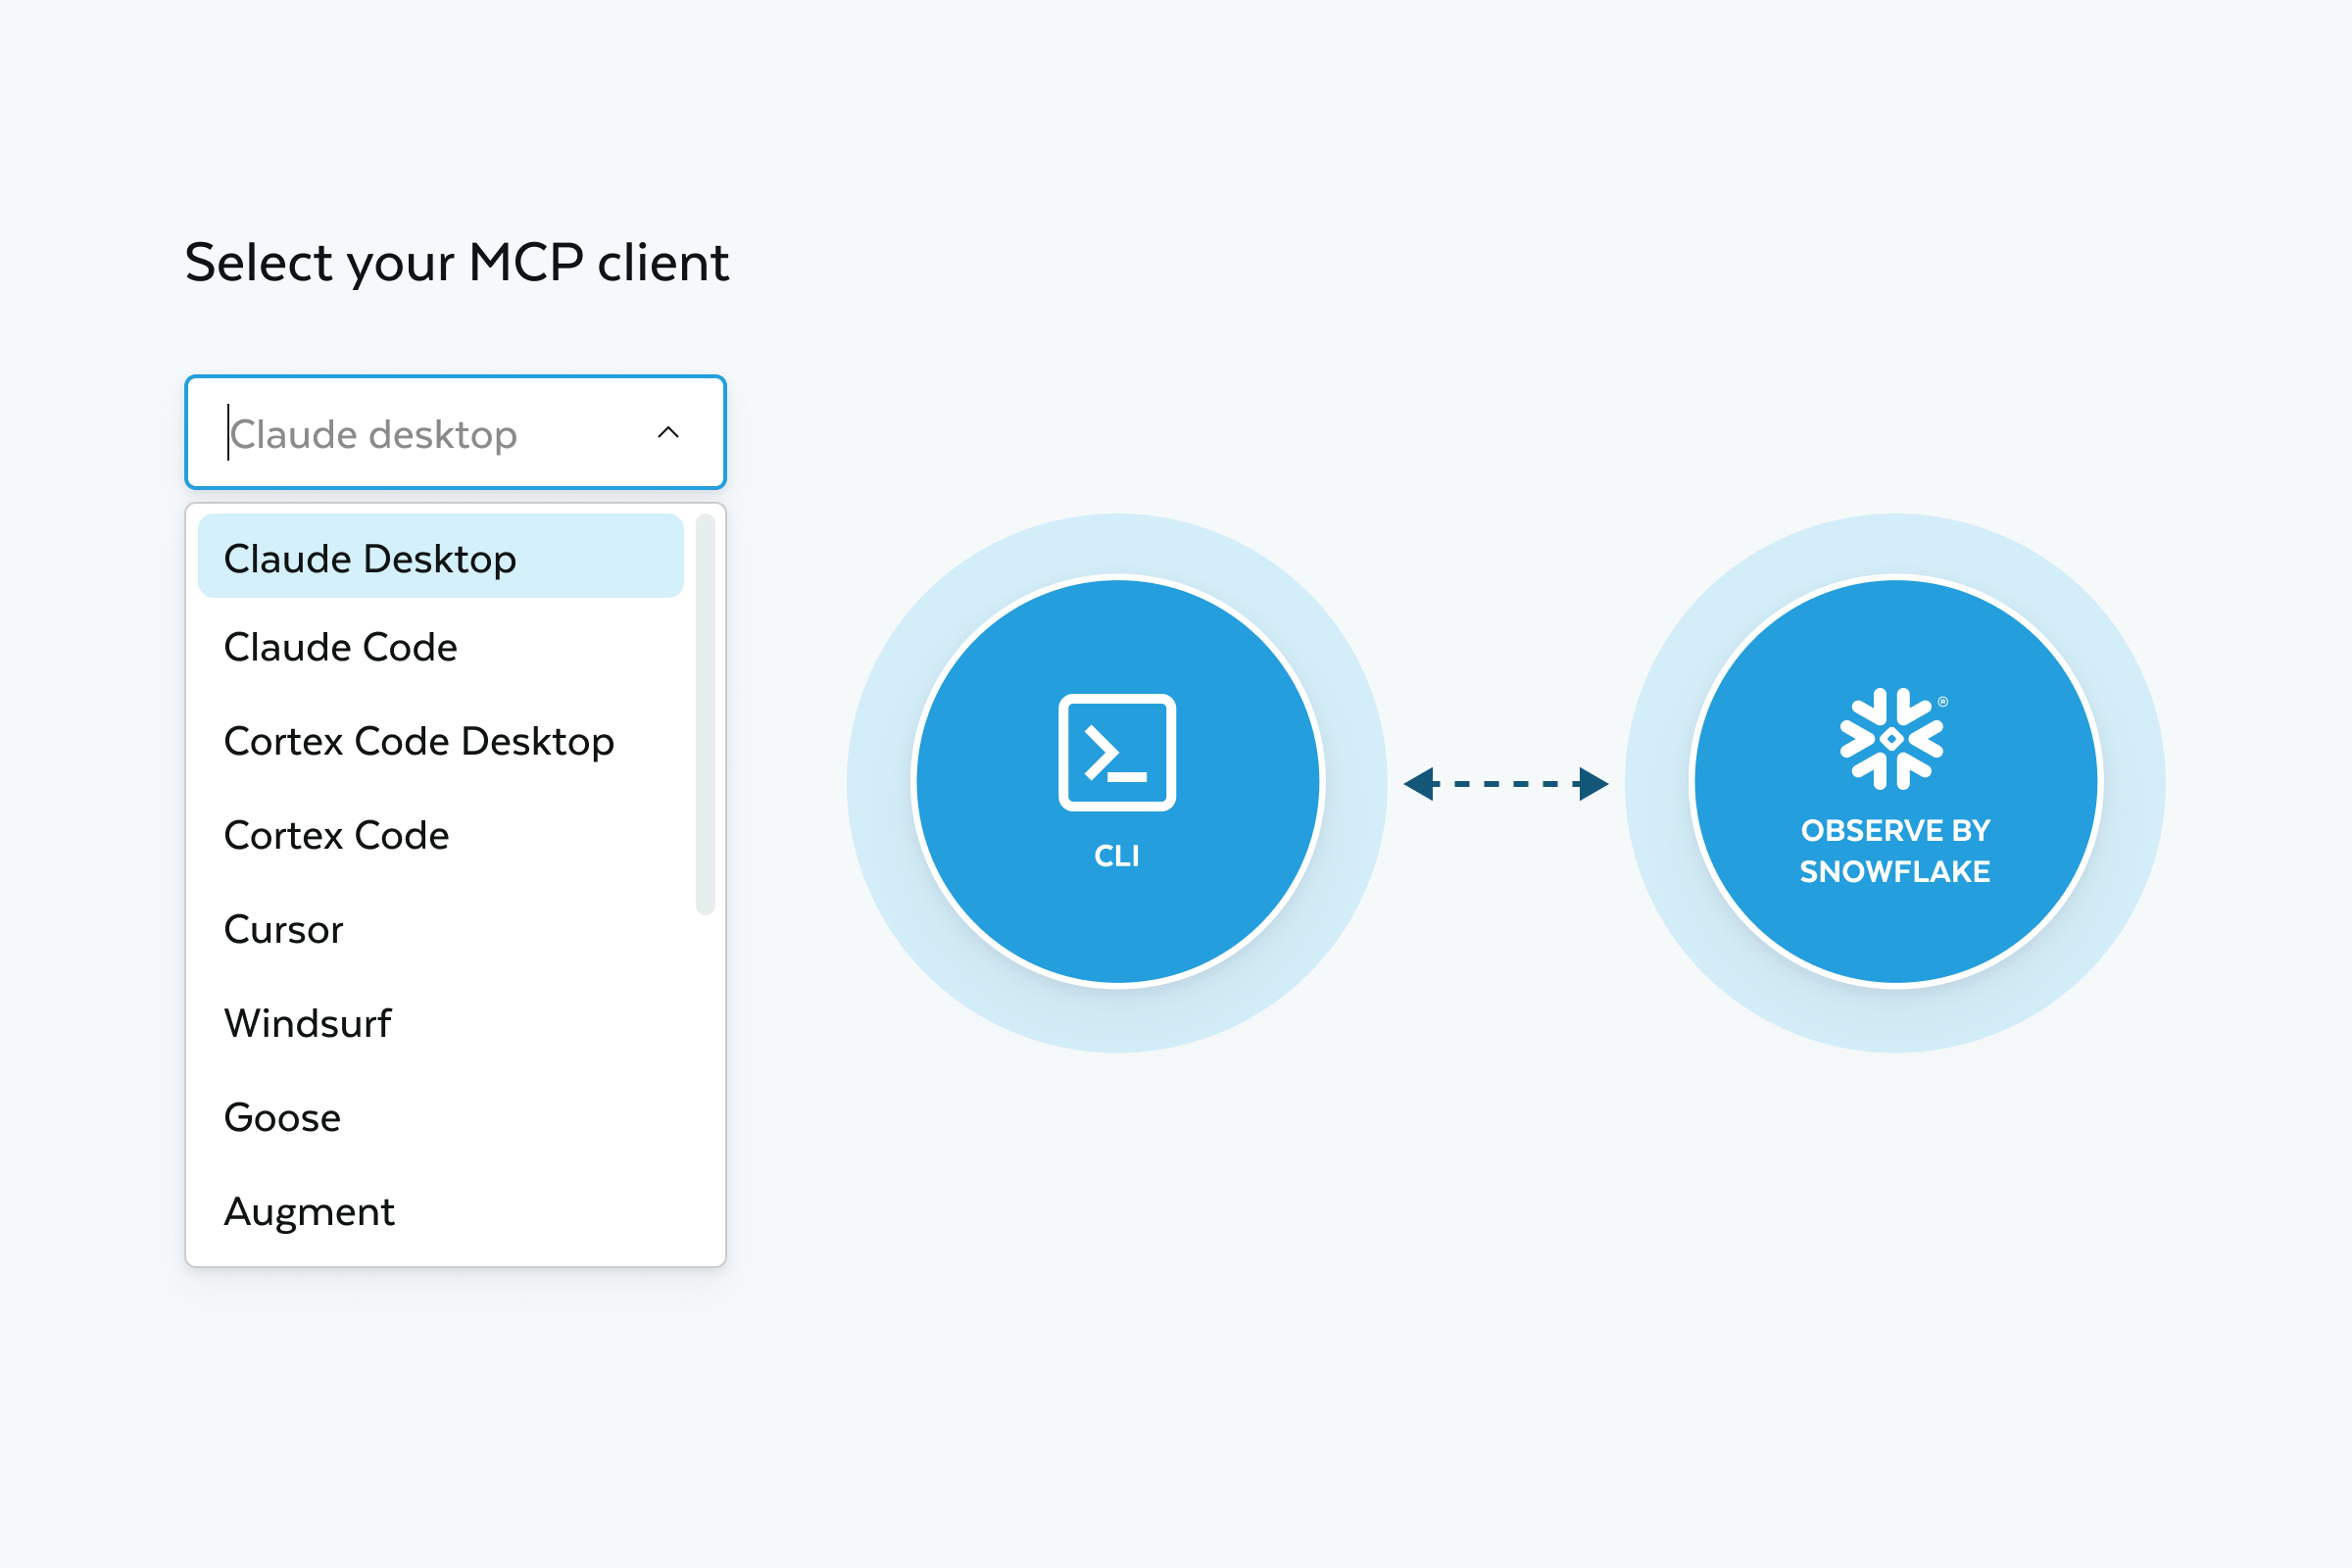
Investigate without leaving your IDE by connecting the Observe MCP Server to Cursor or Claude, or build custom agentic workflows with the CLI and API.
Benefits
Faster troubleshooting
Comprehensive Insights
Efficient by design
Operate at enterprise scale
Connect the Observe MCP Server to Cursor or Claude to troubleshoot directly from your IDE.
Access observability context programmatically via the Observe CLI for agent-driven investigation workflows.
Resources
Get Started
Performance at scale
Faster troubleshooting
Lower cost with an open data lake

Observe AI SRE
Get quick answers to your AI SRE questions and learn how Observe by Snowflake helps you troubleshoot faster at scale.
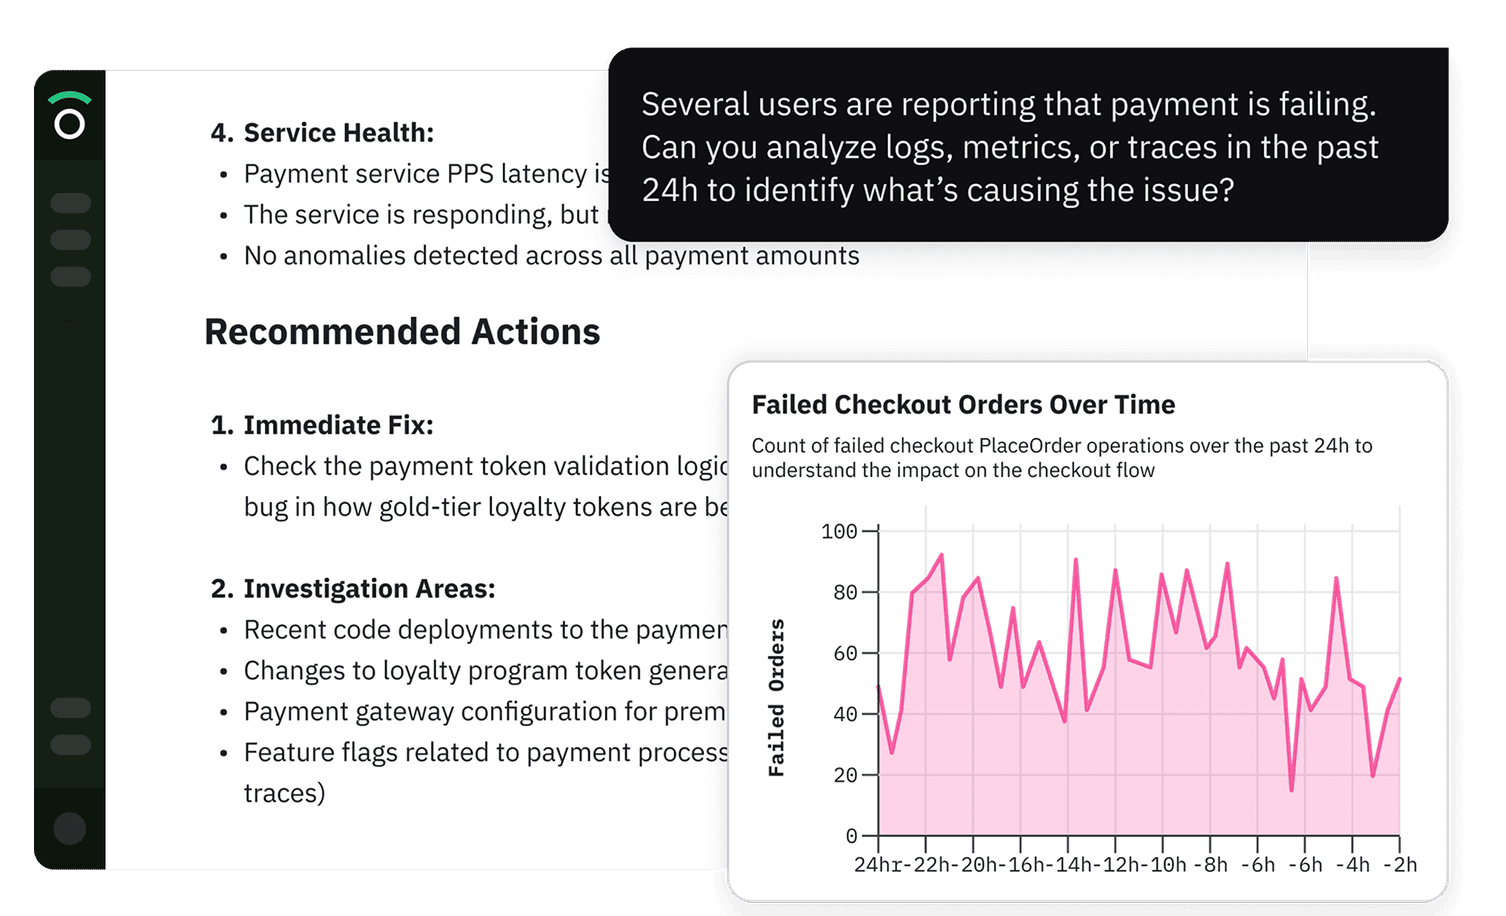
An AI SRE is an AI agent built for incident investigation. It correlates logs, metrics and traces across your environment, surfaces what triggered it, and suggests remediation steps so engineering teams can resolve incidents faster. Observe's AI SRE grounds its analysis in the Observability Context Graph, which maps the relationships across your services, infrastructure, logs, metrics and traces. Observe’s AI SRE primarily serves SREs and on-call engineers and is easily accessible through a chat interface in Observe.
Observe also brings AI assistance into the workflows your broader engineering team already uses, including log search, trace analysis and other surfaces across the product, so teams can benefit from AI assistance without adopting a new interface.
Modern engineering teams generate more telemetry than any team can manually synthesize, and the volume only grows with microservices, AI-generated code, and agentic workflows. Meanwhile, investigation remains the dominant contributor to MTTR. Observe's AI SRE closes that gap. Rather than pulling context from multiple tools and running queries across fragmented systems, engineers ask a question and the AI SRE correlates logs, metrics and traces across the full environment, drawing on the Observability Context Graph to understand service dependencies, recent deployments, and business impact–and returns findings with recommended actions. The result is faster resolution that's accessible across the whole team.
SREs and infrastructure engineers are the primary users, but AI SRE extends investigation capabilities across the team. Developers can troubleshoot production issues directly from their IDE via the Observe MCP Server. Support engineers can investigate incidents without needing deep system expertise. Engineering leaders can reduce dependency on a small number of senior experts and make faster resolution accessible to the entire team.
Most AI observability tools layer AI on top of fragmented, siloed data and pull from multiple systems with gaps and duplicates. Observe's AI SRE runs on a unified Telemetry Lakehouse Foundation where all telemetry is stored together and structured by an Observability Context Graph that maps entity relationships across your stack. The AI SRE has complete context, not a partial picture, which means fewer false positives and more actionable root cause analysis.
Observe's MCP Server lets engineers troubleshoot directly from AI coding agents like Cursor and Claude. An Observe CLI also provides programmatic, agent-driven access to observability context, including reusable workflows for common tasks like investigating incidents, tracing failures, or validating changes.