Why Real Workload Performance is the Metric that Matters


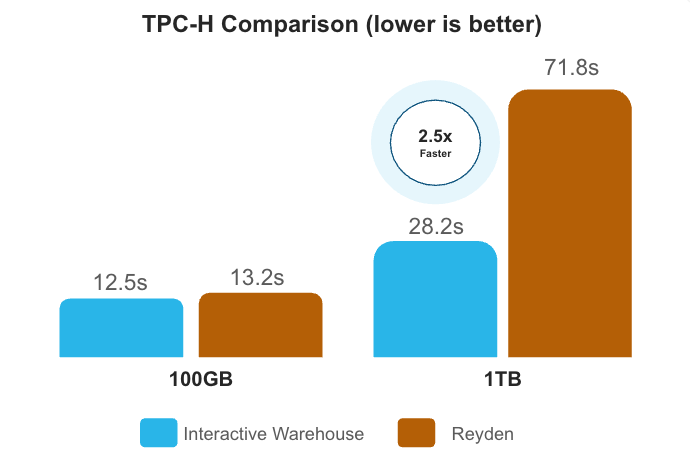
Benchmarks can produce misleading results when they use nonproduction workloads, misconfigured systems or unavailable products. When appropriately configured, Snowflake Interactive Analytics outperforms Databricks' Reyden (now in beta) based on the published numbers shared during the keynote at production-relevant scales (12.5s vs. 13.2s at 100 GB; 28.2s vs. 71s at 1 TB). Use the four-question framework in this blog to evaluate performance claims, including those from Snowflake.
Customers want predictable performance for their workloads. In practice, that means testing with their own queries and data when possible, using representative synthetic workloads when needed, and finally, relying on well-known benchmarks as an additional point of comparison.
However, many published benchmarks measure only a narrow slice of real-world performance. They rarely answer the question customers actually care about: how will my workloads perform at my scale, with my users and at my cost?
Here’s the framework we use to evaluate any benchmark, including our own.
Defining the problem: What real-time analytics actually requires
Interactive Analytics involves serving thousands of concurrent users, applications, dashboards and AI agents with sub-second latency, on data that changes continuously, with a query mix you can't fully predict. That combination stresses systems in ways traditional analytical benchmarks were not designed to expose: concurrency collapse, p95/p99 latency spikes, freshness gaps, cache dependence, queueing behavior and cost anomalies under bursty demand.
The TPC-inspired benchmarks that we often see in comparisons typically measure raw single-user throughput on a known workload and simple concurrency simulations based on a subset of data, often only a subset of query patterns. While this exercises a significant part of the functionality for data engines and are useful regression tests, it doesn't measure behavior under real-world load, latency distribution as users multiply, or cost as data scales from hundreds of gigabytes to hundreds of terabytes.
That distinction matters, and it’s important to keep in mind for every benchmark result that follows.
Four questions to ask about any benchmark
When you see a performance claim from us or from anyone else, these are the questions that can tell you if it translates to your situation.
1. Does the workload shape match yours? A single-user TPC-H power run and a 1,000-concurrent-user dashboard are different problems. If you're building for concurrency, single-user throughput numbers are the least predictive metric you can look at.
2. Is the configuration production-ready? Every platform has standard settings that trade raw benchmark scores for production reliability: connection handling, result caching, scale out support for higher concurrency workloads and more. Benchmarks that omit those settings are measuring something that won't exist in your deployment.
3. What happens as your data grows? Your data will grow, and your performance needs to keep up with the rapidly scaling demands. Benchmark results at larger sizes matter more than results at 1 GB.
4. Is the product available to you today? If a product is in beta with no general availability date, every benchmark comparison to it is a comparison to something you cannot deploy. There's also no way to know if the benchmark will hold by the time the product is GA ready. Factor that into how much planning weight you give it.
The framework in practice
A benchmark published by Databricks on June 16, 2026 illustrates each of these questions concretely. It compared their new Reyden engine against Snowflake Interactive, Snowflake Gen2 warehouse and another competitor across several data scales. Applying the four framework questions to those results shows exactly why benchmark methodology matters as much as the numbers themselves.1
1. Does the workload shape match yours?
The Databricks blog’s first chart shows P90 latency plotted against queries per second on a 2XL Snowflake interactive warehouse, on a 1 GB data set, using a single query run repeatedly with the same filter/predicate value. This is a synthetic single-query test, not representative of typical customer workloads today.
This test was run on a warehouse with no horizontal scale-out configured. Using Snowflake's multi-cluster warehouse functionality, interactive warehouses scale automatically, spreading thousands of concurrent queries across clusters rather than queuing them on a single cluster. The saturation point shown in the chart shifts dramatically to the right when the warehouse is configured as a real-world production deployment, while still maintaining sub-second tail latencies.
2. Is the configuration production-ready?
In the 2026 Data + AI Summit keynote, Databricks presented an absolute result showing Snowflake Interactive at 22.5 seconds at 100 GB versus Reyden at 13.2 seconds. We ran the standard TPC-H query set at 100 GB with appropriately sized interactive warehouses and tables, completing the run in 12.5s versus Reyden’s published 13.2s. Remember, however, that choosing the appropriate compute configuration is the first step in any deployment guide, and Reyden is currently in beta. When Reyden becomes generally available, we’ll be able to do a core-for-core comparison.
Then, at 1 TB scale, Snowflake Interactive is listed as "failed to run." We ran TPC-H at 1 TB with appropriately configured interactive warehouses with results of 28.2s versus Reyden’s published 71s.
Snowflake provides clear and transparent documentation on the data sets, queries and how to reproduce the above TPC-H results on Snowflake. You can run these full benchmarks in about an hour. We ran the above tests on a Large warehouse for the 100 GB test, and a 2XLarge for the 1 TB test. Read our documentation to get started, or ask Snowflake CoCo to help.
3. What happens as your data grows?
The 1 GB result is where Reyden looks performant. At 100 GB, the published comparison is materially affected by the warehouse setup issue noted above. At 1 TB, the published result reflects a timeout configuration that any production deployment would resolve. The benchmark results are strongest under conditions that differ materially from how many production analytics environments are configured. As a result, organizations should carefully evaluate how closely the test conditions align with their own workloads.
4. Is the product available to you today?
Reyden is currently in beta for read-only access as of June 25, 2026. It is not generally available. We are monitoring its progress and when it reaches general availability we will take a close look at the data volumes, query complexity and concurrency levels that real production workloads require.
What Snowflake actually measures
If TPC benchmarks don't reflect your production environment, what does?
We have a measurement that does. The Snowflake Performance Index (SPI) is specifically designed to be representative of what customers actually run, not what a benchmark prescribes. It tracks performance improvement on stable production customer workloads, real queries, real schemas and real billing.
SPI tracks a cohort of comparable stable customer workloads over time. By measuring the same workload mix against successive platform releases, SPI isolates platform improvements from changes in customer behavior. The statement type distribution matches the overall Snowflake production fleet within three percentage points across every query type. Over the last 12 months, SPI has improved by 33% and over the last two years it has improved by 84%.
Configuring Snowflake for your workload
Here’s what we recommend when setting up Snowflake for your workload.
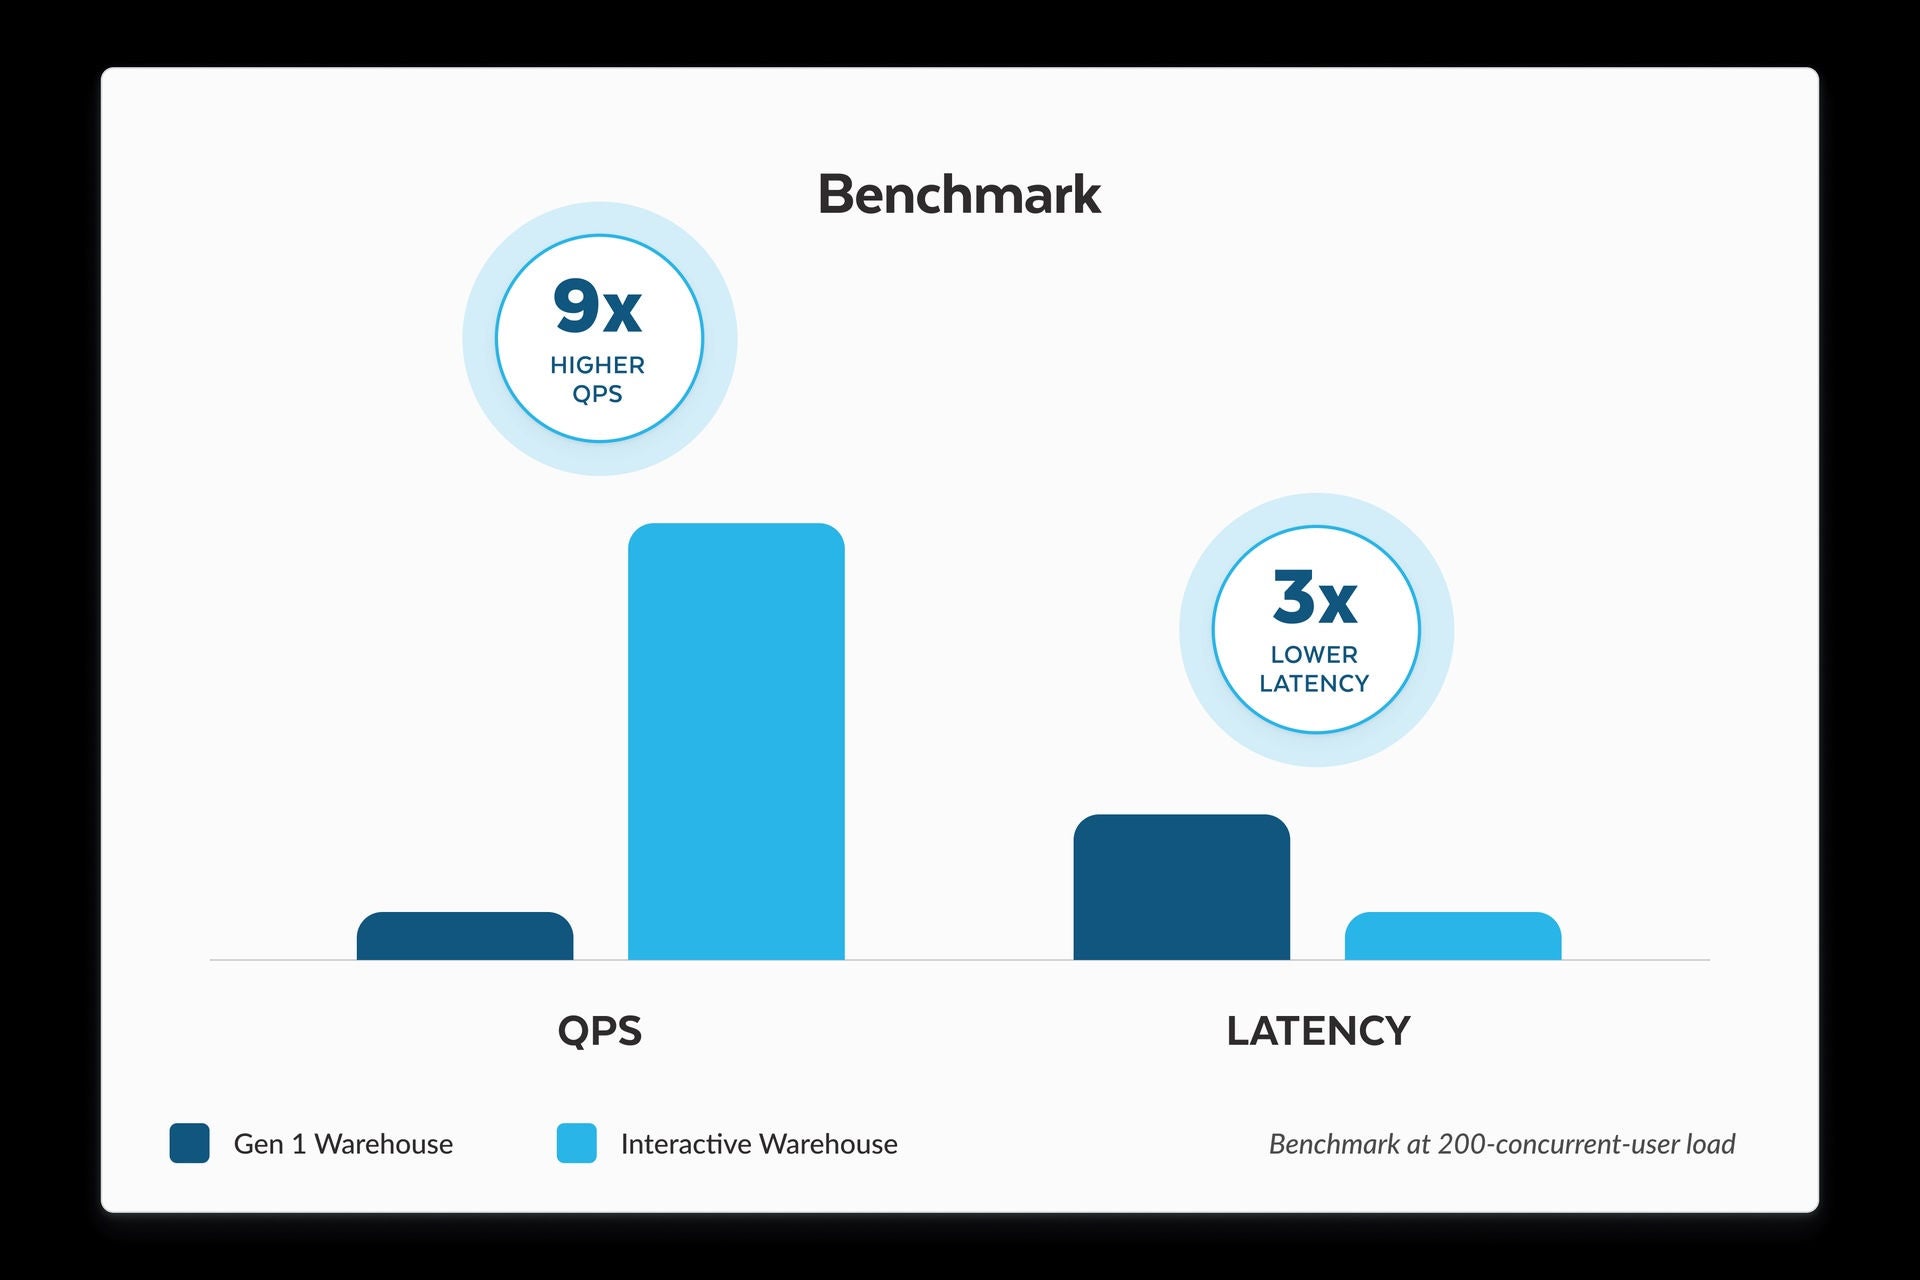
For high-concurrency, sub-second real-time analytics (dashboards, APIs, live applications): Use Snowflake interactive warehouse with multi-cluster warehouses enabled.
Use FALLBACK_WAREHOUSE for any query mix that includes complex queries alongside simple ones (this is standard production setup, not an edge case). Right-size by testing your actual query patterns at your actual data volume.
In internal benchmarks running interactive workloads,2 Snowflake interactive warehouses with multi-cluster scaling enabled showed 9x higher throughput and 3x lower latency compared to standard warehouses.
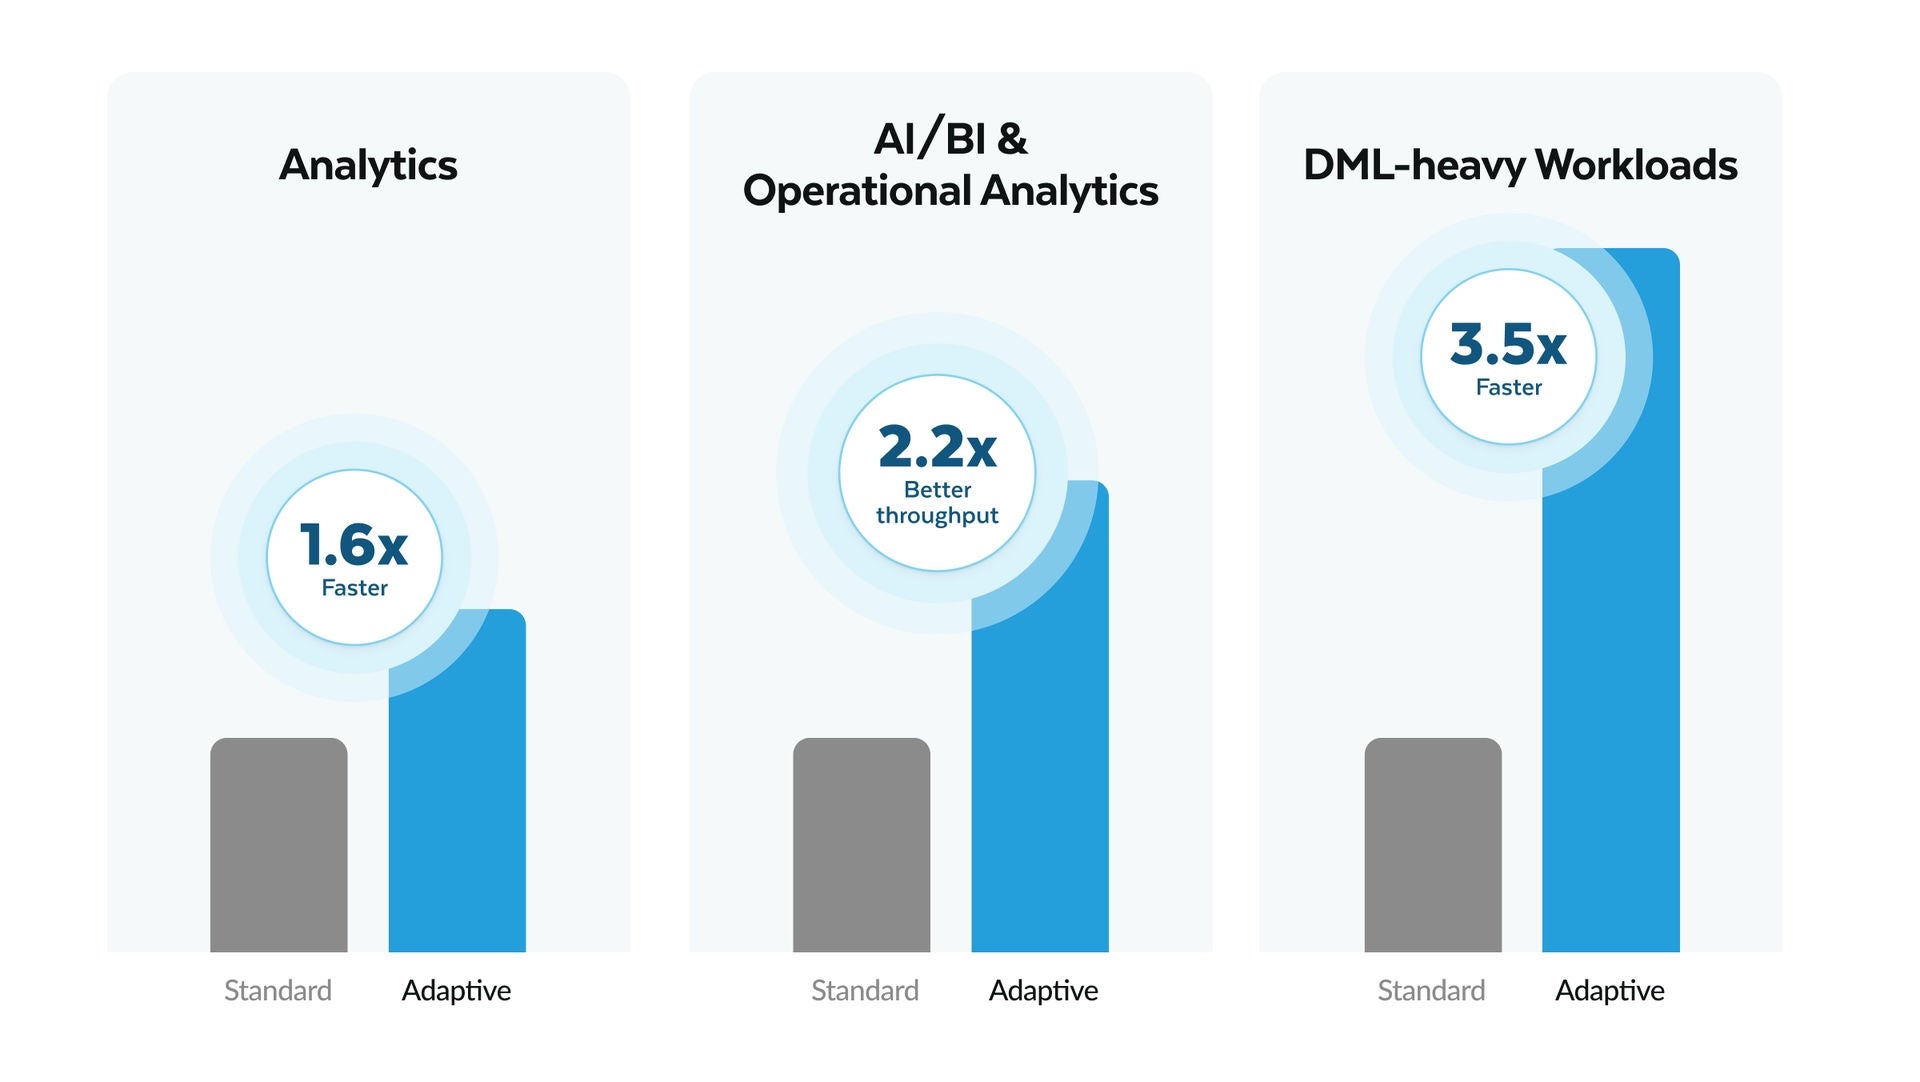
For more complex analytical workloads at scale (such as exploratory analytics, ETL, data engineering flows, mixed workloads, and data science): Use Adaptive Compute (now GA).
In published results, Adaptive delivers up to 1.6x faster analytical workloads and up to 2.2x higher throughput for highly concurrent operational analytics.
With Adaptive Compute, converting an existing warehouse is nondisruptive: you can run Adaptive and standard warehouses side by side and compare results directly on your data, with your actual billing, and get results that are directly relevant to your decision making.
In addition to newer innovations such as Snowflake Interactive Analytics, Adaptive Compute and Snowflake Optima, we continue to push performance boundaries through a combination of capabilities designed for real-world workloads, including recent optimizations such as:3
- Continuous plan optimization: By replacing static estimates with live feedback from query execution, Optima Planning autonomously adjusts join paths and plan structure, with some customers observing up to 500x faster query execution.
- Adaptive join logic: Our optimizer now adaptively selects join orders and handles range and inequality predicates more intelligently, resulting in massive efficiency gains, with the highest observed speedups of 400x and 230x for range scans in some of the most complex customer queries.
- Proactive skew management: Detecting data distribution imbalances at runtime, the engine now autonomously redistributes work during query execution, ensuring performance remains stable even on skewed data sets, with the highest observed speedup reaching 27x on individual customer workloads.
The benchmark that matters most: your workload
Benchmarks are useful engineering tools, but they can be poor purchasing guides, especially when they are optimized for headlines rather than production decisions.
Before accepting any published performance claim, including ours, ask four questions to get a better understanding of what the benchmark actually measures, what it did not measure and how to configure it for the workload you’re running:
- Does the workload match mine?
- Is the configuration production-ready?
- Does performance hold as data grows?
- Can I deploy this today?
Those answers matter far more than a headline benchmark score.
Note: Snowflake benchmarks are run in our production environment using only publicly available features that all customers have access to.
1 Reyden performance figures are derived from two Databricks sources: this blog, which published only relative numbers, and the 2026 Databricks Data + AI Summit keynote, where absolute numbers were referenced. Neither source documents test methodology, warehouse configuration or any other parameters enabled, which have been estimated. Full methodology available upon request.
2 Internal Snowflake testing. Full methodology available upon request.
3 Performance observations are based on specific observed workloads, and internal testing conditions. Results may vary depending on query structure, data distribution, workload patterns and warehouse configuration.
Cross-Region AI Inference, Data Residency and Sovereignty: How Snowflake Is Designed to Earn Your Trust

Simpler, Safer URLs: Introducing Per-Account Hostnames for Snowflake App Services

What's New in Apache Polaris™ 1.6
