Jul 14, 2026/10 min readData Engineering
TPC-H: What it is and how Snowflake did it in less than 11 seconds


In the modern data landscape, performance benchmarks are frequently thrown around to support various marketing claims.
Among these, the Transaction Processing Performance Council's TPC-H benchmark remains one of the most cited, debated and scrutinized tests. In fact, it has been recently cited in several conferences and blog posts both from Databricks and ClickHouse.
Snowflake Interactive Warehouses offer impressive performance, as anyone using it can already confirm. Snowflake has run its own TPC-H benchmark and published the results openly so anyone can reproduce them:
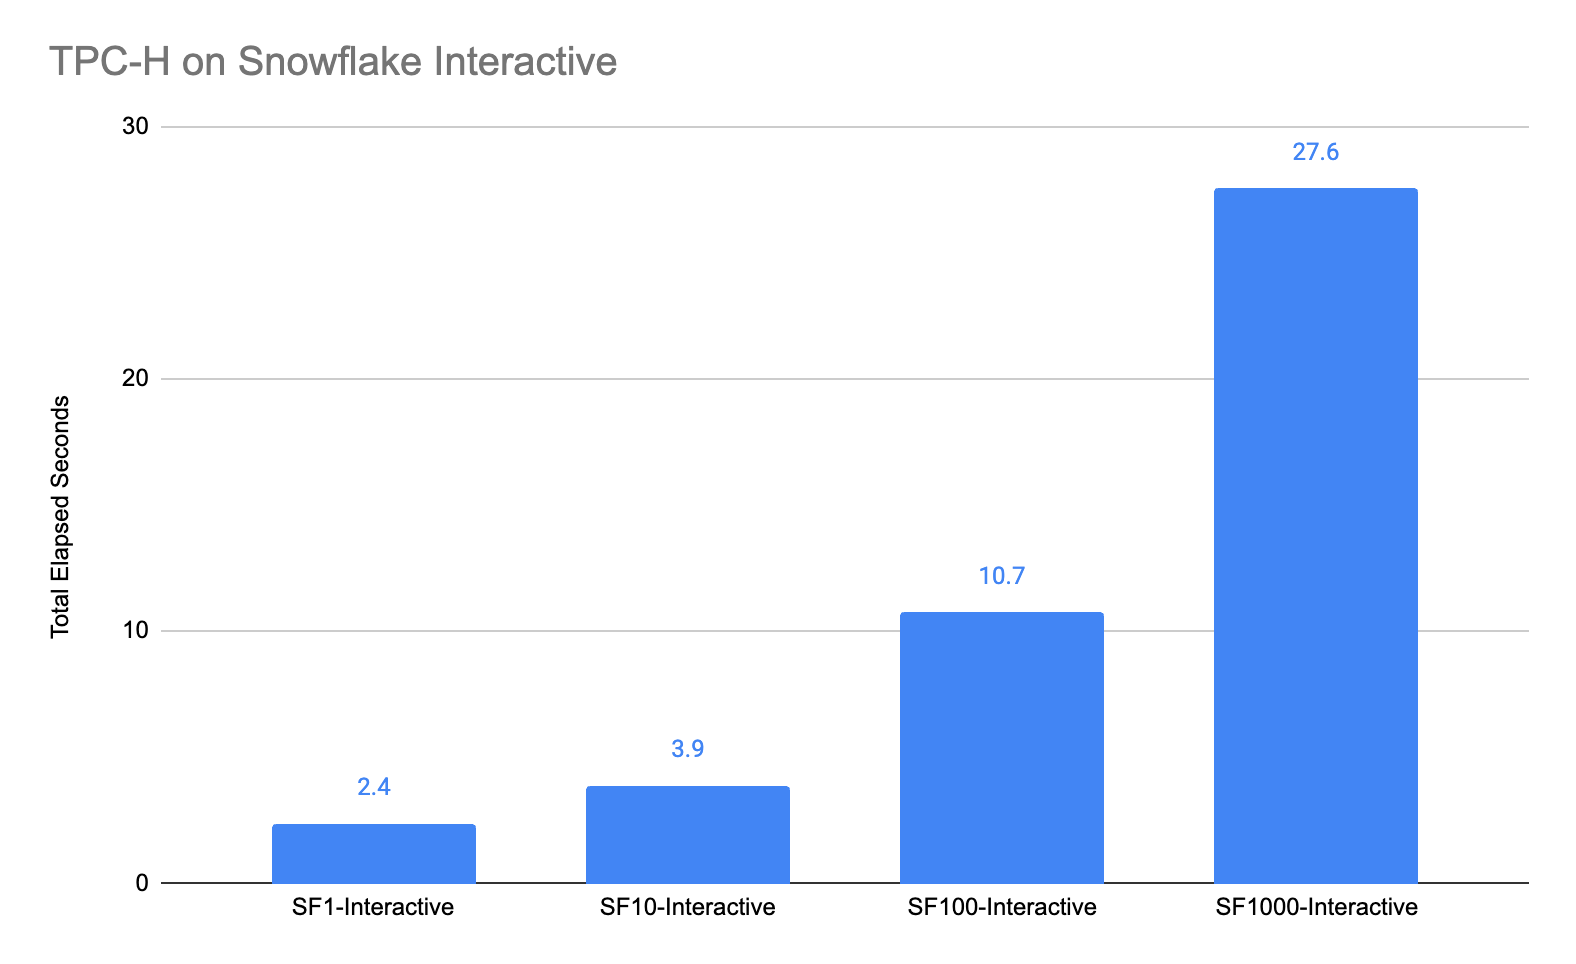
Snowflake Interactive Warehouses can run all 22 TPC-H queries on 100GB of data in less than 11 seconds.
Benchmark results can vary based on configuration, methodology and workload assumptions. When we put Snowflake to the test, how does it manage to tear through a 100GB data set and complete the entire 22-query benchmark in less than 11 seconds? How is it that a tenfold expansion of the data set merely doubles the execution window? This scaling efficiency isn't magic: It's the result of profound architectural engineering operating under the hood.
This post dives deep into the anatomy of TPC-H, the optimizer challenges it presents and the underlying engineering that enables Snowflake to deliver near real-time interactive analytics at scale.
The anatomy of TPC-H: why it remains an industry reference
TPC-H is a decision support benchmark. Unlike transactional benchmarks that measure how quickly a database can process millions of tiny, concurrent inserts and updates, TPC-H evaluates how effectively a system can analyze massive volumes of historical data.
The benchmark simulates the activity of a wholesale supplier business, consisting of a schema with eight tables (such as Orders, LineItem, Customer and Supplier) and a suite of 22 ad hoc queries.
Introduced decades ago, the benchmark is structurally very simple. In fact, it has technically been superseded by the more intricate TPC-DS benchmark. Yet, TPC-H remains an industry reference and is still commonly used across the industry today. The reason is simple: It provides fundamental challenges that mirror the pain points commonly found in real-world analytical workloads.
When a business intelligence analyst drags and drops fields in a BI tool, it generates complex SQL containing massive joins and aggregations on the fly. The queries in TPC-H are an excellent proxy for evaluating whether a data warehouse will return that dashboard in seconds or leave the analyst staring at a loading spinner.
Beyond the surface: the 28 "choke points" of TPC-H
To understand why a ~11-second completion time at the 100GB Scale Factor (SF100) is so impressive, we have to look under the hood. The TPC-H benchmark evaluates more than raw throughput; it is engineered to exercise a sophisticated array of operators and intricate selectivity constraints, placing pressure on the architectural engine of the system under scrutiny.
As formalized by database researchers Peter Boncz, Thomas Neumann and Orri Erling in their paper TPC-H Analyzed, and further explored through the deep-dive architectural reviews on The Database Doctor blog, the benchmark is defined by a set of "choke points." A choke point is a specific technological hurdle underlying a workload; resolving it requires advanced engine mechanics and separates a modern massively parallel processing (MPP) architecture from a legacy system.
Researchers identified 28 distinct choke points within TPC-H, falling into categories like Aggregation Performance, Join Performance, Data Access Locality, Expression Calculation, Correlated Subqueries and Parallel Execution.
Here is a look at how some of the specific TPC-H queries leverage these choke points to test a database:
- Correlated subqueries (Queries 2 and 17): Query 2 finds which supplier should be selected to place an order for a given part, and Query 17 determines the average yearly revenue that would be lost if small quantity orders were dropped. These feature heavy correlated subqueries. A naive database engine will run these using nested loops, resulting in disastrous quadratic time complexity. The benchmark tests if the query optimizer is smart enough to "flatten" or decorrelate these subqueries into highly efficient joins.
- Join ordering and heap sorting (Query 3): This query retrieves the 10 unshipped orders with the highest value. When joining multiple large tables, the math behind choosing the execution path is critical. This choke point tests whether the database can correctly choose between a "left-deep" or "bushy" tree, and whether it can accurately identify the optimal "driving table" to minimize memory consumption versus rows joined.
- Aggregation performance and data locality (Query 10): This query identifies customers who might be having problems with shipped parts. To run complex group-bys efficiently, databases must estimate cardinality accurately. This tests how well the database uses column statistics (histograms) and leverages Primary Key/Foreign Key relationships to group data earlier in the execution plan, keeping data local and saving massive amounts of memory.
- Expression calculation and push-down (Query 19): Reporting the gross discounted revenue attributed to the sale of selected parts, this query features highly complex OR and IN conditions. The optimizer is tested on its ability to rewrite these expressions and "push them down" the execution plan, filtering data as close to the storage disk as possible before it clogs up compute resources.
- Parallel execution (Bloom filters): When executing massive multiway joins across a distributed network (like in Query 5, which lists revenue volume through local suppliers), shipping raw data across nodes is a massive bottleneck. The benchmark exposes whether an MPP system uses advanced parallel execution mechanisms, like Bloom filters, to probabilistically discard non-matching rows before they are sent across the network.
Data modeling best practices: how to unlock peak performance
Reaching subsecond response times, on some individual queries, on meaningful volumes of data requires intentional data modeling. Snowflake does an incredible amount of heavy lifting automatically, but aligning your physical data design with the workload is the key to unlocking peak performance.
1. The power of pruning: setting the right clustering key
From a data modeling perspective, defining an effective clustering key is one of the most critical actions you can take. Snowflake relies on metadata to automatically maintain the minimum and maximum values for every single column inside each micro-partition. When data is natively sorted or structured via a clustering key, this min/max tracking becomes extremely effective.
For example, by choosing L_SHIPDATE as the clustering key for the massive LINEITEM table, you dictate how data is co-located on storage. Because the vast majority of TPC-H queries filter on date ranges or timeline boundaries, this alignment allows Snowflake to skip nonrelevant micro-partitions entirely. The engine instantly targets the exact partitions it needs, drastically cutting I/O.
2. Optimizer context: relying on constraints
In analytical databases, primary keys are historically informational rather than strictly enforced constraints. However, explicitly defining your Primary Key constraints and explicitly marking them as Reliable — since Snowflake, being first and foremost a massively parallel processing warehouse system, doesn't enforce them — gives Snowflake's query optimizer usable metadata information.
When a constraint is marked as reliable, the optimizer safely assumes the uniqueness of those keys during compilation. This lets it make advanced structural assumptions, such as safely eliminating redundant joins, rewriting aggregations early or trusting functional dependencies, substantially accelerating the execution plan for multitable queries.
Demonstrating Snowflake's architectural advantage in ~11 seconds
Processing the full 22-query TPC-H suite against 100GB of data in about 11 seconds requires quite a lot of technology that just works for you behind the scenes, distributing compute on several nodes for scale out, but also using fine-tuned optimization techniques to get the best from each byte of resource available in those nodes. Snowflake achieves this through three foundational pillars that directly answer the optimizer challenges listed above:
1. Micro-partitioning and dynamic pruning
By leveraging the metadata mentioned above, Snowflake doesn't scan entire tables. It precisely isolates the data blocks that fall within the query's criteria. Pruning is automatic, native, and dynamically handles ad hoc filters without traditional index management burden.
2. Masterful multiway joins via runtime filtering
Snowflake's query optimizer excels at the exact "Join Ordering" math required by analytical queries like the one represented by TPC-H workload. More importantly, Snowflake utilizes dynamic runtime filtering, and it specifically relies on advanced Bloom filters and broadcast joins. This allows Snowflake to seamlessly run complex queries by minimizing the amount of data shuffled across compute nodes, dodging the network bottlenecks that choke traditional distributed architectures.
3. The new path: Interactive Analytics
The final piece of the puzzle is the newly released Snowflake Interactive Analytics. Standard data warehouses often treat massive batch ETL jobs and low-latency dashboard queries as the same thing, but true interactive workloads, which are typically read-heavy, highly concurrent, bursty and demand low variance, call for fundamentally different system trade-offs. By explicitly designating a warehouse for interactive analytics, you provide a "hint" that allows the Snowflake engine to make these specialized decisions with confidence.
The system dynamically tunes itself for low-latency retrieval through smart maintenance of the storage representation and by utilizing CPU-friendly encoding and compression schemes. Furthermore, it employs strict resource scheduling to prevent long-running queries from starving resources, and maximizes caching, keeping execution caches "warm" on local NVMe SSDs within the proven multi-cluster, shared-data architecture. Ultimately, these targeted trade-offs ensure that rapid-fire, ad hoc queries (like those represented in TPC-H Query 6 or Query 15) consistently achieve subsecond latency even at massive scale.
Scaling to 1TB: the 10x data challenge
What happens when we increase the data set by a factor of 10, jumping from 100GB to the massive 1TB (SF1000) scale factor? In traditional systems, a 10x increase in data may lead to an exponential degradation in performance.
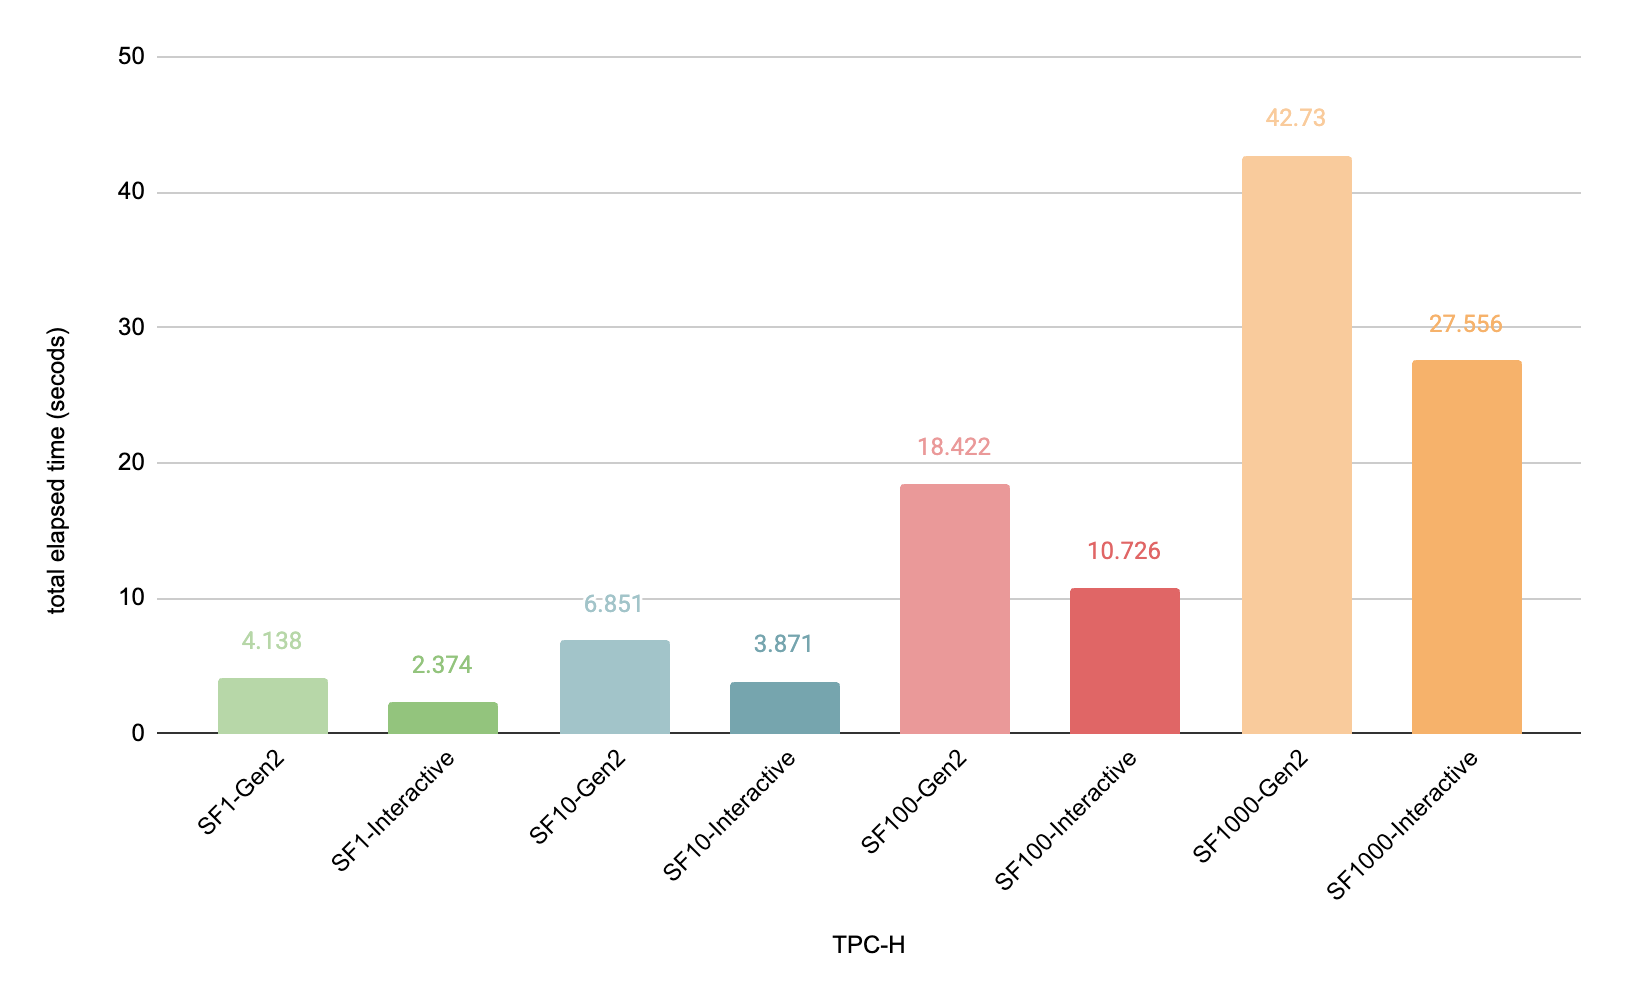
Thanks to Snowflake's elastic scalability, performance remains remarkably fast. Despite the data being 10 times larger, the total runtime merely doubles. This efficient scaling curve proves that the optimizer and execution engine can effortlessly distribute and conquer massive workloads without breaking a sweat.
As illustrated in the chart below, when comparing regular Gen2 warehouses against the new Interactive Warehouses at this scale, the results are undeniable. Interactive Warehouses are not only significantly faster, benefiting from built-in automatic caching and an optimized analytical engine, but they are also highly cost-effective. In fact, Interactive Warehouses are priced at only 0.6 credits per hour (on XSMALL), which translates to a rare win-win: blazing-fast, predictable performance at a fraction of the cost.
Conclusion
TPC-H is a valuable tool for understanding an analytical system's behavior and setting realistic performance expectations. It can expose platforms that may lack the sophisticated query planning required to handle multiway joins, subquery de-correlation and massive data shuffling.
By combining a world-class proprietary optimizer, zero-maintenance data pruning, intentional data modeling and the raw speed of Interactive Warehouses, Snowflake effortlessly navigates the optimizer gauntlet. The result is an open, repeatable benchmark where a 100GB data set is analyzed in under 11 seconds, proving that you can achieve the speed of a dedicated serving layer with the governance, simplicity and scale of your primary AI Data Cloud.
However, performance and scalability are just pieces of the puzzle when building a trusted enterprise data platform. Snowflake delivers on these core metrics, as demonstrated by TPC-H, while also bringing the robust security, AI capabilities and programmability required to offer a truly credible, unified and modern data platform.
