Monitoring and Observability for Hybrid Tables
Monitoring and Observability for Hybrid Tables
Overview
Note on Production Workloads: The monitoring queries in this guide use
SNOWFLAKE.ACCOUNT_USAGEviews which have up to 3 hours of latency. For real-time diagnosis of individual queries, use Query Profile in Snowsight.
Hybrid Table workloads are invisible to traditional Snowflake monitoring. Queries completing in under one second do not appear in QUERY_HISTORY, and standard dashboards built on that view will show zero activity even while thousands of operations per second are executing successfully.
This guide builds a complete observability stack for Hybrid Table workloads:
- Understanding the monitoring gap and where to find HT telemetry
- Extracting latency percentiles, throughput, and error rates from AGGREGATE_QUERY_HISTORY
- Building monitoring dashboards for ongoing visibility
- Tracking credits and storage against quotas
- Creating multi-signal alerts (throttling, latency regression, error spikes)
- Building custom monitoring apps (Streamlit, Snowflake Native Apps, OpenTelemetry)
- Exporting metrics to external tools (Datadog, Grafana, Prometheus)
What You Will Learn
- Why
QUERY_HISTORYmisses most HT activity and what to use instead - How to read OBJECT-typed columns (avg, median, p90, p99, max) in AGGREGATE_QUERY_HISTORY
- How to build monitoring dashboards with latency trends and throughput
- How to track HT credit consumption and storage against the 2 TB per-database quota
- How to create alerts for throttling, latency regression, and error spikes
- How to export HT metrics to external observability platforms
- How to build custom monitoring dashboards with Streamlit in Snowflake
Prerequisites
- A Snowflake paid account in an AWS or Azure commercial region
- Familiarity with Hybrid Tables and basic SQL
- ACCOUNTADMIN role (used in this guide for simplicity) or any role with access to
SNOWFLAKE.ACCOUNT_USAGEviews and the ability to create alerts - An existing Hybrid Table workload with some query activity (or run the setup below to simulate one)
Note on Roles: This quickstart uses ACCOUNTADMIN for simplicity. In production, grant
IMPORTED PRIVILEGESon theSNOWFLAKEdatabase to a custom role and use that instead. Any role with access toSNOWFLAKE.ACCOUNT_USAGEviews can run the monitoring queries.
Setup
USE ROLE ACCOUNTADMIN;

CREATE OR REPLACE ROLE HT_MON_QS_ROLE;
GRANT ROLE HT_MON_QS_ROLE TO ROLE ACCOUNTADMIN;

CREATE OR REPLACE WAREHOUSE HT_MON_QS_WH
  WAREHOUSE_SIZE = XSMALL
  AUTO_SUSPEND = 300
  AUTO_RESUME = TRUE;
GRANT OWNERSHIP ON WAREHOUSE HT_MON_QS_WH TO ROLE HT_MON_QS_ROLE;

CREATE OR REPLACE DATABASE HT_MON_QS_DB;
GRANT OWNERSHIP ON DATABASE HT_MON_QS_DB TO ROLE HT_MON_QS_ROLE;

USE ROLE HT_MON_QS_ROLE;
CREATE OR REPLACE SCHEMA HT_MON_QS_DB.DATA;
USE WAREHOUSE HT_MON_QS_WH;
USE DATABASE HT_MON_QS_DB;
USE SCHEMA DATA;
Create a Sample Workload Table
CREATE OR REPLACE HYBRID TABLE session_state (
    session_id   VARCHAR(36)    NOT NULL,
    user_id      NUMBER         NOT NULL,
    device_type  VARCHAR(20)    NOT NULL,
    last_active  TIMESTAMP_NTZ  NOT NULL,
    payload      VARIANT,
    PRIMARY KEY (session_id)
);

CREATE INDEX idx_session_user ON session_state (user_id);
Generate Sample Data
INSERT INTO session_state
SELECT
    UUID_STRING() AS session_id,
    UNIFORM(1, 10000, RANDOM()) AS user_id,
    ARRAY_CONSTRUCT('mobile','desktop','tablet')[UNIFORM(0,2,RANDOM())]::VARCHAR AS device_type,
    DATEADD(MINUTE, -UNIFORM(1, 1440, RANDOM()), CURRENT_TIMESTAMP())::TIMESTAMP_NTZ AS last_active,
    OBJECT_CONSTRUCT('ip', '10.0.' || UNIFORM(0,255,RANDOM())::VARCHAR || '.' || UNIFORM(0,255,RANDOM())::VARCHAR) AS payload
FROM TABLE(GENERATOR(ROWCOUNT => 50000));
Simulate Workload Activity
Run several queries to generate telemetry in AGGREGATE_QUERY_HISTORY (visible after up to 3 hours):
SELECT * FROM session_state WHERE session_id = (SELECT session_id FROM session_state LIMIT 1);
SELECT * FROM session_state WHERE user_id = 42;
UPDATE session_state SET last_active = CURRENT_TIMESTAMP()::TIMESTAMP_NTZ WHERE session_id = (SELECT session_id FROM session_state LIMIT 1);
DELETE FROM session_state WHERE last_active < DATEADD(DAY, -1, CURRENT_TIMESTAMP())::TIMESTAMP_NTZ;
Note: AGGREGATE_QUERY_HISTORY has up to 3 hours of latency. If you are running this guide for the first time, you may need to wait before the monitoring queries return data. The SQL patterns are valid regardless — apply them to your own existing HT workloads for immediate results.
Step 1: The Monitoring Gap
Why QUERY_HISTORY Misses Hybrid Table Activity
USE ROLE ACCOUNTADMIN;

SELECT COUNT(*) AS queries_in_history
FROM SNOWFLAKE.ACCOUNT_USAGE.QUERY_HISTORY
WHERE start_time > DATEADD(DAY, -1, CURRENT_TIMESTAMP())
  AND total_elapsed_time < 1000
  AND query_type IN ('SELECT', 'INSERT', 'UPDATE', 'DELETE', 'MERGE');
Standard QUERY_HISTORY captures individual query executions — but queries completing in under ~1 second are often excluded or sampled. For OLTP workloads executing thousands of sub-second operations per minute, this creates a blind spot.
Where HT Telemetry Lives
| View | What It Shows | Latency | Granularity |
|---|---|---|---|
AGGREGATE_QUERY_HISTORY | All queries (including sub-second), aggregated per minute per query shape | Up to 3 hours | 1-minute windows |
HYBRID_TABLE_USAGE_HISTORY | Credits consumed by HT background operations | Up to 3 hours | Per-table, hourly |
TABLE_STORAGE_METRICS | Storage bytes per table (active, time travel, failsafe) | Up to 3 hours | Per-table |
METERING_HISTORY | Overall warehouse credits (includes HT query compute) | Up to 3 hours | Per-warehouse, hourly |
| Query Profile (Snowsight) | Real-time single-query diagnosis | Immediate | Per-query |
The Key View: AGGREGATE_QUERY_HISTORY
This view captures every query regardless of duration, aggregated into 1-minute intervals grouped by query_parameterized_hash. Each row represents all executions of a specific query shape within a 1-minute window.
SELECT
    interval_start_time,
    query_parameterized_hash,
    query_text,
    calls,
    total_elapsed_time,
    hybrid_table_requests_throttled_count
FROM SNOWFLAKE.ACCOUNT_USAGE.AGGREGATE_QUERY_HISTORY
WHERE interval_start_time > DATEADD(DAY, -1, CURRENT_TIMESTAMP())
ORDER BY interval_start_time DESC
LIMIT 5;
Step 2: Reading AGGREGATE_QUERY_HISTORY
Understanding OBJECT-Typed Columns
Most numeric columns in AGGREGATE_QUERY_HISTORY are OBJECT typed, containing statistical aggregates:
{
  "avg": 23.5,
  "count": 150,
  "max": 89.0,
  "min": 12.0,
  "median": 21.0,
  "p90": 45.0,
  "p99": 78.0,
  "p99.9": 85.0,
  "sum": 3525.0
}
Extract specific percentiles using the : operator:
SELECT
    interval_start_time,
    query_parameterized_hash,
    ANY_VALUE(query_text) AS sample_query,
    SUM(calls) AS total_calls,
    AVG(total_elapsed_time:"avg"::FLOAT) AS avg_latency_ms,
    MAX(total_elapsed_time:"median"::FLOAT) AS p50_latency_ms,
    MAX(total_elapsed_time:"p90"::FLOAT) AS p90_latency_ms,
    MAX(total_elapsed_time:"p99"::FLOAT) AS p99_latency_ms,
    MAX(total_elapsed_time:"max"::FLOAT) AS max_latency_ms
FROM SNOWFLAKE.ACCOUNT_USAGE.AGGREGATE_QUERY_HISTORY
WHERE interval_start_time > DATEADD(HOUR, -6, CURRENT_TIMESTAMP())
GROUP BY interval_start_time, query_parameterized_hash
ORDER BY total_calls DESC
LIMIT 20;
Compilation vs Execution Time Split
For HT workloads, high compilation time relative to execution time indicates plan cache misses:
SELECT
    query_parameterized_hash,
    ANY_VALUE(query_text) AS sample_query,
    SUM(calls) AS total_calls,
    AVG(compilation_time:"avg"::FLOAT) AS avg_compile_ms,
    AVG(execution_time:"avg"::FLOAT) AS avg_exec_ms,
    ROUND(AVG(compilation_time:"avg"::FLOAT) /
      NULLIF(AVG(total_elapsed_time:"avg"::FLOAT), 0) * 100, 1) AS compile_pct
FROM SNOWFLAKE.ACCOUNT_USAGE.AGGREGATE_QUERY_HISTORY
WHERE interval_start_time > DATEADD(DAY, -1, CURRENT_TIMESTAMP())
  AND calls > 10
GROUP BY query_parameterized_hash
HAVING AVG(compilation_time:"avg"::FLOAT) > 50
ORDER BY compile_pct DESC
LIMIT 10;
Interpretation: If
compile_pctis above 50%, the query is spending more time compiling than executing. This usually means plan cache is not being utilized — check that you are using bound variables and consistent schema qualification. See Write Optimization for details.
Error Analysis
The ERRORS column is an ARRAY of error objects. Query shapes with recurring errors:
SELECT
    query_parameterized_hash,
    ANY_VALUE(query_text) AS sample_query,
    SUM(calls) AS total_calls,
    SUM(ARRAY_SIZE(errors)) AS total_errors,
    ROUND(SUM(ARRAY_SIZE(errors)) / NULLIF(SUM(calls), 0) * 100, 2) AS error_rate_pct
FROM SNOWFLAKE.ACCOUNT_USAGE.AGGREGATE_QUERY_HISTORY
WHERE interval_start_time > DATEADD(DAY, -1, CURRENT_TIMESTAMP())
  AND ARRAY_SIZE(errors) > 0
GROUP BY query_parameterized_hash
ORDER BY total_errors DESC
LIMIT 10;
Throttling Detection
When HT request throughput exceeds the database-level quota (~16K ops/sec), requests are throttled:
SELECT
    interval_start_time,
    SUM(calls) AS total_calls,
    SUM(hybrid_table_requests_throttled_count) AS throttled_count,
    ROUND(SUM(hybrid_table_requests_throttled_count) / NULLIF(SUM(calls), 0) * 100, 2) AS throttle_pct
FROM SNOWFLAKE.ACCOUNT_USAGE.AGGREGATE_QUERY_HISTORY
WHERE interval_start_time > DATEADD(HOUR, -24, CURRENT_TIMESTAMP())
GROUP BY interval_start_time
HAVING throttled_count > 0
ORDER BY interval_start_time DESC;
Step 3: Monitoring Dashboard Queries
These queries can be used in any visualization tool: Streamlit in Snowflake (see Step 6), Grafana (see Step 7), or any BI tool connected to your account.
Tile 1: Throughput Over Time (QPS)
SELECT
    interval_start_time AS ts,
    SUM(calls) / 60.0 AS queries_per_second
FROM SNOWFLAKE.ACCOUNT_USAGE.AGGREGATE_QUERY_HISTORY
WHERE interval_start_time > DATEADD(HOUR, -24, CURRENT_TIMESTAMP())
  AND database_name = 'HT_MON_QS_DB'
GROUP BY interval_start_time
ORDER BY ts;
Tile 2: Latency Percentiles Over Time
SELECT
    interval_start_time AS ts,
    AVG(total_elapsed_time:"median"::FLOAT) AS p50_ms,
    AVG(total_elapsed_time:"p90"::FLOAT) AS p90_ms,
    AVG(total_elapsed_time:"p99"::FLOAT) AS p99_ms
FROM SNOWFLAKE.ACCOUNT_USAGE.AGGREGATE_QUERY_HISTORY
WHERE interval_start_time > DATEADD(HOUR, -24, CURRENT_TIMESTAMP())
  AND database_name = 'HT_MON_QS_DB'
  AND query_type IN ('SELECT', 'INSERT', 'UPDATE', 'DELETE', 'MERGE')
GROUP BY interval_start_time
ORDER BY ts;
Tile 3: Top 10 Query Shapes by Volume
SELECT
    query_parameterized_hash,
    ANY_VALUE(LEFT(query_text, 80)) AS query_preview,
    SUM(calls) AS total_calls,
    AVG(total_elapsed_time:"avg"::FLOAT) AS avg_ms,
    MAX(total_elapsed_time:"p99"::FLOAT) AS p99_ms
FROM SNOWFLAKE.ACCOUNT_USAGE.AGGREGATE_QUERY_HISTORY
WHERE interval_start_time > DATEADD(DAY, -1, CURRENT_TIMESTAMP())
  AND database_name = 'HT_MON_QS_DB'
GROUP BY query_parameterized_hash
ORDER BY total_calls DESC
LIMIT 10;
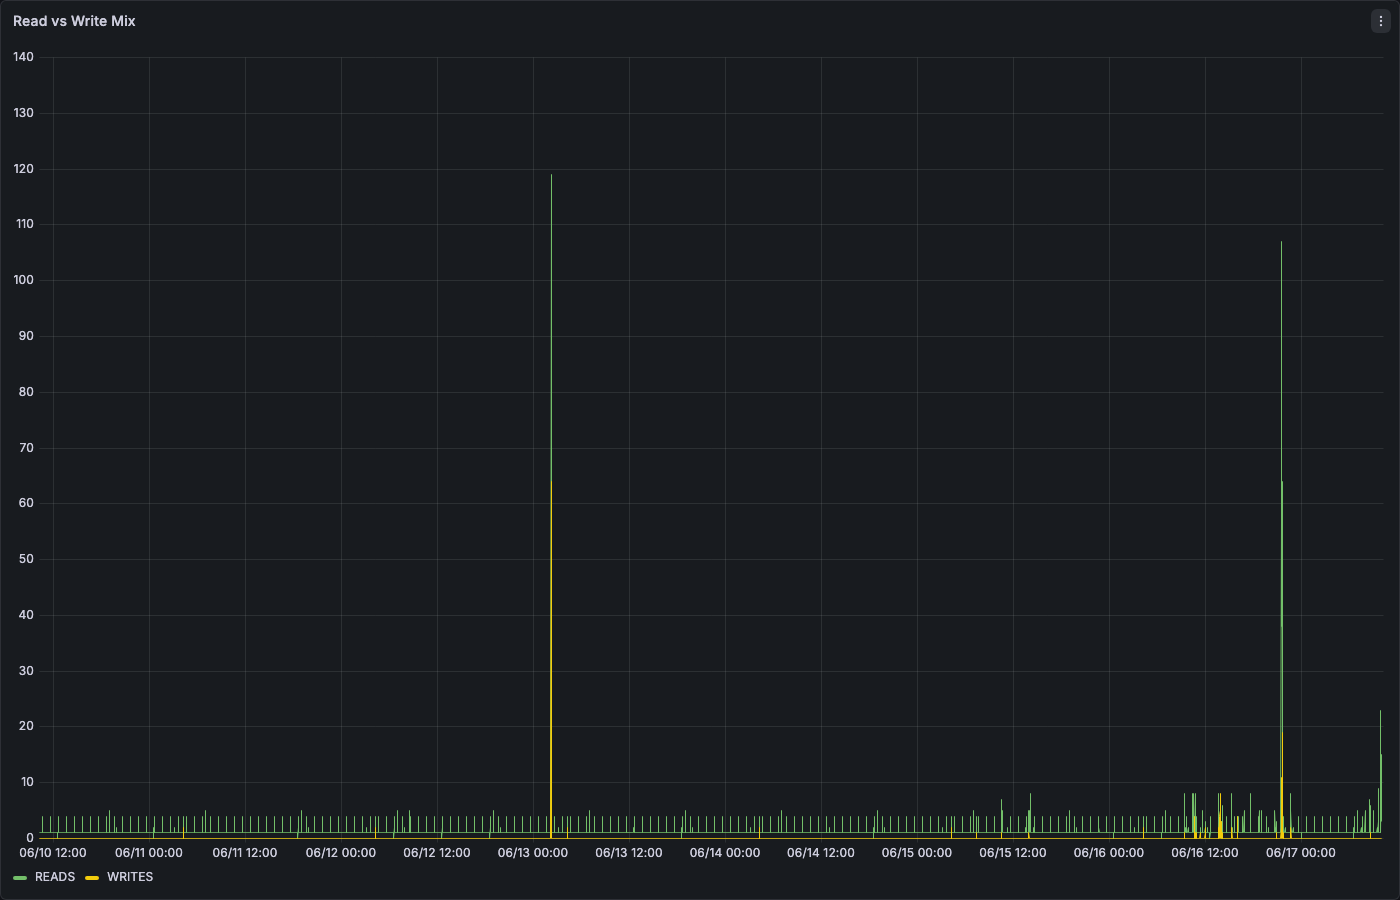
Tile 4: Read vs Write Mix
SELECT
    interval_start_time AS ts,
    SUM(CASE WHEN query_type = 'SELECT' THEN calls ELSE 0 END) AS reads,
    SUM(CASE WHEN query_type IN ('INSERT','UPDATE','DELETE','MERGE') THEN calls ELSE 0 END) AS writes
FROM SNOWFLAKE.ACCOUNT_USAGE.AGGREGATE_QUERY_HISTORY
WHERE interval_start_time > DATEADD(HOUR, -24, CURRENT_TIMESTAMP())
  AND database_name = 'HT_MON_QS_DB'
GROUP BY interval_start_time
ORDER BY ts;
Tile 5: Error Rate Over Time
SELECT
    interval_start_time AS ts,
    SUM(calls) AS total_calls,
    SUM(ARRAY_SIZE(errors)) AS total_errors,
    ROUND(SUM(ARRAY_SIZE(errors)) / NULLIF(SUM(calls), 0) * 100, 2) AS error_rate_pct
FROM SNOWFLAKE.ACCOUNT_USAGE.AGGREGATE_QUERY_HISTORY
WHERE interval_start_time > DATEADD(HOUR, -24, CURRENT_TIMESTAMP())
  AND database_name = 'HT_MON_QS_DB'
GROUP BY interval_start_time
ORDER BY ts;
Tile 6: Throttle Events
SELECT
    interval_start_time AS ts,
    SUM(hybrid_table_requests_throttled_count) AS throttled_requests
FROM SNOWFLAKE.ACCOUNT_USAGE.AGGREGATE_QUERY_HISTORY
WHERE interval_start_time > DATEADD(HOUR, -24, CURRENT_TIMESTAMP())
  AND database_name = 'HT_MON_QS_DB'
  AND hybrid_table_requests_throttled_count > 0
GROUP BY interval_start_time
ORDER BY ts;
Here is an example of these queries visualized in Grafana (connected to AGGREGATE_QUERY_HISTORY):
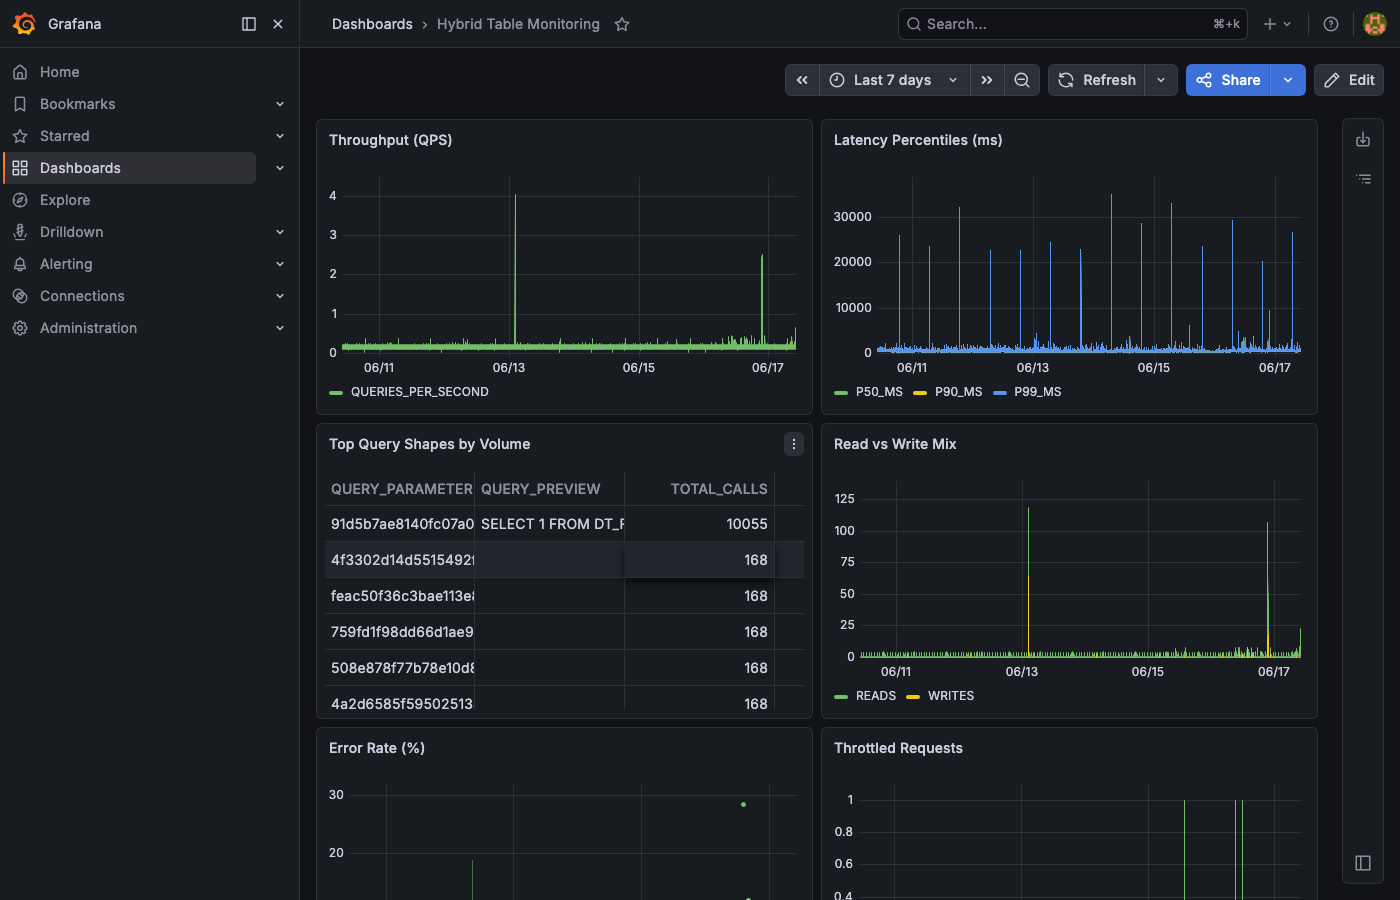
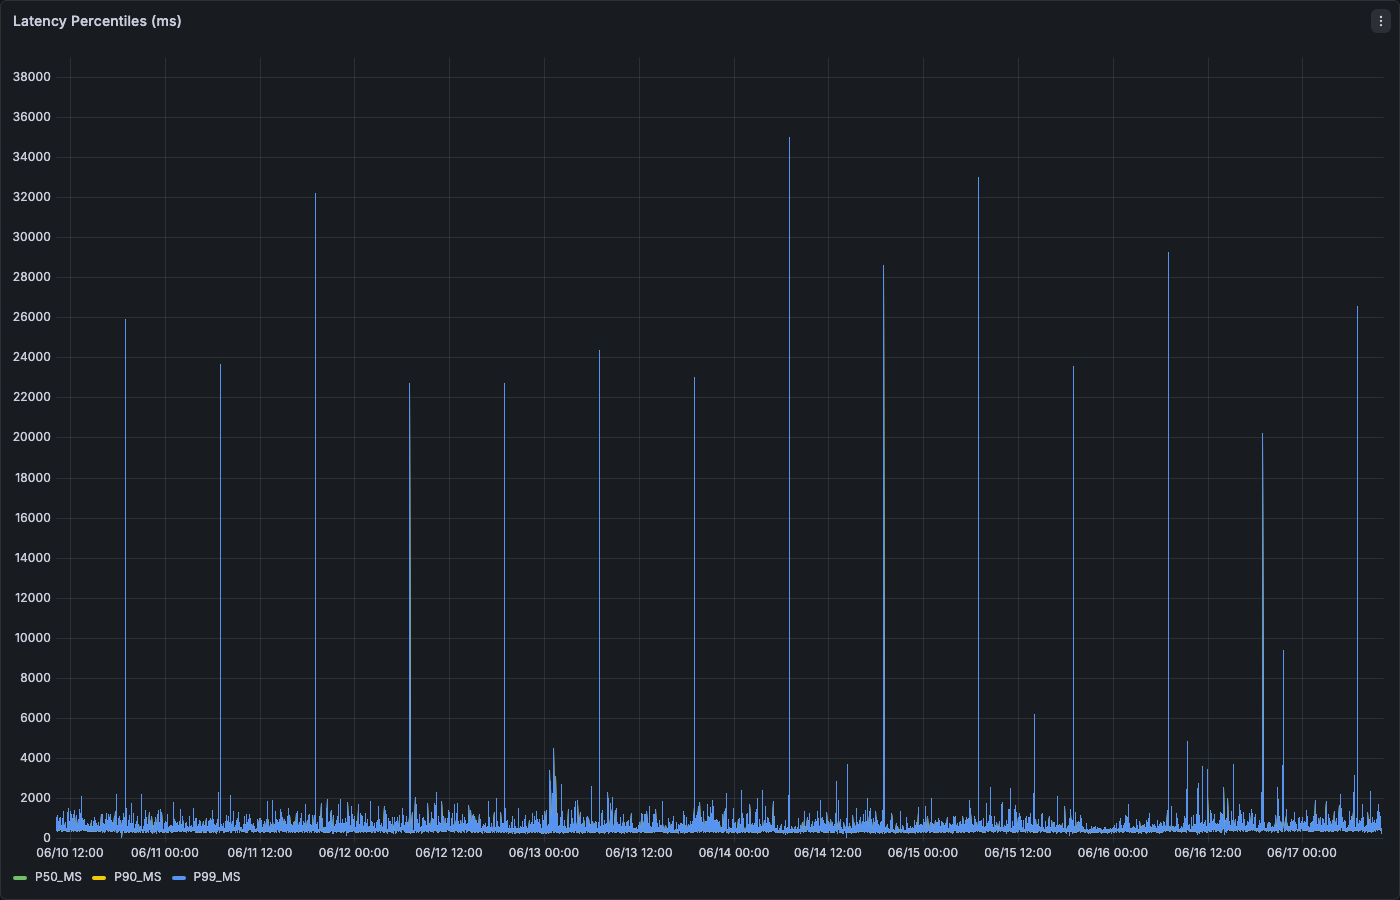
The latency percentiles panel shows p99 spikes that may indicate cold cache hits or lock contention:
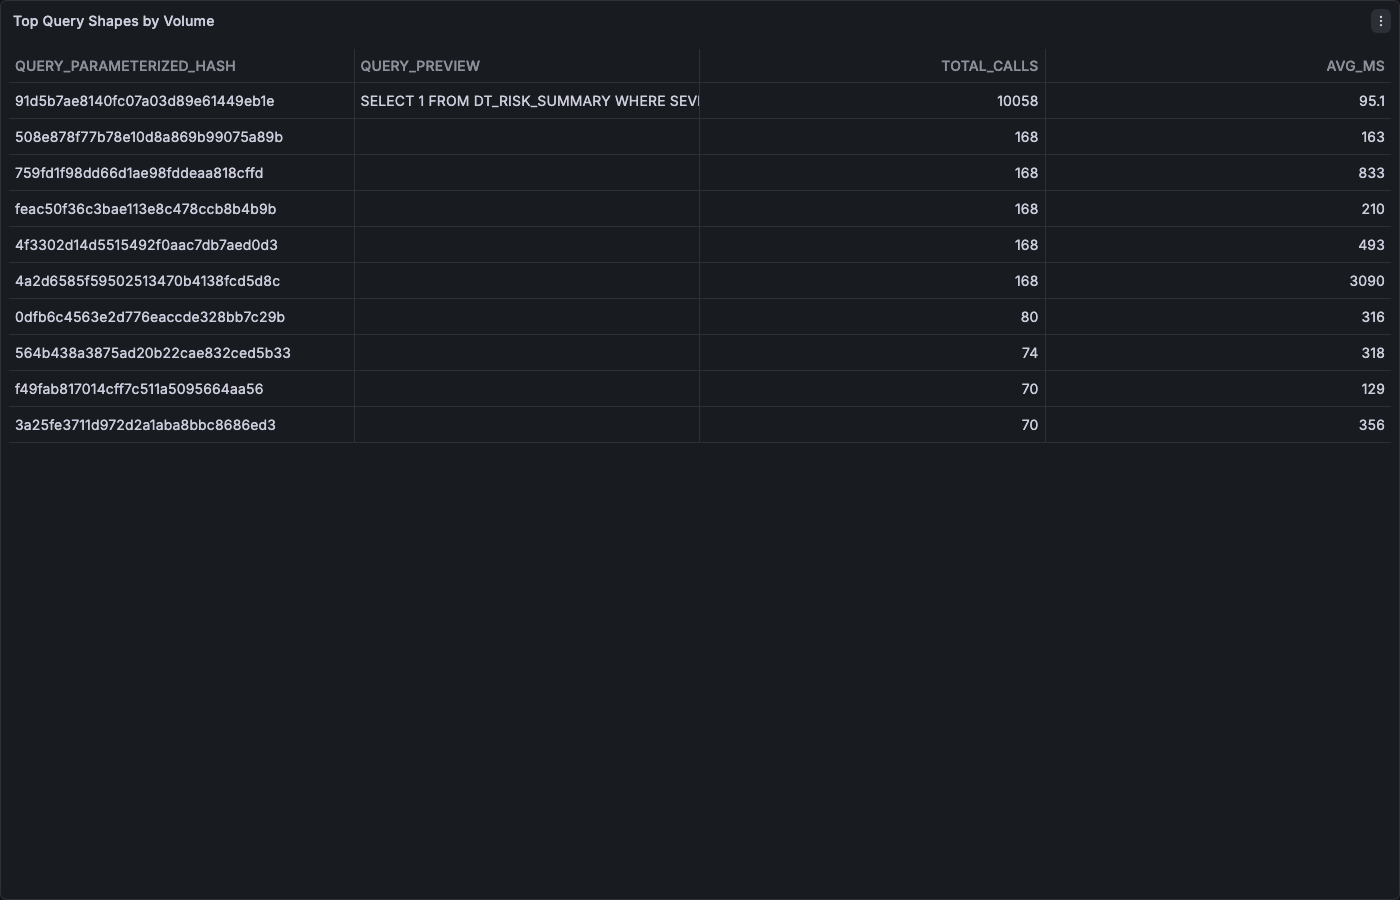
The top query shapes table identifies which parameterized queries dominate your workload:
Step 4: Credit and Storage Monitoring
HT Background Credits (HYBRID_TABLE_USAGE_HISTORY)
Hybrid Tables consume credits for background operations (compaction, index maintenance) separate from query execution credits:
SELECT
    object_name AS table_name,
    DATE_TRUNC('DAY', start_time) AS day,
    SUM(credits_used) AS daily_credits
FROM SNOWFLAKE.ACCOUNT_USAGE.HYBRID_TABLE_USAGE_HISTORY
WHERE start_time > DATEADD(DAY, -30, CURRENT_TIMESTAMP())
GROUP BY object_name, DATE_TRUNC('DAY', start_time)
ORDER BY day DESC, daily_credits DESC;
Storage Per Table (TABLE_STORAGE_METRICS)
Track storage growth to stay within the 2 TB per-database quota:
SELECT
    table_catalog AS database_name,
    table_schema,
    table_name,
    ROUND(active_bytes / POWER(1024, 3), 3) AS active_gb,
    ROUND(time_travel_bytes / POWER(1024, 3), 3) AS time_travel_gb,
    ROUND(failsafe_bytes / POWER(1024, 3), 3) AS failsafe_gb,
    ROUND((active_bytes + time_travel_bytes + failsafe_bytes) / POWER(1024, 3), 3) AS total_gb
FROM SNOWFLAKE.ACCOUNT_USAGE.TABLE_STORAGE_METRICS
WHERE table_catalog = 'HT_MON_QS_DB'
  AND deleted IS NULL
ORDER BY active_bytes DESC;
Database-Level Quota Tracking
SELECT
    table_catalog AS database_name,
    ROUND(SUM(active_bytes) / POWER(1024, 4), 4) AS active_tb,
    ROUND(2.0 - SUM(active_bytes) / POWER(1024, 4), 4) AS remaining_tb,
    ROUND(SUM(active_bytes) / POWER(1024, 4) / 2.0 * 100, 1) AS quota_used_pct
FROM SNOWFLAKE.ACCOUNT_USAGE.TABLE_STORAGE_METRICS
WHERE table_catalog = 'HT_MON_QS_DB'
  AND deleted IS NULL
GROUP BY table_catalog;
Quota Reference: Each database has a 2 TB limit for Hybrid Table storage. If
quota_used_pctexceeds 80%, plan for data tiering or archival. See Operations Patterns for hot/cold tiering strategies.
Warehouse Credit Consumption (Query Compute)
SELECT
    warehouse_name,
    DATE_TRUNC('DAY', start_time) AS day,
    SUM(credits_used) AS query_credits
FROM SNOWFLAKE.ACCOUNT_USAGE.WAREHOUSE_METERING_HISTORY
WHERE start_time > DATEADD(DAY, -30, CURRENT_TIMESTAMP())
  AND warehouse_name ILIKE '%HT%'
GROUP BY warehouse_name, DATE_TRUNC('DAY', start_time)
ORDER BY day DESC;
Step 5: Alerting Framework
Alert Infrastructure
USE ROLE HT_MON_QS_ROLE;

CREATE OR REPLACE TABLE HT_MON_QS_DB.DATA.alert_log (
    alert_ts    TIMESTAMP_NTZ DEFAULT CURRENT_TIMESTAMP(),
    alert_type  VARCHAR(50),
    severity    VARCHAR(20),
    message     VARCHAR(2000),
    metric_value FLOAT
);
Alert 1: Throttling Spike
Fires when more than 100 requests are throttled in a 10-minute window:
USE ROLE ACCOUNTADMIN;

CREATE OR REPLACE ALERT ht_throttle_alert
  WAREHOUSE = HT_MON_QS_WH
  SCHEDULE = '5 MINUTE'
  IF( EXISTS(
    SELECT 1
    FROM SNOWFLAKE.ACCOUNT_USAGE.AGGREGATE_QUERY_HISTORY
    WHERE hybrid_table_requests_throttled_count > 100
      AND interval_start_time > DATEADD(MINUTE, -10, CURRENT_TIMESTAMP())
  ))
  THEN
    INSERT INTO HT_MON_QS_DB.DATA.alert_log (alert_type, severity, message, metric_value)
    SELECT 'THROTTLE', 'HIGH',
      'Throttling detected: ' || SUM(hybrid_table_requests_throttled_count)::VARCHAR || ' throttled requests in last 10 min',
      SUM(hybrid_table_requests_throttled_count)
    FROM SNOWFLAKE.ACCOUNT_USAGE.AGGREGATE_QUERY_HISTORY
    WHERE hybrid_table_requests_throttled_count > 0
      AND interval_start_time > DATEADD(MINUTE, -10, CURRENT_TIMESTAMP());

ALTER ALERT ht_throttle_alert RESUME;
Alert 2: Latency Regression
Fires when p99 latency exceeds 500ms (adjust threshold for your SLA):
CREATE OR REPLACE ALERT ht_latency_alert
  WAREHOUSE = HT_MON_QS_WH
  SCHEDULE = '5 MINUTE'
  IF( EXISTS(
    SELECT 1
    FROM SNOWFLAKE.ACCOUNT_USAGE.AGGREGATE_QUERY_HISTORY
    WHERE total_elapsed_time:"p99"::FLOAT > 500
      AND calls > 5
      AND interval_start_time > DATEADD(MINUTE, -10, CURRENT_TIMESTAMP())
      AND database_name = 'HT_MON_QS_DB'
      AND query_type IN ('SELECT', 'INSERT', 'UPDATE', 'DELETE')
  ))
  THEN
    INSERT INTO HT_MON_QS_DB.DATA.alert_log (alert_type, severity, message, metric_value)
    SELECT 'LATENCY_REGRESSION', 'MEDIUM',
      'p99 latency exceeded 500ms for hash ' || query_parameterized_hash || ': ' || ROUND(total_elapsed_time:"p99"::FLOAT, 1)::VARCHAR || 'ms',
      total_elapsed_time:"p99"::FLOAT
    FROM SNOWFLAKE.ACCOUNT_USAGE.AGGREGATE_QUERY_HISTORY
    WHERE total_elapsed_time:"p99"::FLOAT > 500
      AND calls > 5
      AND interval_start_time > DATEADD(MINUTE, -10, CURRENT_TIMESTAMP())
      AND database_name = 'HT_MON_QS_DB'
    ORDER BY total_elapsed_time:"p99"::FLOAT DESC
    LIMIT 1;

ALTER ALERT ht_latency_alert RESUME;
Alert 3: Error Spike
Fires when error rate exceeds 5% of total calls:
CREATE OR REPLACE ALERT ht_error_alert
  WAREHOUSE = HT_MON_QS_WH
  SCHEDULE = '5 MINUTE'
  IF( EXISTS(
    SELECT 1
    FROM (
      SELECT
        SUM(calls) AS total_calls,
        SUM(ARRAY_SIZE(errors)) AS total_errors
      FROM SNOWFLAKE.ACCOUNT_USAGE.AGGREGATE_QUERY_HISTORY
      WHERE interval_start_time > DATEADD(MINUTE, -10, CURRENT_TIMESTAMP())
        AND database_name = 'HT_MON_QS_DB'
    )
    WHERE total_errors > 0
      AND total_errors::FLOAT / NULLIF(total_calls, 0) > 0.05
  ))
  THEN
    INSERT INTO HT_MON_QS_DB.DATA.alert_log (alert_type, severity, message, metric_value)
    SELECT 'ERROR_SPIKE', 'HIGH',
      'Error rate exceeded 5%: ' || SUM(ARRAY_SIZE(errors))::VARCHAR || ' errors out of ' || SUM(calls)::VARCHAR || ' calls',
      ROUND(SUM(ARRAY_SIZE(errors))::FLOAT / NULLIF(SUM(calls), 0) * 100, 2)
    FROM SNOWFLAKE.ACCOUNT_USAGE.AGGREGATE_QUERY_HISTORY
    WHERE interval_start_time > DATEADD(MINUTE, -10, CURRENT_TIMESTAMP())
      AND database_name = 'HT_MON_QS_DB';

ALTER ALERT ht_error_alert RESUME;
Alert 4: Storage Quota Warning
Fires when database storage exceeds 80% of the 2 TB quota:
CREATE OR REPLACE ALERT ht_storage_alert
  WAREHOUSE = HT_MON_QS_WH
  SCHEDULE = 'USING CRON 0 */6 * * * UTC'
  IF( EXISTS(
    SELECT 1
    FROM (
      SELECT SUM(active_bytes) / POWER(1024, 4) AS active_tb
      FROM SNOWFLAKE.ACCOUNT_USAGE.TABLE_STORAGE_METRICS
      WHERE table_catalog = 'HT_MON_QS_DB'
        AND deleted IS NULL
    )
    WHERE active_tb > 1.6
  ))
  THEN
    INSERT INTO HT_MON_QS_DB.DATA.alert_log (alert_type, severity, message, metric_value)
    SELECT 'STORAGE_QUOTA', 'HIGH',
      'HT database storage at ' || ROUND(SUM(active_bytes) / POWER(1024, 4) * 100 / 2.0, 1)::VARCHAR || '% of 2TB quota',
      SUM(active_bytes) / POWER(1024, 4)
    FROM SNOWFLAKE.ACCOUNT_USAGE.TABLE_STORAGE_METRICS
    WHERE table_catalog = 'HT_MON_QS_DB'
      AND deleted IS NULL;

ALTER ALERT ht_storage_alert RESUME;
Review Alerts
SHOW ALERTS;
SELECT * FROM HT_MON_QS_DB.DATA.alert_log ORDER BY alert_ts DESC LIMIT 20;
Step 6: Custom Dashboards and Observability Apps
Duration: 10
Build custom monitoring experiences using Snowflake-native application frameworks — no external infrastructure required.
Option A: Streamlit in Snowflake
Build an interactive monitoring dashboard that runs entirely within your Snowflake account.
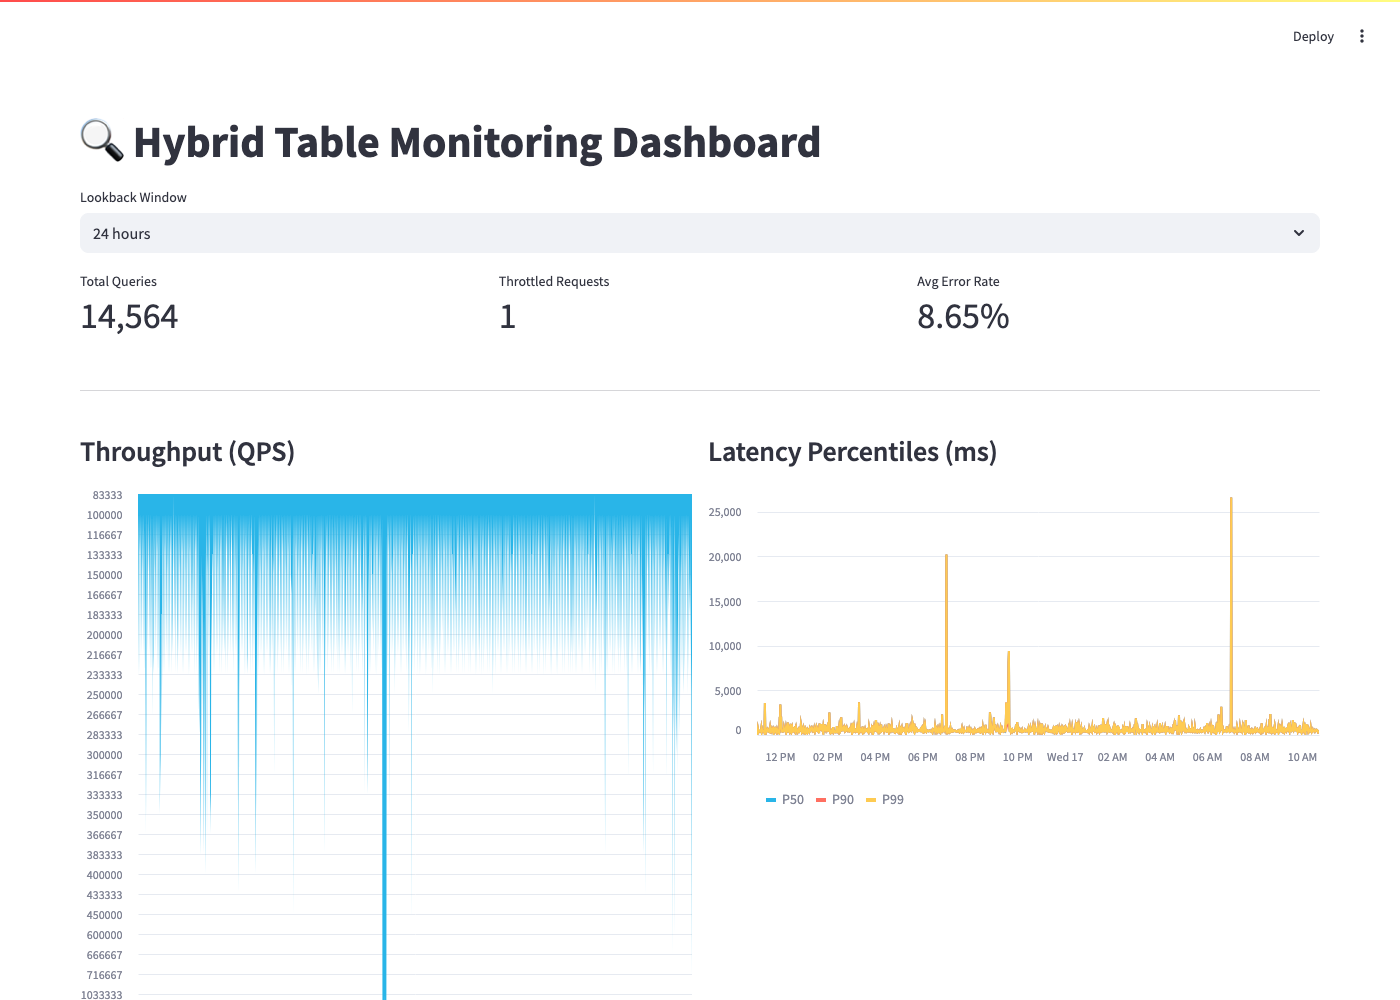
import streamlit as st
from snowflake.snowpark.context import get_active_session

session = get_active_session()

st.set_page_config(page_title="Hybrid Table Monitor", layout="wide")
st.title("🔍 Hybrid Table Monitoring Dashboard")

lookback = st.selectbox("Lookback Window", ["6 hours", "24 hours", "7 days"], index=1)
hours_map = {"6 hours": 6, "24 hours": 24, "7 days": 168}
hours = hours_map[lookback]

qps_df = session.sql(f"""
    SELECT interval_start_time AS ts,
           SUM(calls) / 60.0 AS qps
    FROM SNOWFLAKE.ACCOUNT_USAGE.AGGREGATE_QUERY_HISTORY
    WHERE interval_start_time > DATEADD(HOUR, -{hours}, CURRENT_TIMESTAMP())
    GROUP BY interval_start_time ORDER BY ts
""").to_pandas()

latency_df = session.sql(f"""
    SELECT interval_start_time AS ts,
           AVG(total_elapsed_time:"median"::FLOAT) AS p50_ms,
           AVG(total_elapsed_time:"p90"::FLOAT) AS p90_ms,
           AVG(total_elapsed_time:"p99"::FLOAT) AS p99_ms
    FROM SNOWFLAKE.ACCOUNT_USAGE.AGGREGATE_QUERY_HISTORY
    WHERE interval_start_time > DATEADD(HOUR, -{hours}, CURRENT_TIMESTAMP())
      AND calls > 0
    GROUP BY interval_start_time ORDER BY ts
""").to_pandas()

throttle_df = session.sql(f"""
    SELECT SUM(hybrid_table_requests_throttled_count) AS throttled
    FROM SNOWFLAKE.ACCOUNT_USAGE.AGGREGATE_QUERY_HISTORY
    WHERE interval_start_time > DATEADD(HOUR, -{hours}, CURRENT_TIMESTAMP())
""").to_pandas()

m1, m2, m3 = st.columns(3)
with m1:
    total = int(qps_df["QPS"].sum() * 60) if not qps_df.empty else 0
    st.metric("Total Queries", f"{total:,}")
with m2:
    throttled = int(throttle_df["THROTTLED"].iloc[0] or 0)
    st.metric("Throttled Requests", f"{throttled:,}")
with m3:
    st.metric("Avg Error Rate", "—")

col1, col2 = st.columns(2)
with col1:
    st.subheader("Throughput (QPS)")
    st.area_chart(qps_df.set_index("TS")["QPS"])
with col2:
    st.subheader("Latency Percentiles (ms)")
    st.line_chart(latency_df.set_index("TS")[["P50_MS", "P90_MS", "P99_MS"]])
Deploy this as a Streamlit in Snowflake app for a zero-infrastructure monitoring solution that your team can access from the Snowsight UI.
Note on OBJECT accessor syntax: When accessing keys inside OBJECT columns like
total_elapsed_time, use double-quote notation (total_elapsed_time:"median"::FLOAT) or bracket notation (total_elapsed_time['median']::FLOAT). Single-quote notation may fail in some connectors.
Option B: Snowflake Apps (Snowflake Native App Framework)
For a packaged, shareable monitoring experience, build a Snowflake Native App that:
- Bundles the dashboard SQL, alerts, and tasks into a single installable package
- Can be shared across accounts (e.g., from a central platform team to application teams)
- Includes Streamlit pages for visualization and a setup wizard for configuring database filters
This approach works well when you want to standardize HT monitoring across multiple teams or accounts.
Option C: OpenTelemetry Export
For teams already invested in OpenTelemetry, export HT metrics as OTLP data:
- Snowflake Task exports metrics to a stage on a schedule (e.g., every 5 minutes)
- OpenTelemetry Collector with the
filereceiverreads staged JSON files - Your OTLP backend (Jaeger, Honeycomb, Grafana Tempo) receives the traces/metrics
This integrates HT monitoring into your existing distributed tracing infrastructure alongside application-level spans.
Choosing the Right Approach
| Approach | Best For | Pros | Cons |
|---|---|---|---|
| Snowflake Worksheets | Quick ad-hoc queries | Zero config, native | No persistent dashboards |
| Streamlit in Snowflake | Custom team dashboards | Rich interactivity, runs in SF | Requires SiS entitlement |
| Snowflake Native App | Multi-account standardization | Shareable, versioned | More setup complexity |
| Grafana/Datadog | Unified observability stack | Correlate with app metrics | External dependency |
| OTLP Export | Distributed tracing teams | Fits existing pipelines | Custom integration work |
Step 7: External Observability Integration
For teams using Datadog, Grafana, or Prometheus, export HT metrics from Snowflake on a schedule.
Datadog Integration
With the Snowflake Datadog integration, you can query AGGREGATE_QUERY_HISTORY directly. Configure a custom query in the integration YAML:
# Example Datadog custom query (datadog-agent snowflake.d/conf.yaml)
custom_queries:
  - query: >
      SELECT
        SUM(calls) / 60.0 AS qps,
        AVG(total_elapsed_time:"p99"::FLOAT) AS p99_ms,
        SUM(hybrid_table_requests_throttled_count) AS throttled
      FROM SNOWFLAKE.ACCOUNT_USAGE.AGGREGATE_QUERY_HISTORY
      WHERE interval_start_time > DATEADD(MINUTE, -5, CURRENT_TIMESTAMP())
        AND database_name = 'YOUR_HT_DATABASE'
    columns:
      - name: snowflake.hybrid_table.qps
        type: gauge
      - name: snowflake.hybrid_table.p99_ms
        type: gauge
      - name: snowflake.hybrid_table.throttled
        type: count
    tags:
      - service:hybrid-tables
Grafana Integration
Use the Michelin Snowflake Grafana data source plugin (open-source, community-supported) to query AGGREGATE_QUERY_HISTORY directly. Configure the data source with your account identifier, warehouse, and credentials, then build panels using the same SQL from Step 3.
Note: The official Grafana Snowflake plugin requires a Grafana Enterprise license. The Michelin community plugin is free and supports password, key-pair, and OAuth authentication.

Monitoring Playbook
When alerts fire, use this decision tree:
| Alert | First Response | Root Cause Investigation |
|---|---|---|
| THROTTLE | Check if workload has spiked vs normal | Review calls by query_parameterized_hash — one runaway loop? Distribute across databases if sustained. |
| LATENCY_REGRESSION | Check compilation_time vs execution_time | High compile_time → plan cache miss (bound variables, schema qualification). High exec_time → check Query Profile for full table scans or lock contention. |
| ERROR_SPIKE | Inspect error array contents | Common: PK violations (duplicate inserts), lock timeouts (contention), quota exceeded. |
| STORAGE_QUOTA | Check per-table storage | Archive cold data to standard table (see Operations Patterns). |
Useful Diagnostic Queries
Find the noisiest query shape:
SELECT
    query_parameterized_hash,
    ANY_VALUE(query_text) AS query_sample,
    SUM(calls) AS total_calls,
    AVG(total_elapsed_time:"avg"::FLOAT) AS avg_ms
FROM SNOWFLAKE.ACCOUNT_USAGE.AGGREGATE_QUERY_HISTORY
WHERE interval_start_time > DATEADD(HOUR, -1, CURRENT_TIMESTAMP())
GROUP BY query_parameterized_hash
ORDER BY total_calls DESC
LIMIT 5;
Find queries with high tail latency (p99/median ratio > 5x):
SELECT
    query_parameterized_hash,
    ANY_VALUE(LEFT(query_text, 100)) AS query_sample,
    SUM(calls) AS total_calls,
    AVG(total_elapsed_time:"median"::FLOAT) AS p50_ms,
    AVG(total_elapsed_time:"p99"::FLOAT) AS p99_ms,
    ROUND(AVG(total_elapsed_time:"p99"::FLOAT) / NULLIF(AVG(total_elapsed_time:"median"::FLOAT), 0), 1) AS tail_ratio
FROM SNOWFLAKE.ACCOUNT_USAGE.AGGREGATE_QUERY_HISTORY
WHERE interval_start_time > DATEADD(HOUR, -6, CURRENT_TIMESTAMP())
  AND calls > 10
GROUP BY query_parameterized_hash
HAVING tail_ratio > 5
ORDER BY tail_ratio DESC
LIMIT 10;
High tail ratio means inconsistent performance. Common causes: some lookups hit compacted data (fast) while others hit recently written data (slower), or intermittent lock contention from concurrent writes.
Get Started Faster with Cortex Code
Duration: 1
Use these prompts in Cortex Code to apply this guide to your own workload:
"Run an AGGREGATE_QUERY_HISTORY analysis for my Hybrid Table workload over the past 7 days. Identify my top 3 performance issues and provide specific remediation steps."
"I have a Hybrid Table called [TABLE_NAME]. Adapt the 6 monitoring dashboard queries from the HT Monitoring quickstart to my schema and return ready-to-run SQL."
"My Hybrid Table queries have high compilation time. Diagnose the root cause and rewrite the top offending queries to use bound variables."
Cleanup
USE ROLE ACCOUNTADMIN;
ALTER ALERT IF EXISTS ht_throttle_alert SUSPEND;
ALTER ALERT IF EXISTS ht_latency_alert SUSPEND;
ALTER ALERT IF EXISTS ht_error_alert SUSPEND;
ALTER ALERT IF EXISTS ht_storage_alert SUSPEND;
DROP ALERT IF EXISTS ht_throttle_alert;
DROP ALERT IF EXISTS ht_latency_alert;
DROP ALERT IF EXISTS ht_error_alert;
DROP ALERT IF EXISTS ht_storage_alert;
DROP DATABASE IF EXISTS HT_MON_QS_DB;
DROP WAREHOUSE IF EXISTS HT_MON_QS_WH;
DROP ROLE IF EXISTS HT_MON_QS_ROLE;
Conclusion and Resources
You can now:
- Find HT telemetry in AGGREGATE_QUERY_HISTORY (not QUERY_HISTORY)
- Extract latency percentiles (median, p90, p99) from OBJECT-typed columns
- Build dashboards with throughput, latency, read/write mix, and error rate tiles
- Track HT credit consumption and storage against the 2 TB quota
- Create multi-signal alerts (throttle, latency, errors, storage)
- Export metrics to external observability platforms (Datadog, Grafana)
- Build custom monitoring apps with Streamlit in Snowflake or Snowflake Native Apps
Need help with your Hybrid Table architecture? Book a 30-minute session with our specialist team to discuss your use case, review your schema design, or troubleshoot performance: Schedule a session
Related Resources
This content is provided as is, and is not maintained on an ongoing basis. It may be out of date with current Snowflake instances