From Insight to Action: Agentic Analytics with Sigma and Snowflake
Overview
In this lab, you'll step into the role of a business analyst at a retail company investigating a performance problem hiding in your data.
Your new employer, Big Buys Electronics ("Big Buys"), is a major electronics retailer. They have seen a notable decline in computer profitability over the last two to three months, and they need to fix it fast.
That's where you come in.
What You Will Build
In this lab you will use Sigma Assistant to discover the right data from a plain-language question, enrich your analysis by loading external data directly into Snowflake, apply Snowflake Cortex AI functions to score thousands of unstructured records, use a Sigma Agent to generate price recommendations, and carry those recommendations into a collaborative AI App backed by a Snowpark forecasting model and a governed approval workflow.
What You’ll Need
This lab uses a shared Snowflake account connected to a public Sigma account. Accessing this account is covered in a following section.
What You’ll Build
You will build a retail pricing plan for a future quarter. You will leverage a Cortex Agent to start your analysis and then move into building up a financial model where you will configure a Cortex powered Sigma Agent to make recommendations on price changes. Finally you will use forecasting application in Sigma powered by a Snowpark forecasting model to review the recommendations and kick off an approval workflow. All on top of Sigma and Snowflake, without having to write a line of code.
Prerequisites
A computer with a current browser. It does not matter which browser you want to use.
Sigma + Snowflake
Most Snowflake hands-on labs start by asking you to provision your own account, configure a virtual warehouse, and manage credentials. This lab skips all of that. You are working inside a shared, pre-configured Snowflake environment so you get right into the core of the lab: working with your data.
Before we get into the analysis, it is worth taking two minutes to understand the architecture, because everything you do in this session is running on Snowflake.
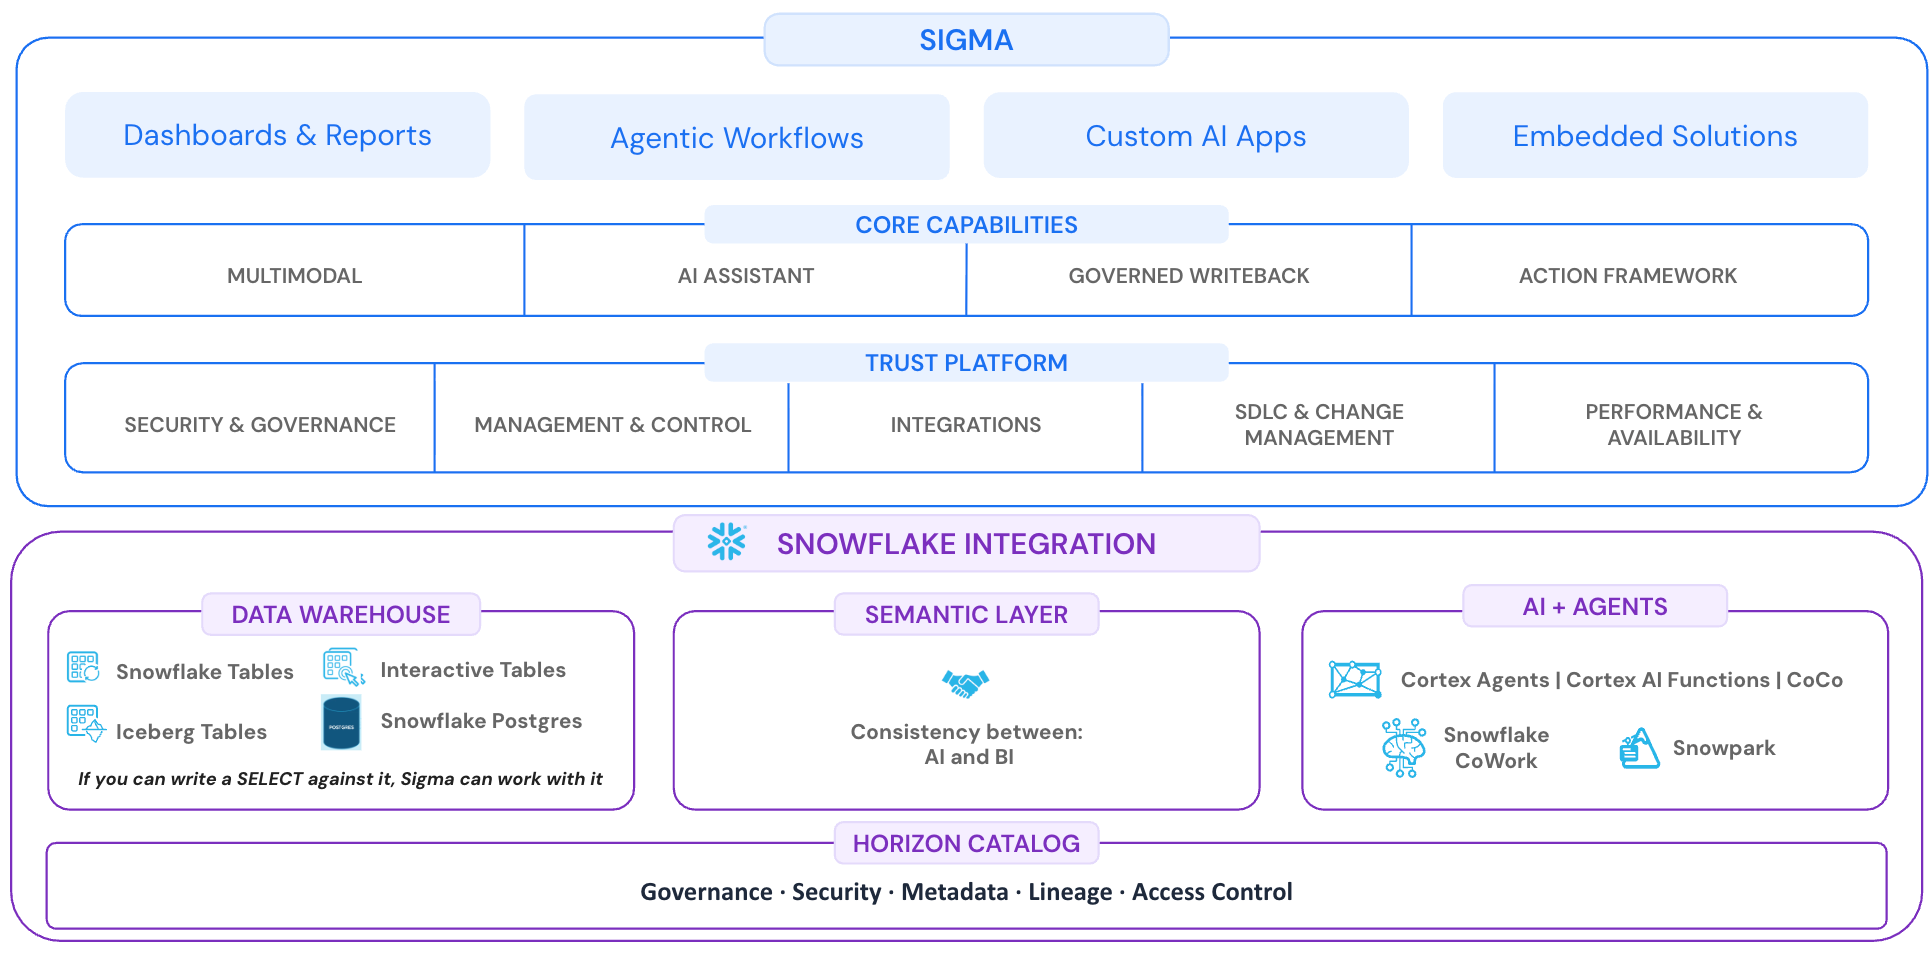
Sigma is an agentic analytics platform built directly on top of the Snowflake AI Data Cloud. It does not extract your data or store a copy of it somewhere else. When you interact with Sigma, it generates optimized SQL on the fly, executes it on Snowflake compute, and surfaces the results in an interface that any business user can work in. Your governance policies are inherited automatically and nothing leaves your warehouse.
The architecture diagram above shows three integration areas that are directly relevant to what you will experience today.
Data Warehouse. Sigma can connect to anything you can write a SELECT against in Snowflake, including standard tables, Iceberg tables, Interactive Tables, and Snowflake Postgres. The dataset powering this lab lives in Snowflake. Sigma reads it live at query time with no intermediate copy and no additional latency layer. As Sigma puts it: if you can write a SELECT against it, Sigma can work with it.
Semantic Layer. Sigma surfaces Snowflake Semantic Views and certified metrics directly in the interface. Business users see the concepts and definitions their data team has already built and approved, not raw table structures. This means what your AI returns and what your dashboards show are consistent with each other, which is harder to achieve than it sounds when you are scaling across teams.
AI + Agents. This is where the partnership goes deepest. Sigma exposes Snowflake's AI capabilities without requiring code from your business users. In this lab you will use a Cortex Agent via Sigma Assistant to surface the right data from a plain-language question, Snowflake Cortex AI functions to run sentiment analysis across thousands of records in seconds, a Sigma Agent to reason across your performance data and write recommendations, and a Snowpark forecasting model to project the impact of your decisions. All of it runs on Snowflake. All of it happens inside Sigma's governed interface.
Everything you do today writes back to Snowflake, queries Snowflake, and respects the security model you already have in place. Sigma provides the interface and the intelligence layer. Snowflake provides the compute, the storage, and the governance foundation.
Your Snowflake investment is only as valuable as what your team can actually do with the data inside it. Most of that potential goes unrealized because the tools sitting on top of Snowflake still require SQL, still require data exports, and still leave business users one step removed from the answers they need. Sigma is built to close that gap, putting the full capability of Snowflake in front of every person who needs it. It is why Sigma has been Snowflake's BI Partner of the Year four years running. And it is why the teams that have made the bet on Sigma consistently report that it is the most effective way to turn their Snowflake platform into a business advantage.
Now let's put that to work.
Setup
1: Use this link to navigate to Sigma
2: Create an account and then enter your email address:
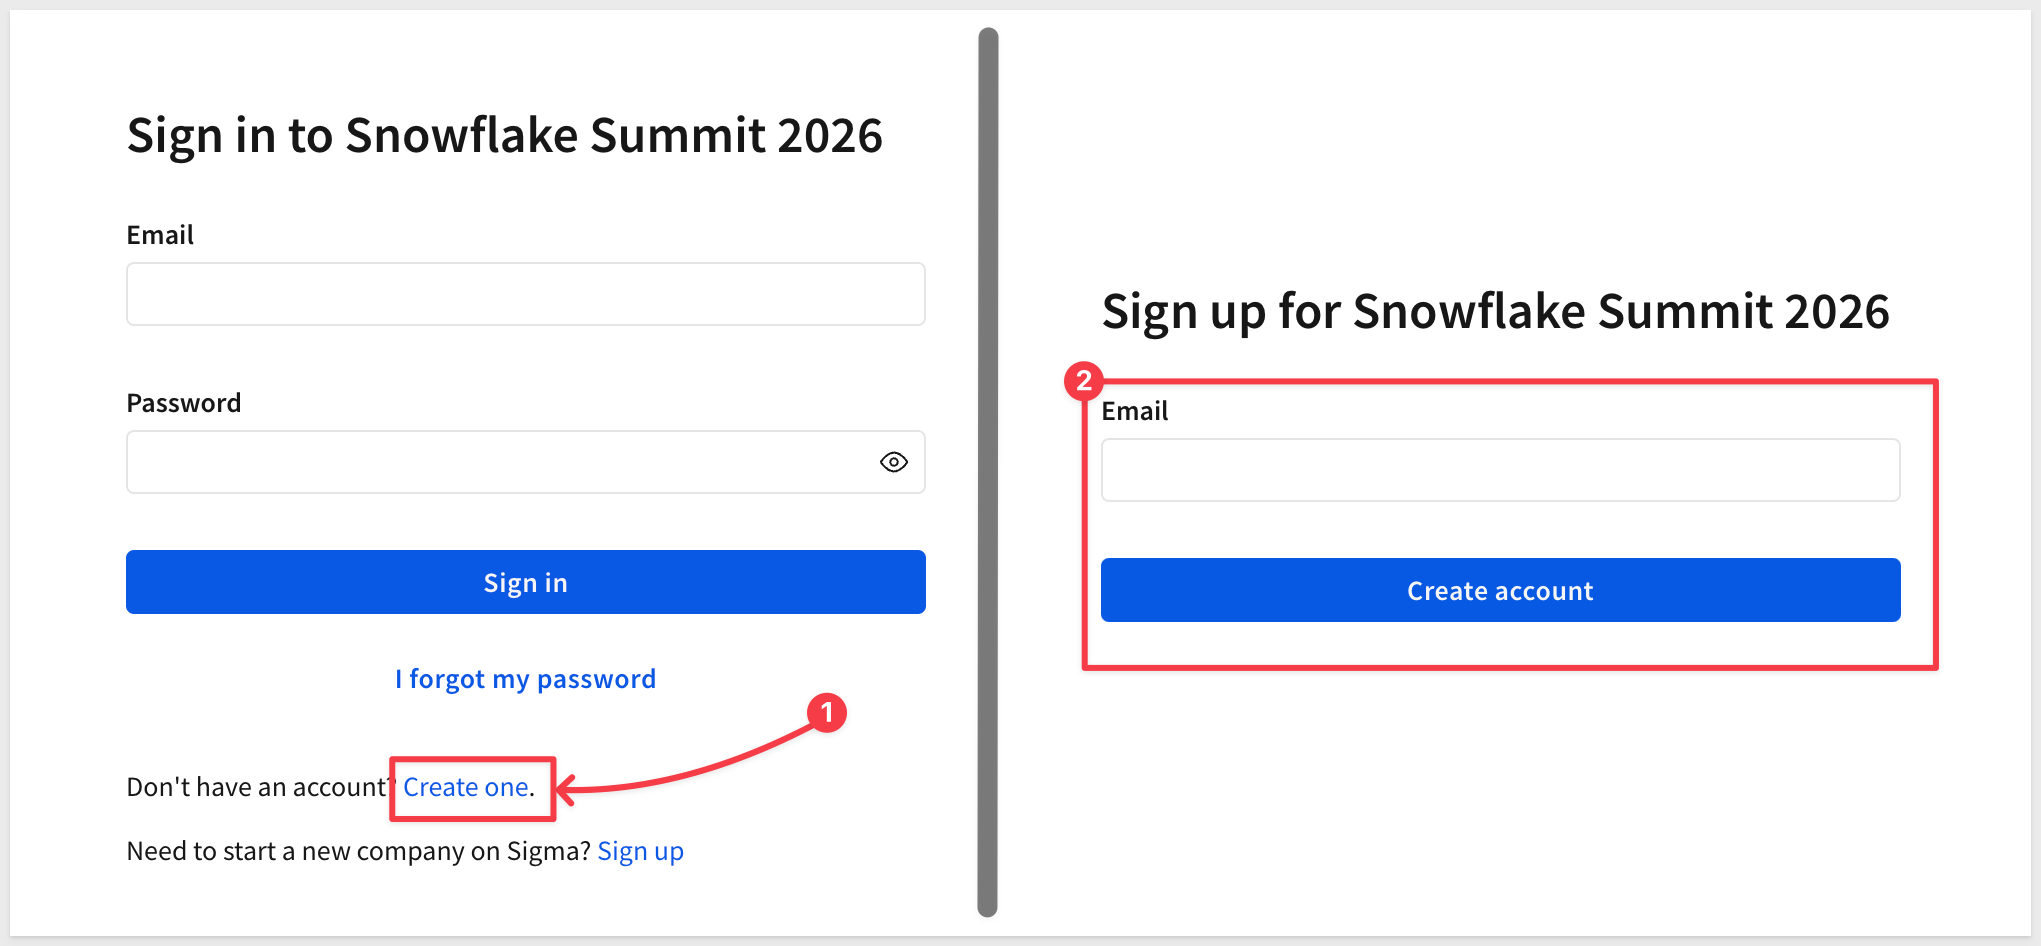
IMPORTANT: Do not sign up for a new Sigma trial for this lab! Use only the URL and instructions provided by your lab facilitator.
3: Check your inbox for a message from info@send.sigmacomputing.com and continue the sign-up process by clicking the link in that email.
4: Enter your information as prompted and click Submit.
5: Once you see the homepage, you’re ready to proceed!
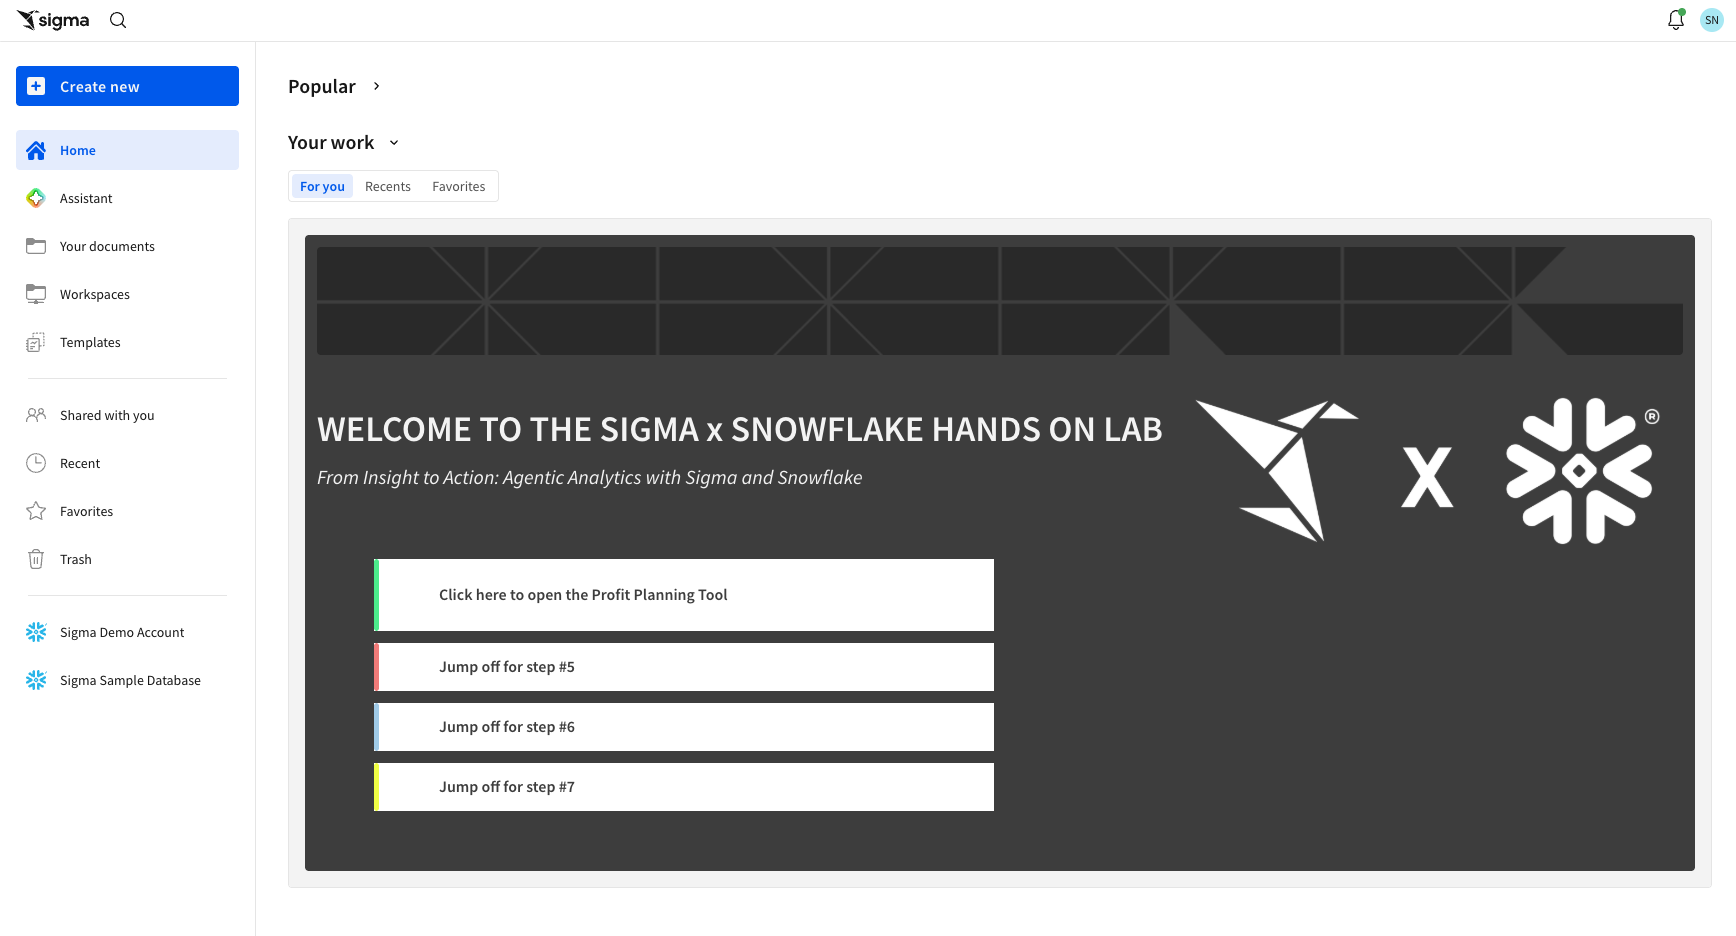
Sigma Assistant
To understand profitability for this year’s product lineup, we need insight into current performance. As new users at Big Buys, we don’t know the data’s location. Let’s use Sigma Assistant to get started.
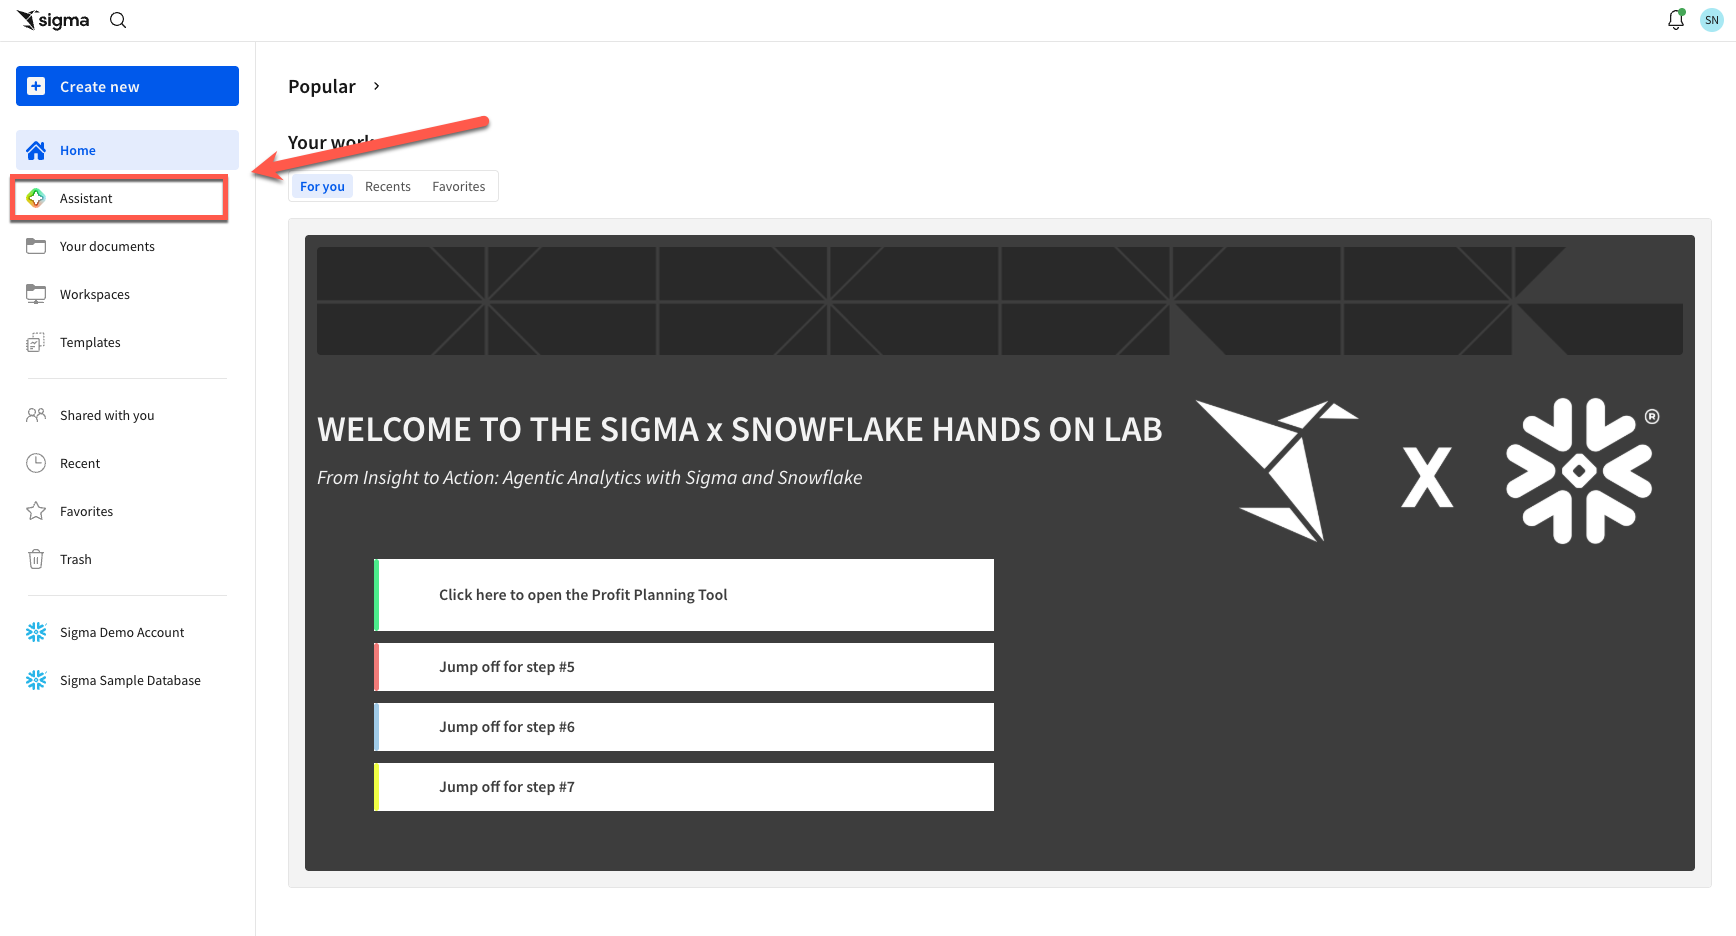
1: Open Sigma Assistant from the left sidebar to ask a question and get a starting point for analysis:
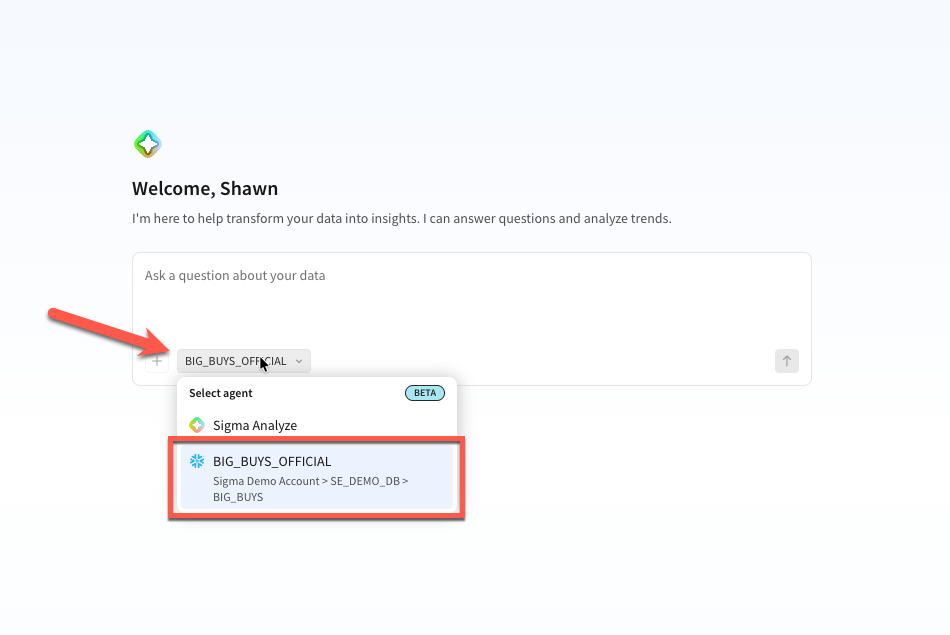
2: In dropdown select the BIG_BUYS_OFFICIAL Cortex Agent. This will route our question directly to the agent instead of Sigma's default Assistant (which is still powered by Cortex)
3: In the text box, type: How are computer products performing across regions? and click the black arrow:
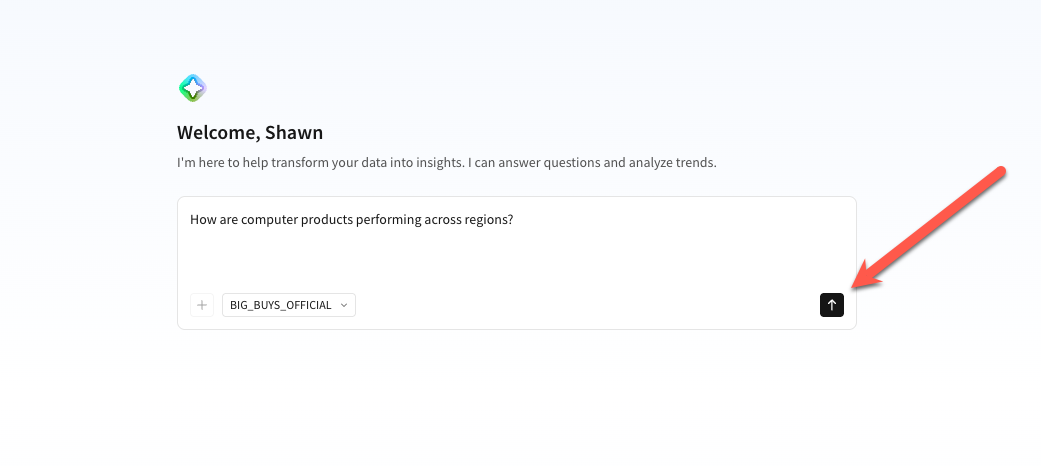
NOTE: The response comes from a Cortex Agent, so your output may differ slightly from this guide.
Notice that the Cortex Agent is suggesting we use the BIG_BUYS_SALES_ANALYST Cortex Analyst, and that it walks through its reasoning.
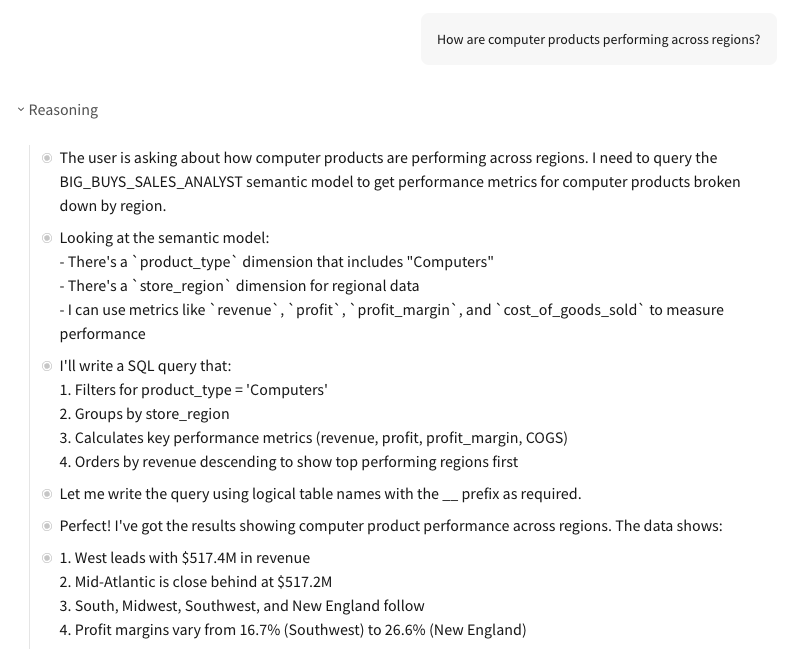
As the agents responds it provides both top level analysis and a breakdown of how it built the output.
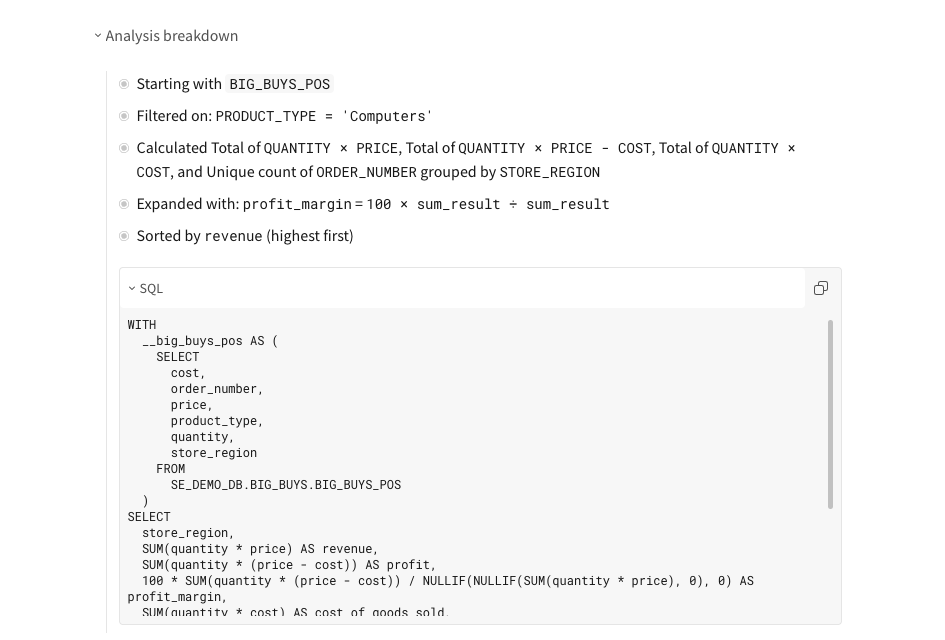
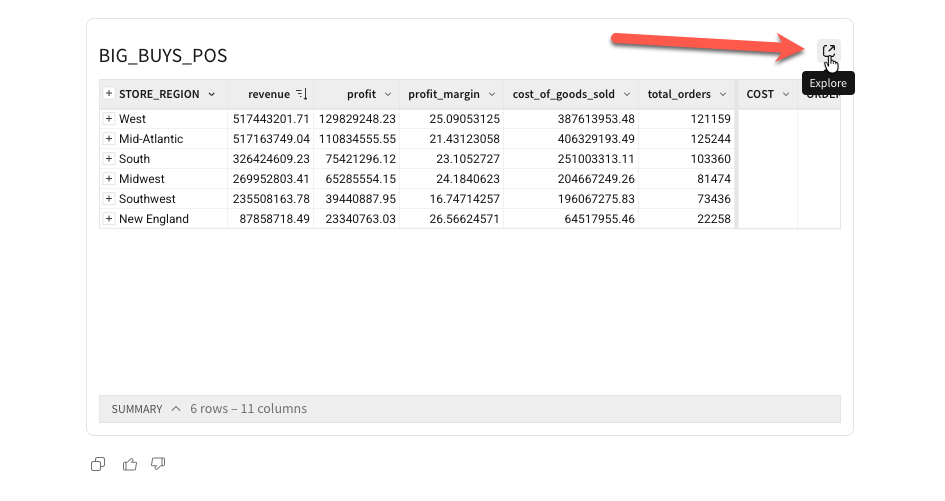
4: With your cursor over the table, click the Explore icon in the top-right corner to explore the data in a spreadsheet interface and begin analysis:
Find Underperforming Brands
1: To ensure that we are at the same spot, make sure that your table has the same columns in the grouping the one pictured here. If there are any missing ones, drag them into the calculations under the store region grouping. Lets also rename the columns to: Total Revenue, Total Profit, Total COGS, and Profit Margin. We should also use the formatting bar to set three columns to use Currency and Profit Margin to %:
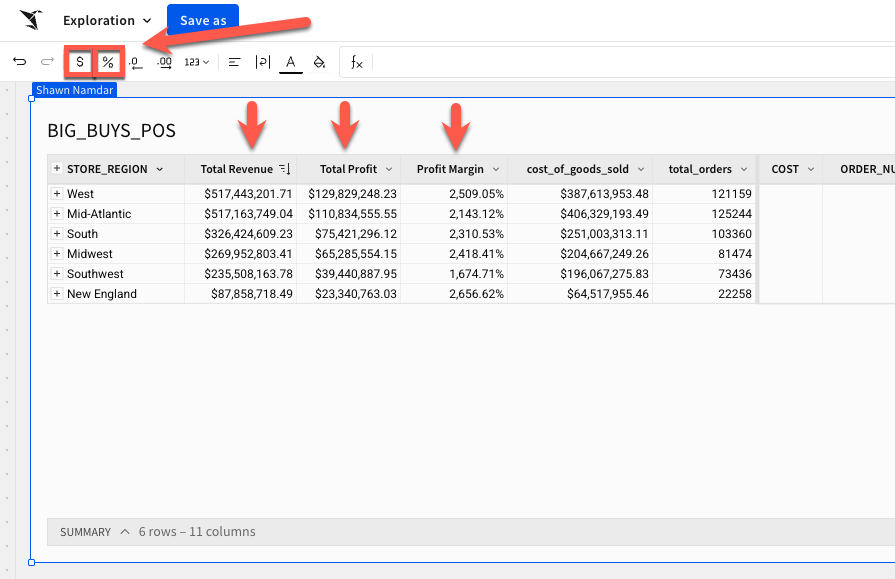
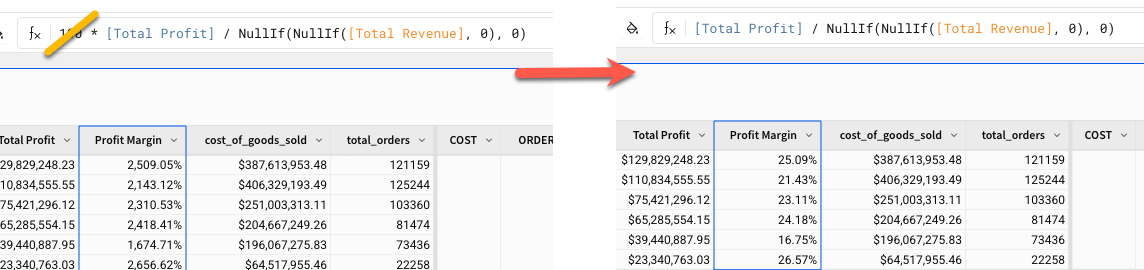
NOTE: In this case the agent decided to multiply the profit margin by 100 so that the default output would not show as a percent. We need to modify the formula to remove the unneeded step in the calculation.
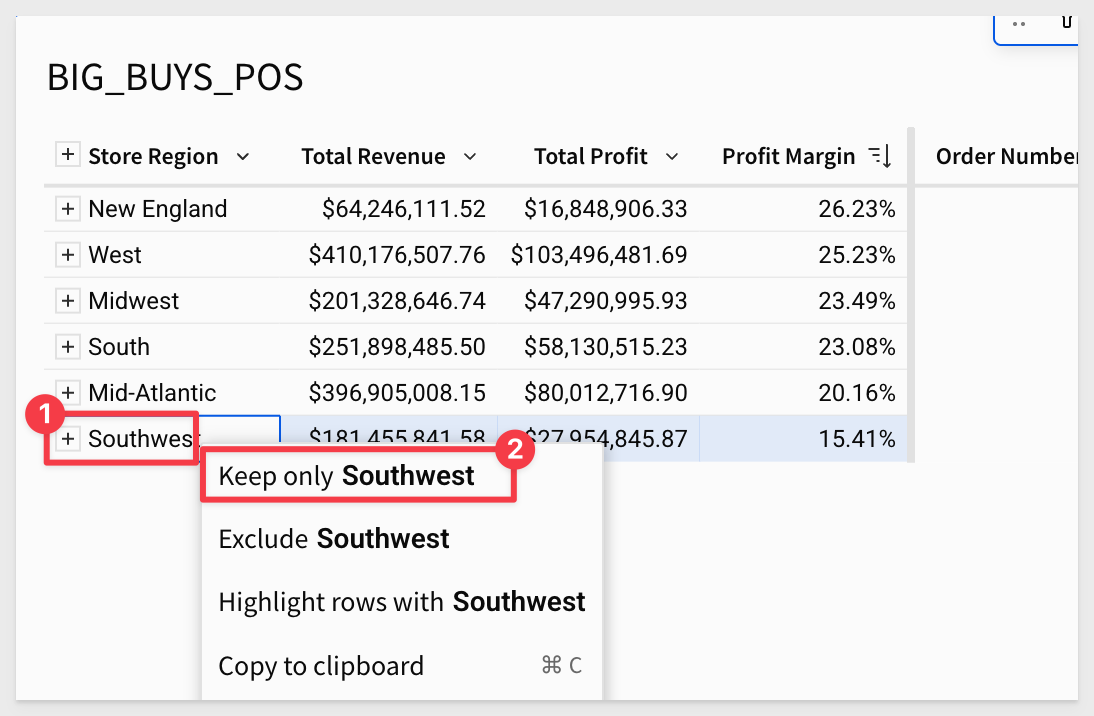
2: The first thing that we noticed is the Southwest is the lowest performing region out of the whole Big Buys network of stores.
3: Let's right click and keep only the Southwest region:
4: Next, let's drag in the Brand column to the grouping level on the right hand side:

5: Now let's sort the Profit margin column descending so that our highest margin brands in the Southwest region are at the top and the lowest ones are at the bottom:

6: We should add in some conditional formatting to make this easier to look at. Let's go ahead and right click Conditional formatting on the column and add in data bars from the configuration pane on the right side:

7: With a little bit of color, we can easily see there are certain brands that are losing us money and others are performing great. To improve overall profitability, we could drop some brands but before we do that, let's inform our decision with some additional outside data:

8: Luckily we have a CSV of product reviews that we are able to load into Sigma and directly leverage in our analysis.
Since we are using Sigma on top of Snowflake, we don't even have to wait for our data team to load the data in. We can do it right here right now.
Let's click on the table button on the left side of the Element bar:

Then select the CSV option:

From there we can drag and drop or browse to find the CSV file we downloaded:

Sigma reads the file so we can review it and then click Save:

9: With these 5000+ product reviews, we need to create a quantitative score to leverage in our analysis. So, we could either go one by one and write our own score or let's just leverage Snowflake Cortex to go through and provide us a sentiment analysis on each review.
Right click the Review column and select Add column:

10: With the new column selected go to the formula bar and type in:
sentiment(Review)
You may want to reduce the decimal places shown too:
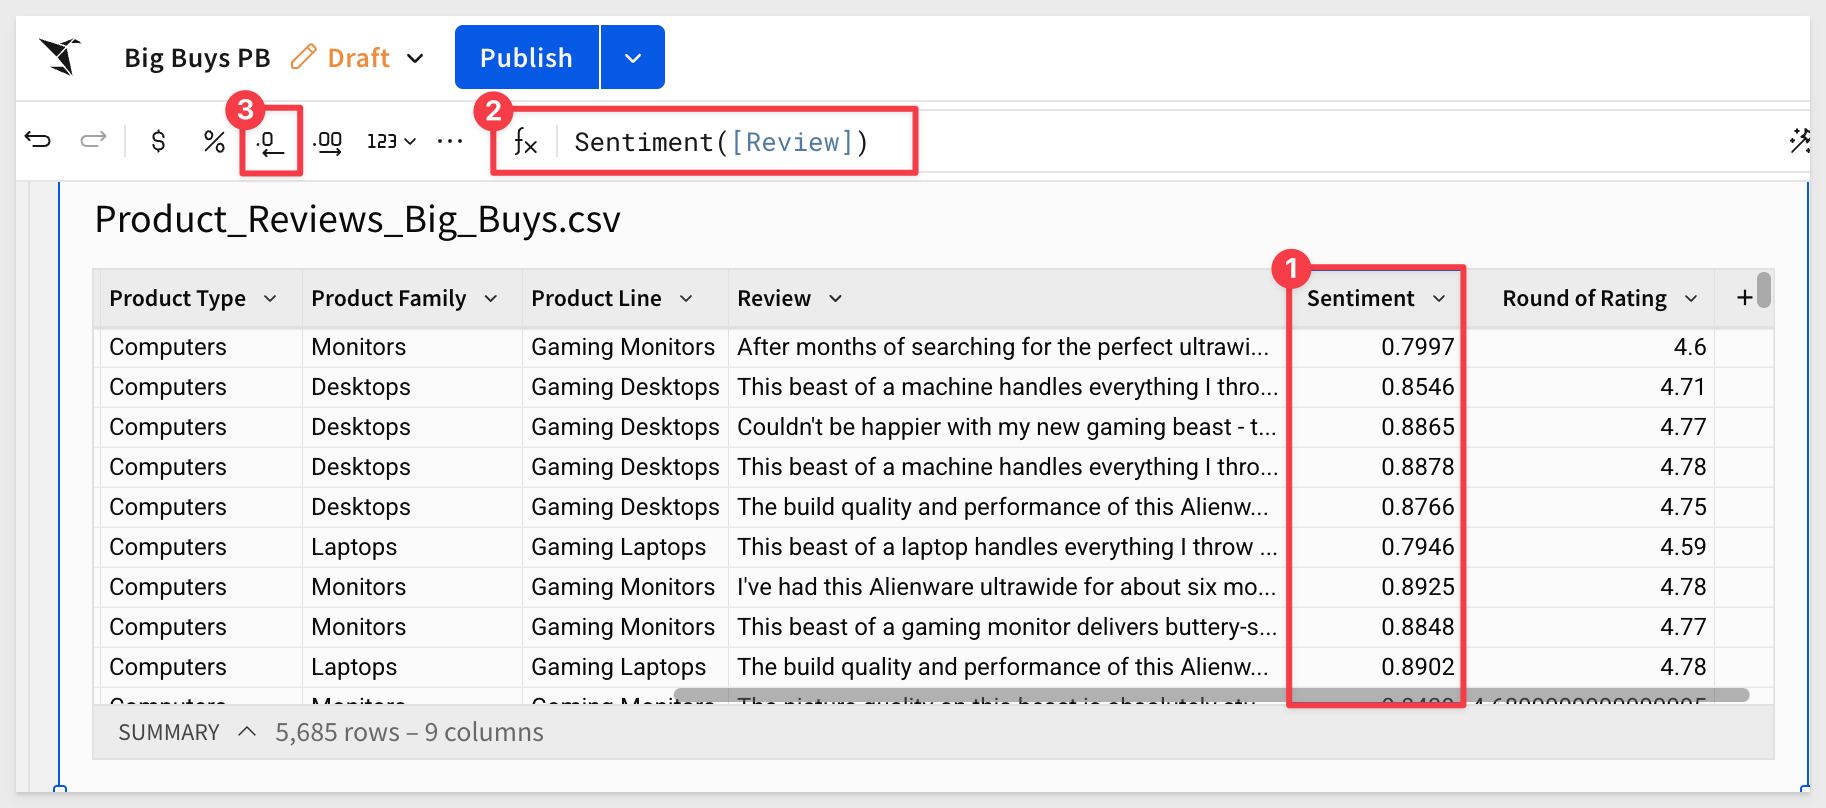
11: Now we need to tie this to our BIG_BUYS_POS table. In Excel, you can do this with a Vlookup. Luckily Sigma has the same paradigm. On the BIG_BUYS_POS table right click Brand and select Add column via lookup.
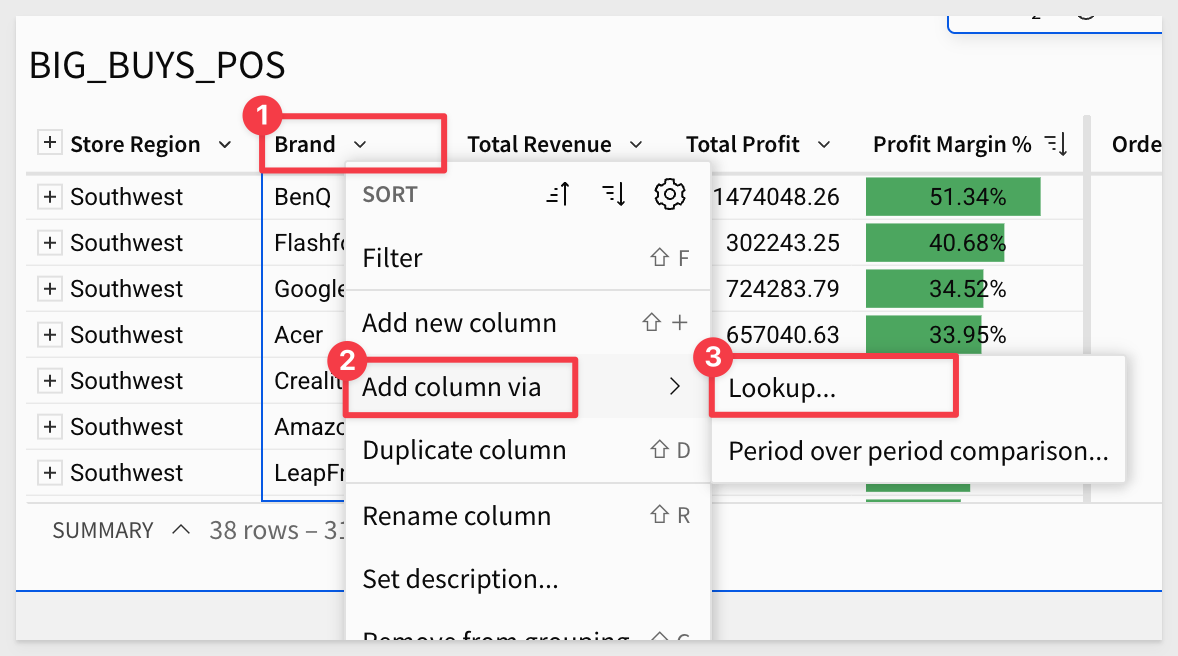
12: In the modal, select the Sentiment column as the column to add, set the aggregate to Average, You will notice that brand has automatically been matched to Brand for us.

Once you click Done, you'll notice that the sentiment scores have now been averaged and tied to their respective brands.
13: With our new looked up column selected, rename it to Avg Sentiment and go to the top bar and hit the decreased decimal point button twice so that we have a simpler number.
You may have also noticed that Sigma lets you see the formula that the Add column via lookup created for us:

Then right click the Sentiment column and select Conditional formatting. This time let's add a color scale:

14: Now, just a few minutes later, we have a strong understanding of which brands are our least profitable ones, and which brands are preferred by our customer base.
Mock Up Price Changes
The next step is to set up the Price Changes linked input table that our Sigma Agent will populate with recommendations.
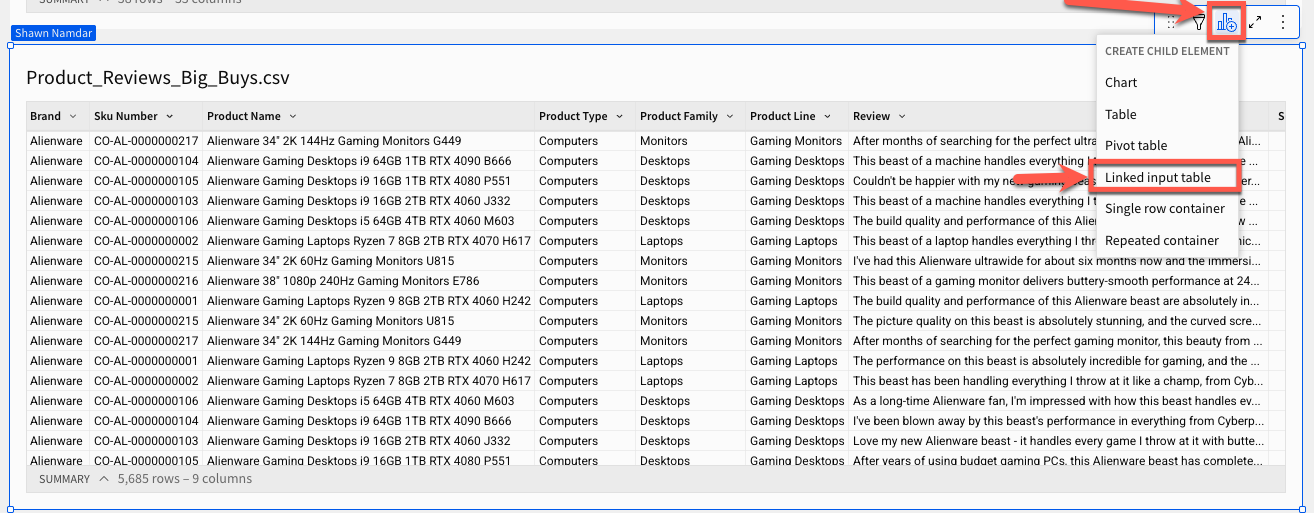
1: From the Product_Reviews_Big_Buys.csv table, select the create child element icon and the select Linked input table:
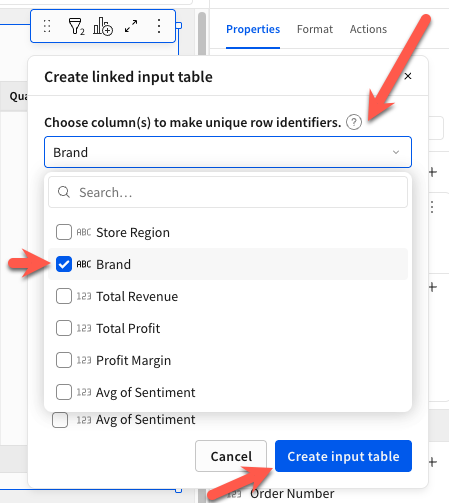
2: From there, click the Choose column(s) to make unique row identifiers drop down, and select Brand. Finally click the Create input table button.
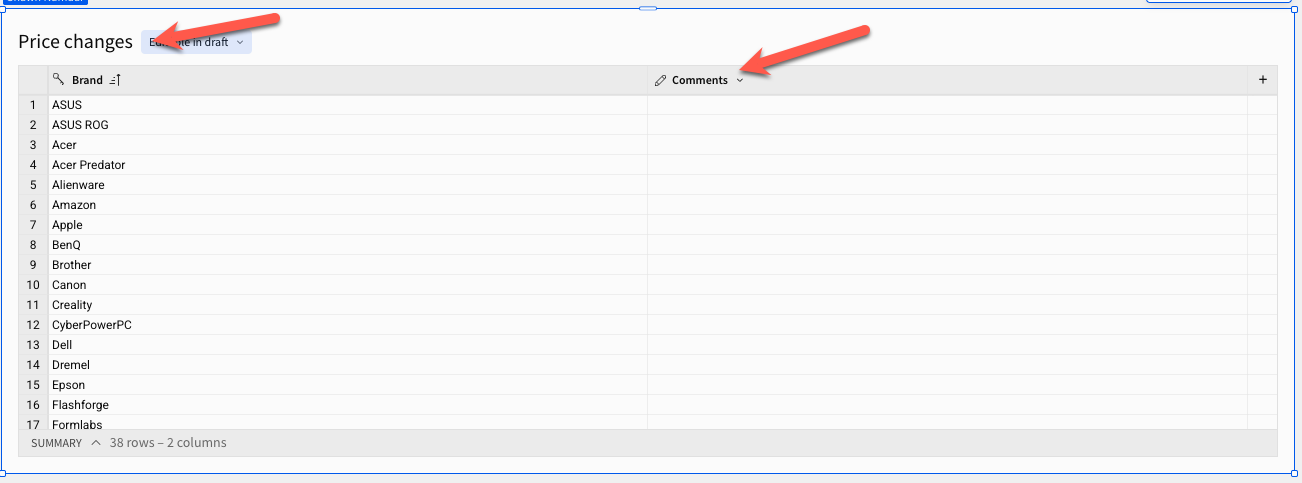
3: Rename the input table to Price Changes, and the default Text column to comments by double clicking on the respective names:
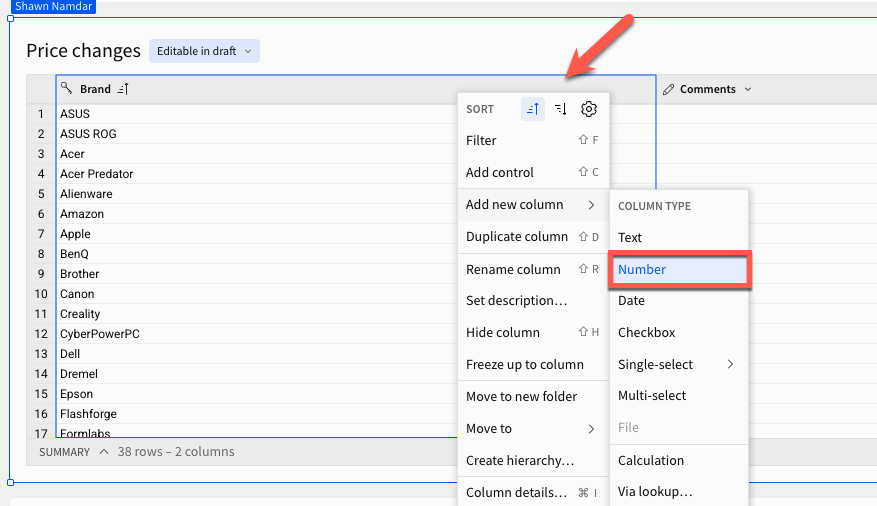
4: Right click the Brand Column and select Add new column then click on Number. Rename this new column Price Change.
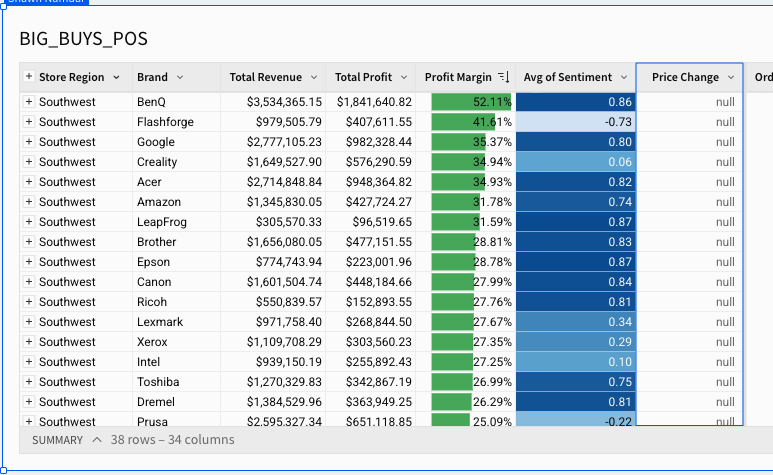
5: Now on the Brand column on the BIG_BUYS_POS table, right click and select Add column via lookup.
Choose the Price Changes table that we just created and set the Column to add to Price Change with Brand set as the matching key:

6: Rename the new column to Price Change.
These values should show up as Null right now since we havent entered any changes, but now we're ready to build our model:
7: In some cases the AI does something unexpected and we don't catch it right away. In our case we just noticed it did not group the COGS column to create Total COGS as might be expected, but that is easy to correct.
We can drag COGS into the grouping after the Total Profit column and rename it to Total COGS:
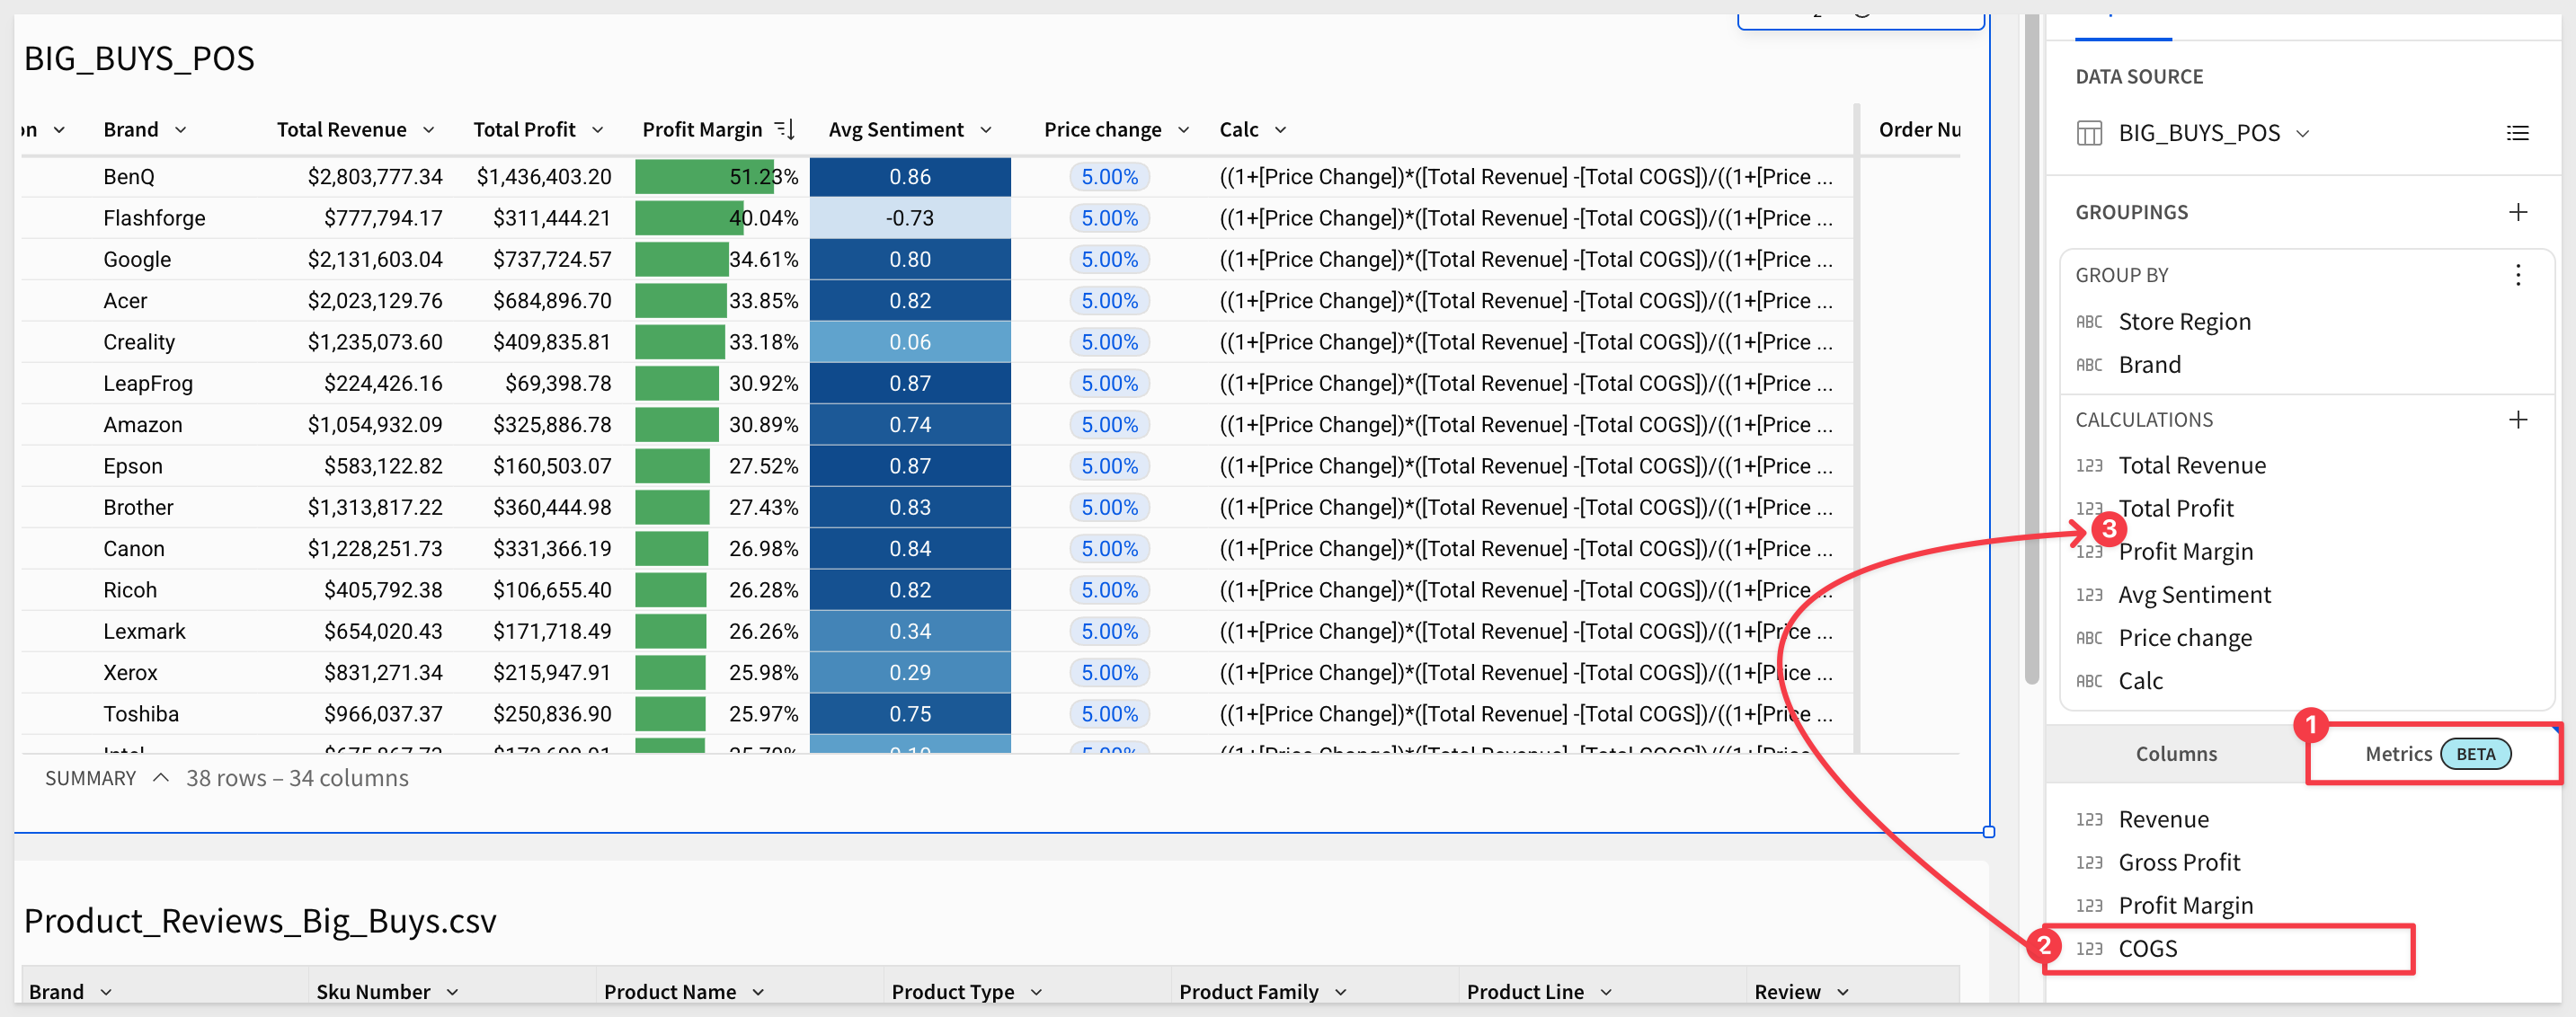
NOTE: If "Total COGS" is present in your table, ignore the instructions to add it manually.
8: We want to compare the original gross margin to the price change.
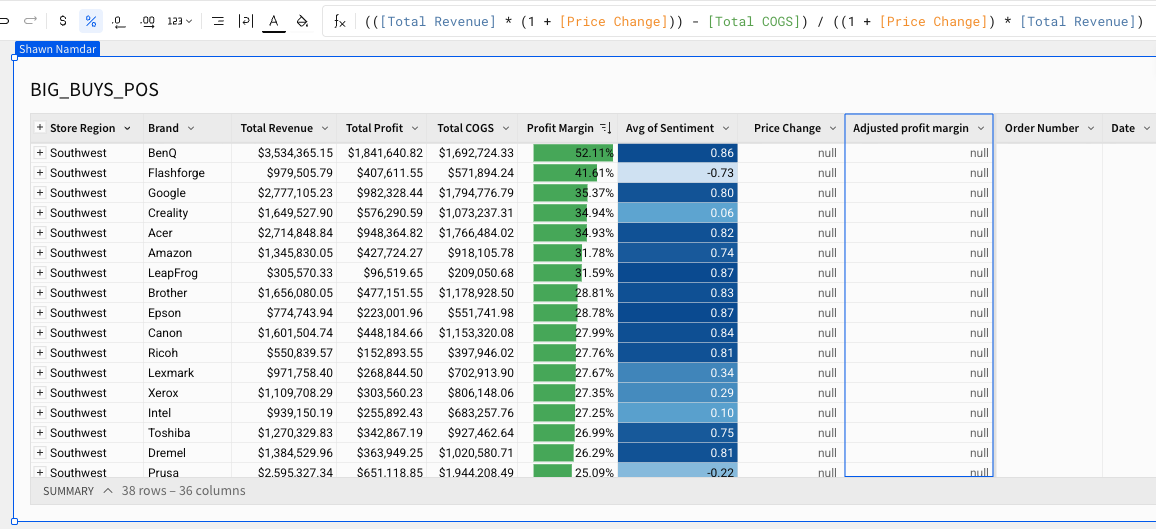
Add a new column to the right of the Price change column and rename it Adjusted profit margin.
Set its formula to:
(([Total Revenue]*(1+[Price Change])) -[Total COGS])/((1+[Price Change])*[Total Revenue])
Change the column format to Percentage. Note this column will still be Null as we have not entered any price changes yet:
We are ready to make a visualization.
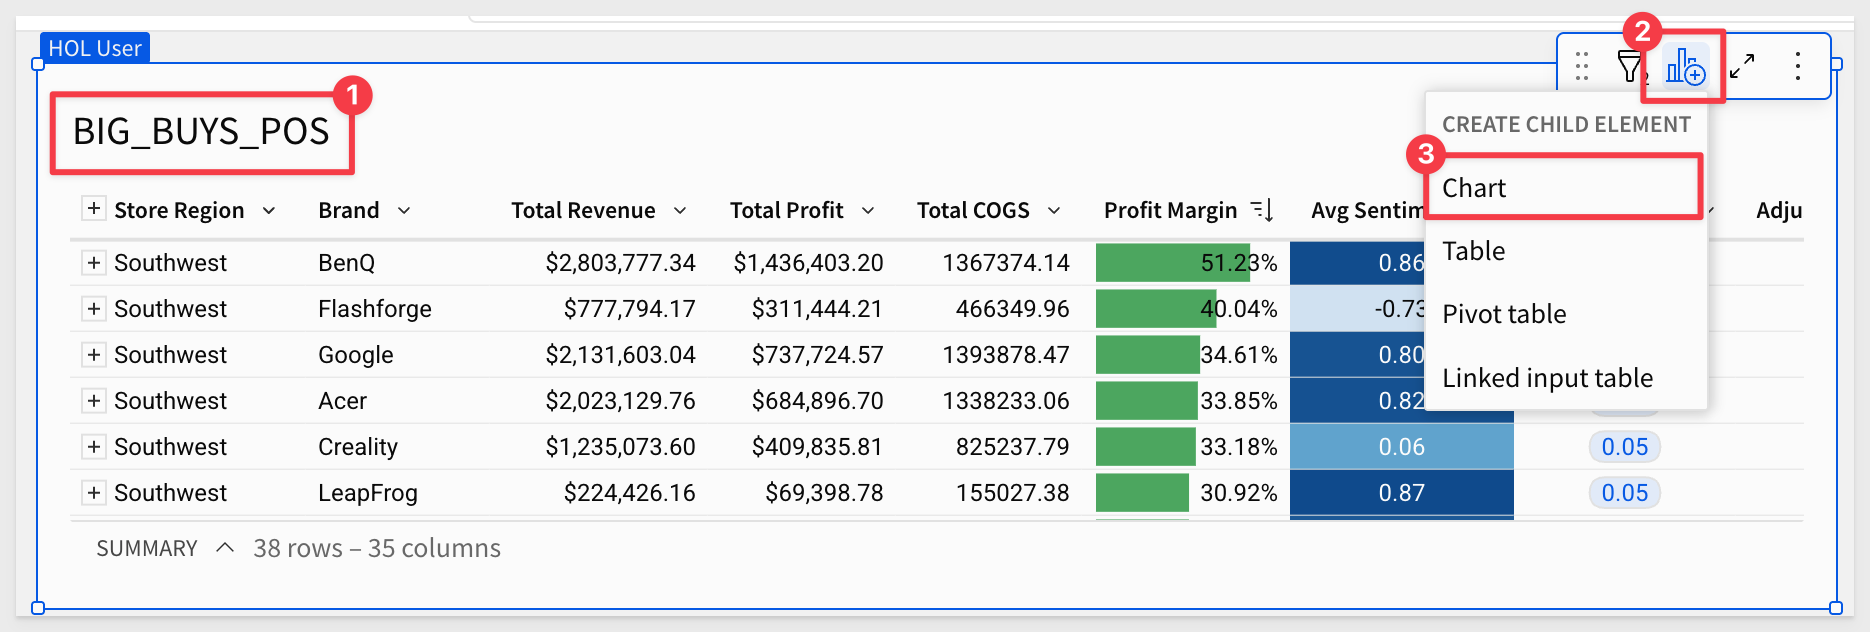
9: Click the Add child element button in the top right of the table and select Chart:
10: Drag Brand to the X axis and the Profit Margin to the Y-Axis. Then change the chart to be vertically aligned by swapping the axes:
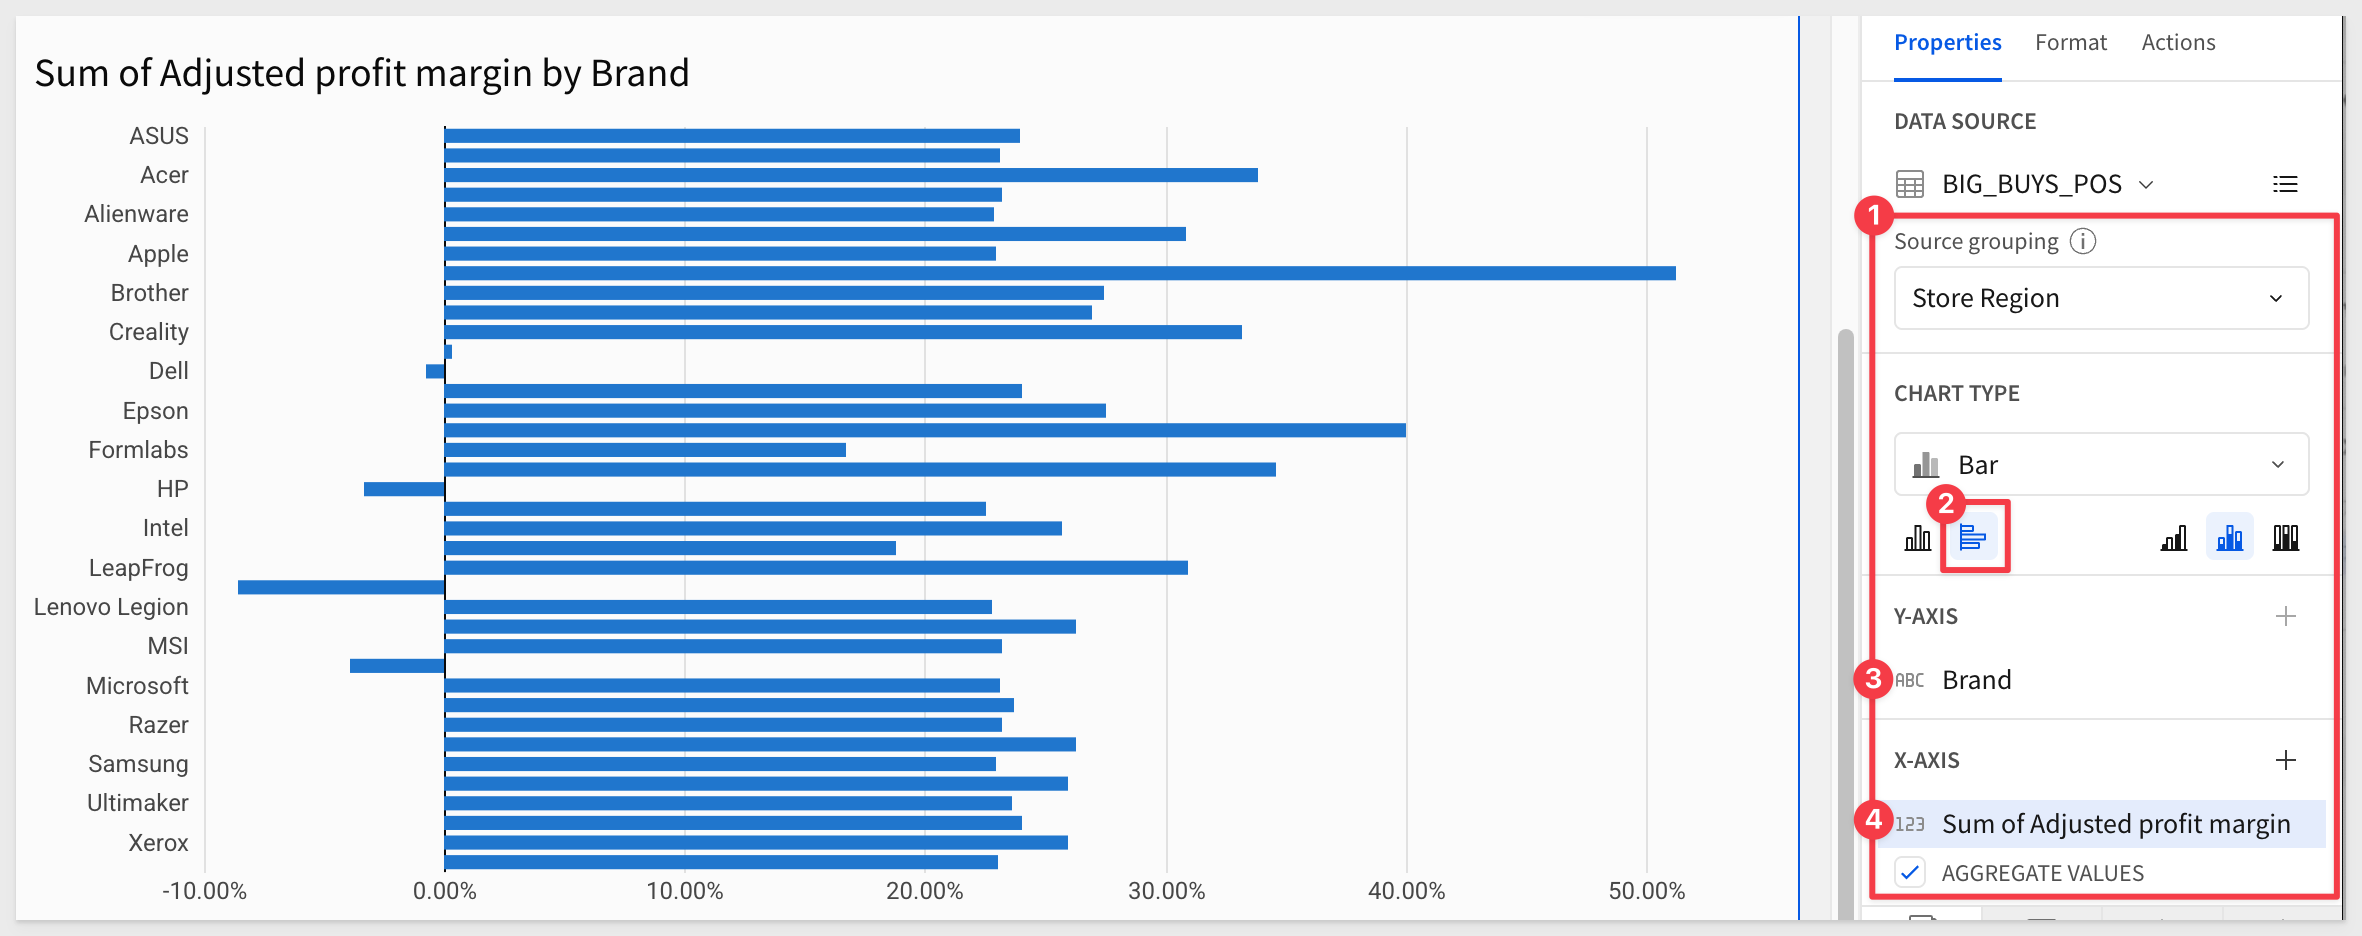
11: Add the Adjusted profit margin column to the X axis and select Unstacked for the bar chart style, but nothing should new show up since we still have not added price changes.
Now we’re ready to generate our price recommendations using a Sigma Agent.
Sigma Agent Pricing Recommendations
Rather than manually entering price adjustments, we’ll use a Sigma Agent to analyze our brand performance data and generate recommendations based on both the profit margin and sentiment data we’ve gathered.
1: In the element tray at the bottom of the screen select UI then click Chat. This will create a chat element where we can showcase our agent.
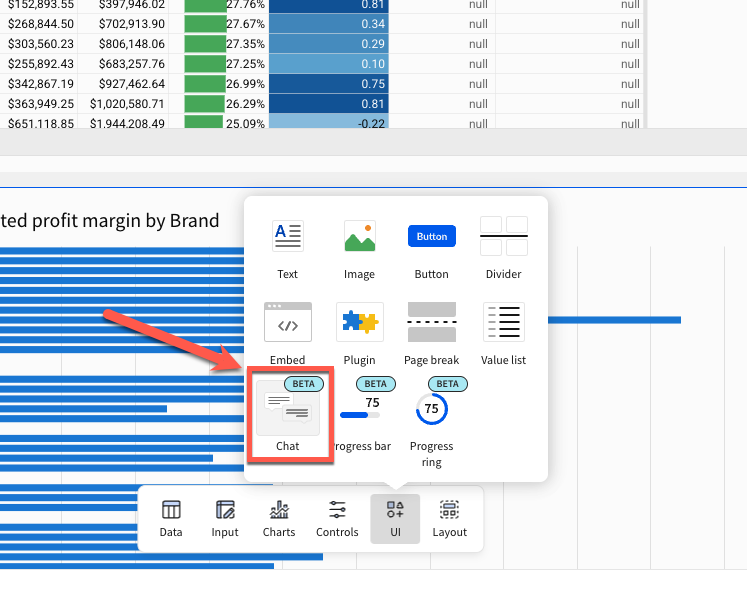
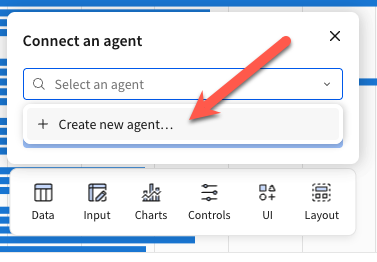
Then select Create New Agent.
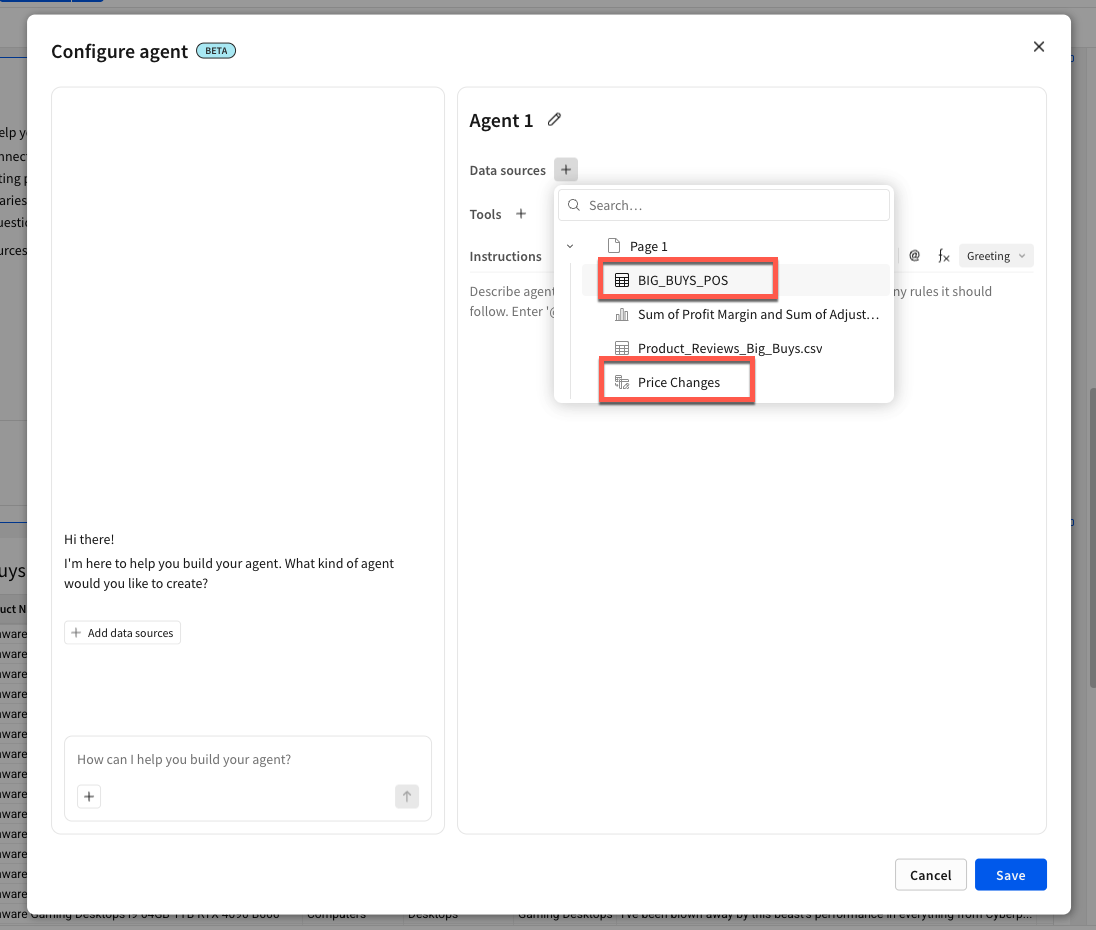
2: The Configure Agents window should now be open. This is where we can provide Sigma instructions and tools for the agent to do work for us. First we need to give the agent access to two data sources. In the Data Sources section click add and select BIG_BUYS_POS and then Price Changes.
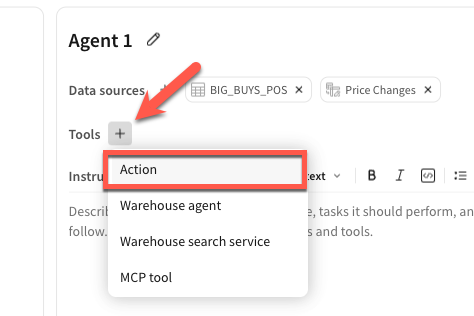
3: Next we have to give the agent a tool to use to update our prices changes in the input table. Click the add tool icon and then select Actions:
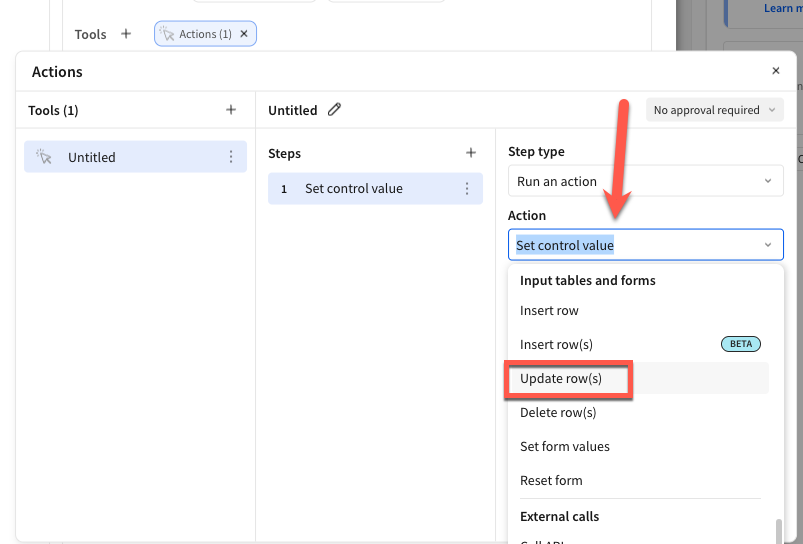
Then in the Action type dropdown select Update row(s)
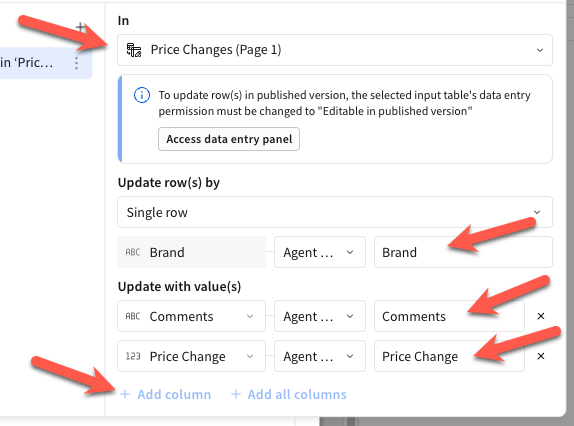
4: Configure the Update row(s) action to work on the Price Changes linked input table as a Single row update. Ensure all columns have been added by clicking the Add column button at the bottom of the modal and configure all columns to be set by Agent input with a value of the column's name.
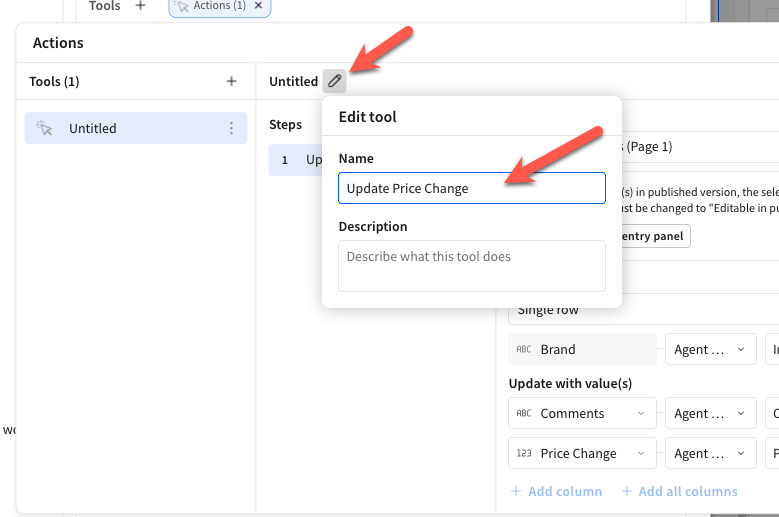
5: Rename the newly created tool to Update Price Change by clicking on the pencil icon in the top middle of the modal.
6: Finally copy the instructions below into the Instructions panel.
Role
You are a pricing analyst assistant. Your job is to review brand-level performance data and write price change recommendations into the Price Changes linked input table, one brand at a time.

Data Available
You have access to two tables in this workbook:

The BIG_BUYS_POS table, which contains Brand, Profit Margin, and Avg Sentiment for each brand in the Southwest region.

The Price Changes linked input table, which has a Brand column, a Price Change % column (expressed as a decimal, e.g. 0.07 for 7%), and a Comment column.

Step 1: Read and decide
Read all rows from the BIG_BUYS_POS table in a single pass. For every brand, determine its Price Change % value and Comment using the logic below. Record your complete decision list internally before making any writes. Do not call the Update Price Change tool until every brand has a recommendation.

Step 2: Determine a recommendation for each brand
Use Profit Margin and Avg Sentiment as your two primary signals. Weight margin more heavily for brands in distress (near zero or negative). Weight sentiment more heavily when deciding between holding and a modest increase for healthy brands. Treat the two signals together rather than applying fixed thresholds. A brand at 27% margin with 0.29 sentiment should be treated differently than one at 27% margin with -0.73 sentiment, even if both fall below a 0.3 cutoff. Recommend the price change a thoughtful analyst would defend to their manager.

Step 3: Write all rows
Once your full decision list is complete, work through it and call the Update Price Change tool for each brand back to back without pausing to re-read or re-reason. For each update write:

The Price Change % value as a decimal rounded to two decimal places.

A Comment of one to two sentences that references the specific Profit Margin and Avg Sentiment values and explains the recommendation. Example: "Profit margin of 4.2% is below threshold and avg sentiment of 0.68 indicates strong customer preference. Recommending a 7% price increase to improve profitability while demand remains favorable."

One tool call per brand, in order, until all brands are complete. Do not skip any.
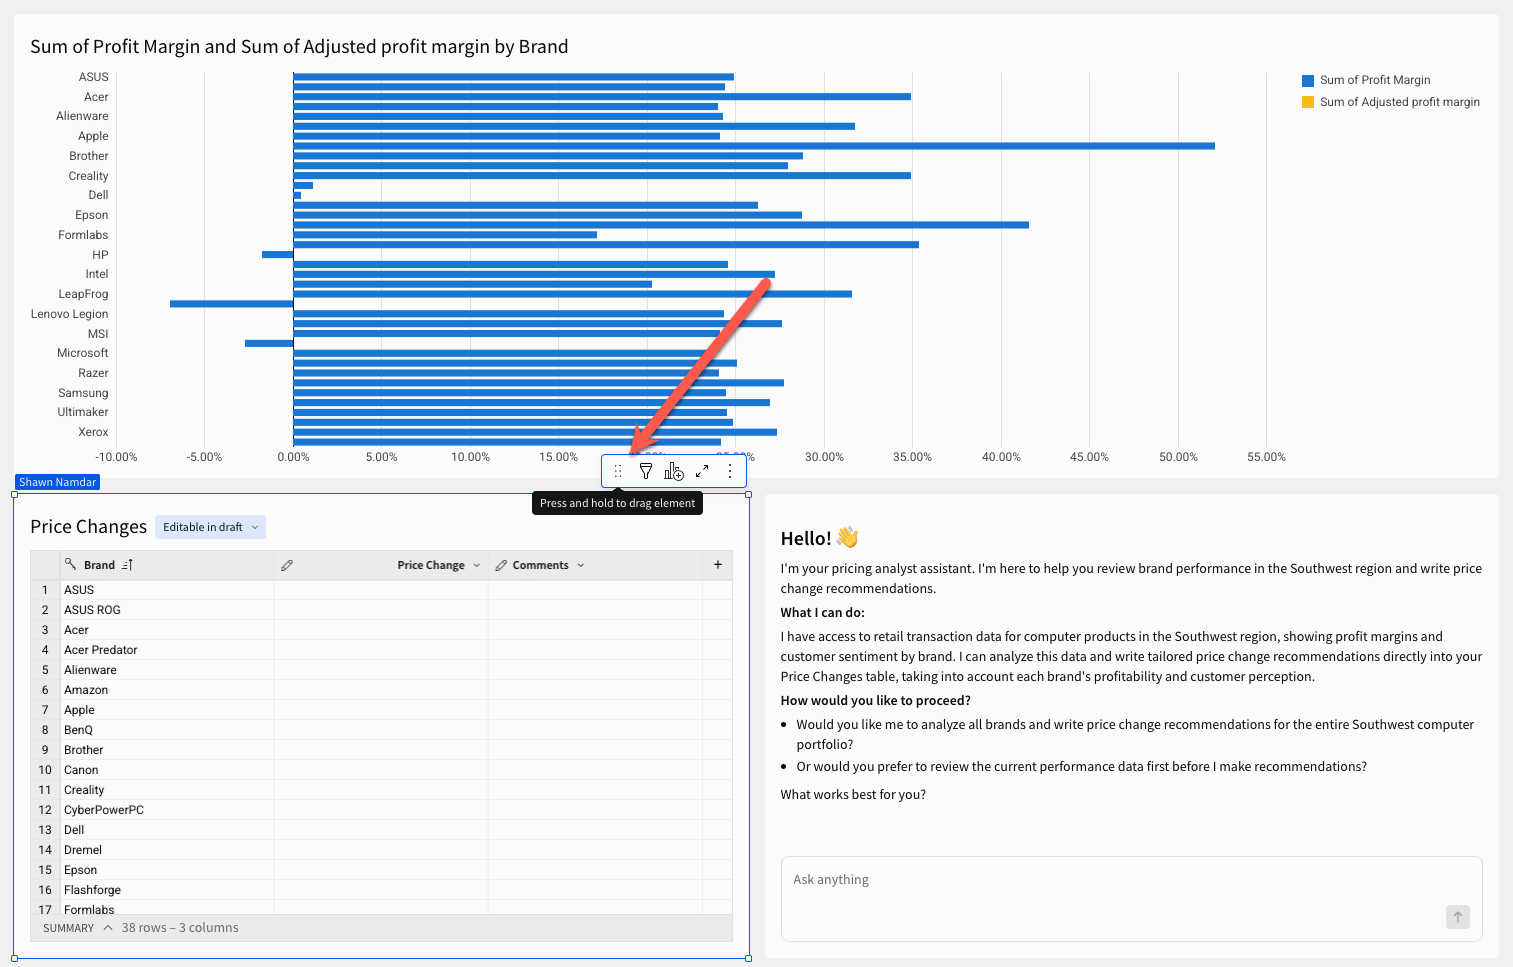
7: Let's reorganize the page so that the Price Changes input table is side-by-side with the agent, and the graph we made earlier is directly above them. Note you can move elements by clicking on the 6 dots icon in the top right of the element and resize them by hovering over the edge and having your cursor turn into arrows.
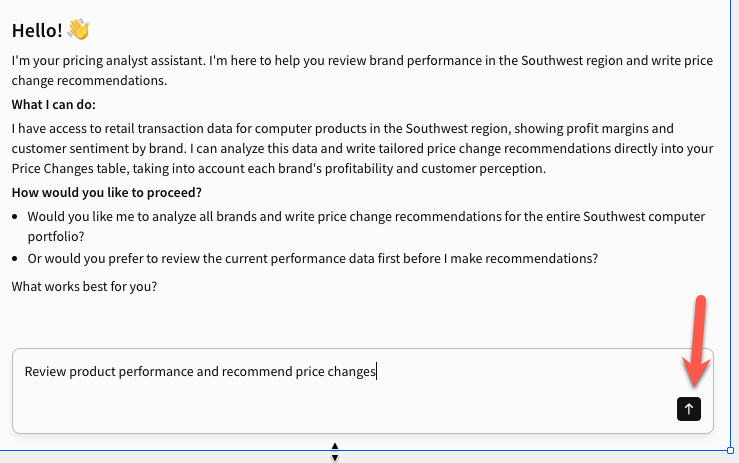
8: Lets ask the agent to Review product performance and recommend price changes by putting that in the chat box and clicking the arrow icon.
9: The agent completes its full analysis first, then executes all writes in quick succession. You should start to see pricing recommendations populating, and the data points showing up in the lookup columns in the BIG_BUYS_POS table and the graph.
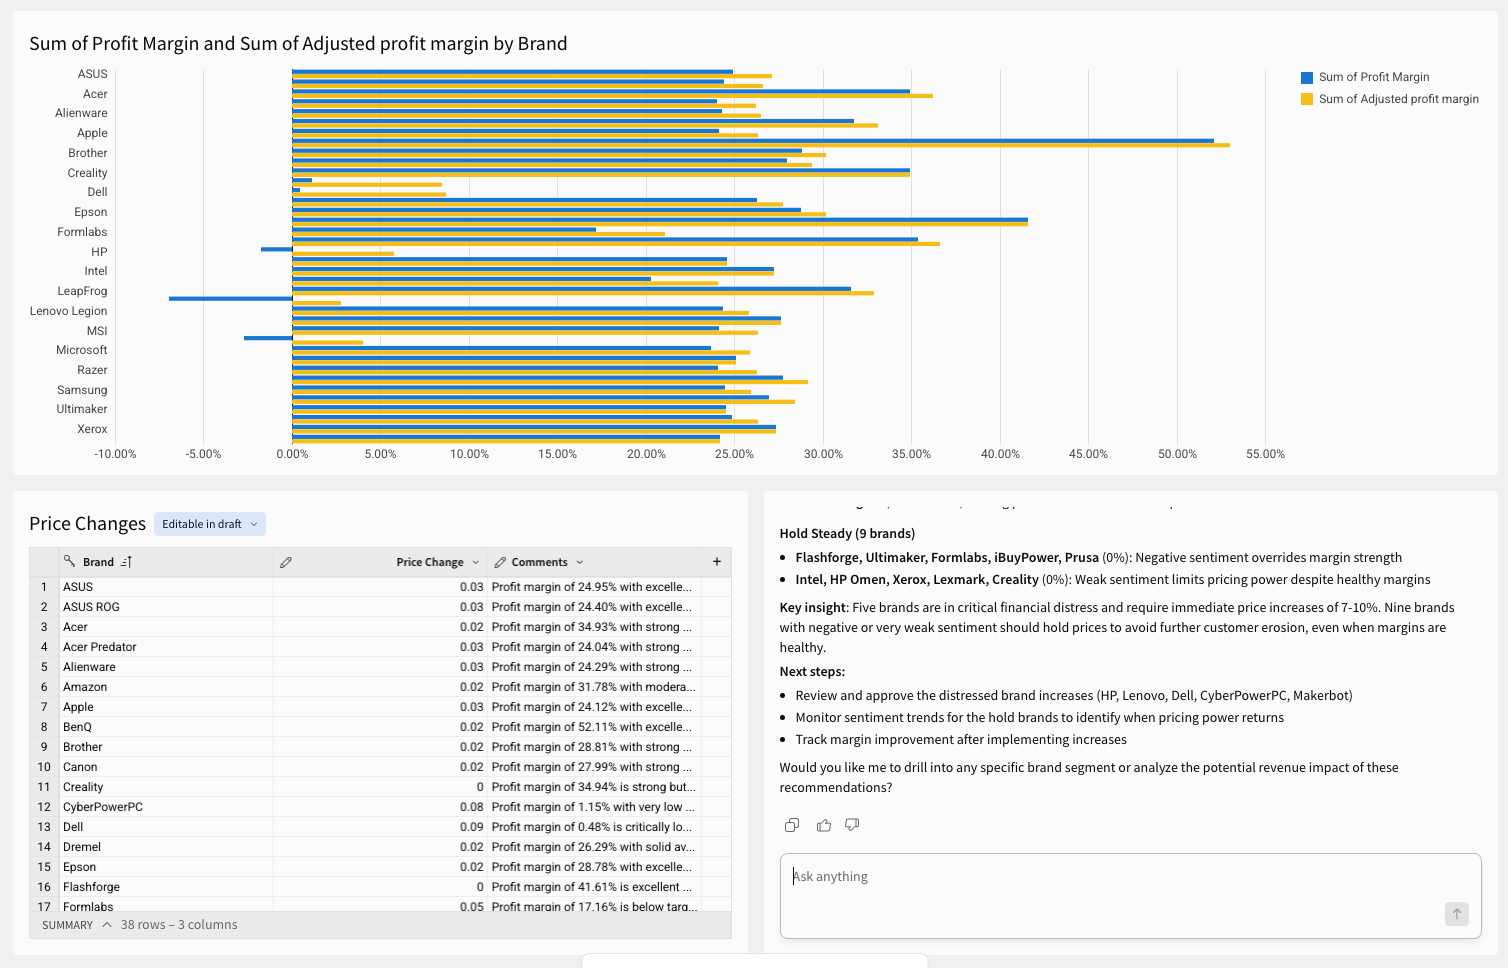
Once the agent has finished, review its recommendations. Notice how it has balanced margin recovery with customer sentiment to arrive at each suggested price change. You can adjust any values you disagree with before moving on.
When you’re ready, click Save As and save the workbook as Big Buys - {first name_last name}. This naming format helps us identify your work if others need to review it.
Use Big Buys’ corporate profit planning application
1: Let's navigate to the home page and open up the Big Buys Profit Planning Tool, from the home page.
2: This application was built by Big Buys' central IT team as a Sigma AI App. It allows team members to submit and approve distinct pricing scenarios collaboratively.
We’re going to create our own pricing scenario based on what we just learned. Let's click the Create New Scenario button in the top left:

3: Provide a name for your new scenario and type in a quick description. Then click Create and let's go plug in some numbers:

Since this profit planning tool is shared with all category managers at Big Buys, it’s not filtered by default to any specific product type.
4: Let's go ahead and filter it to Computers and then set the Store Region to Southwest:
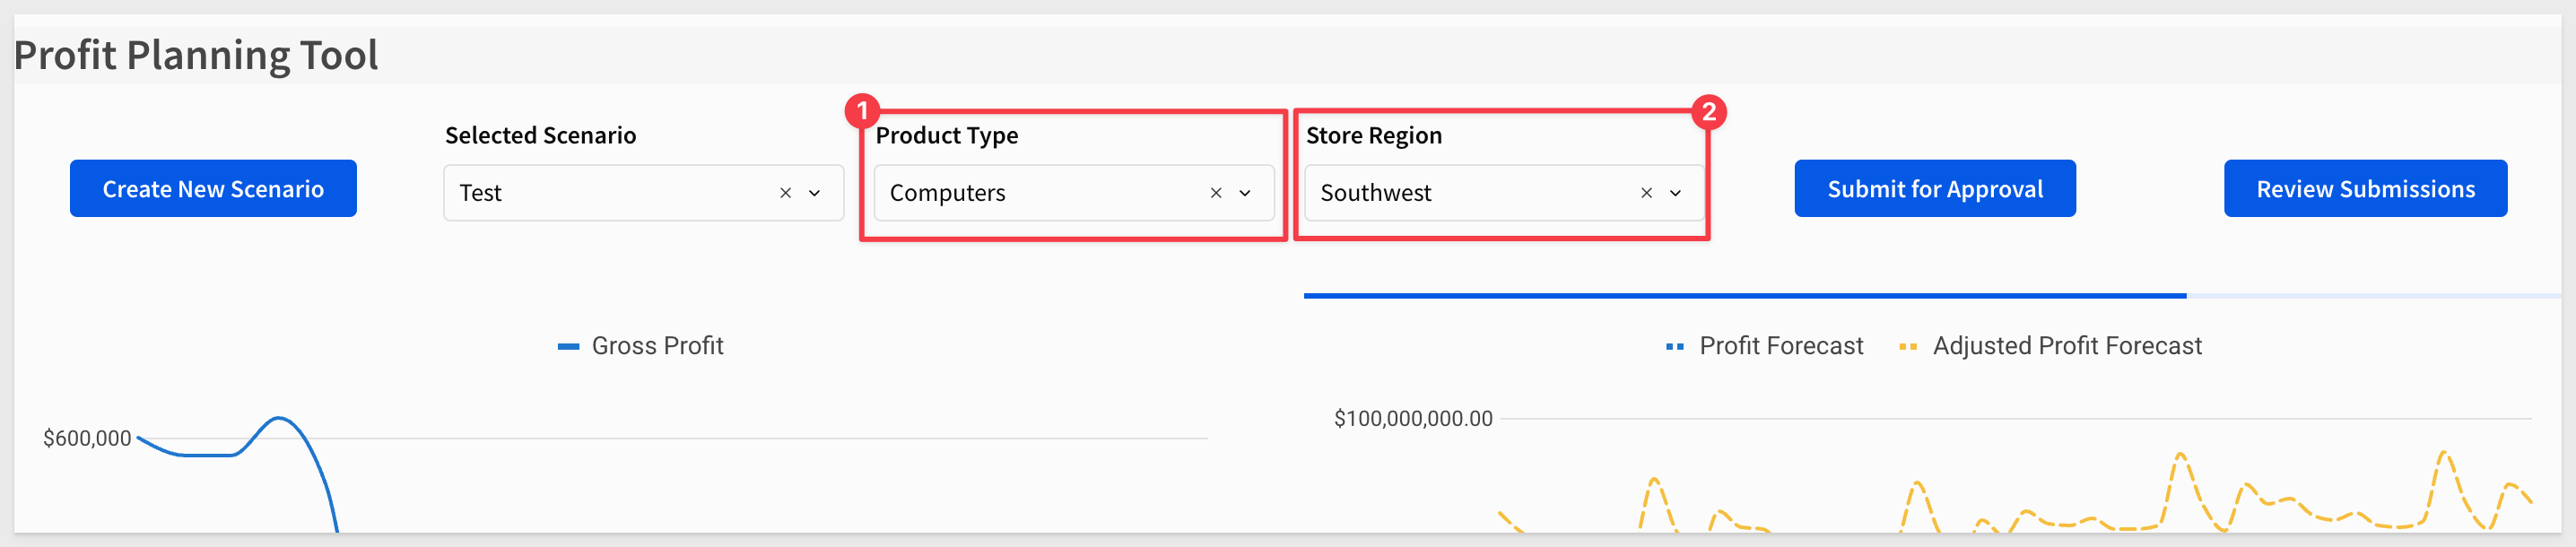
5: After applying the filters, you'll see the profit margin over time for that subset, along with a Snowpark forecasting model:
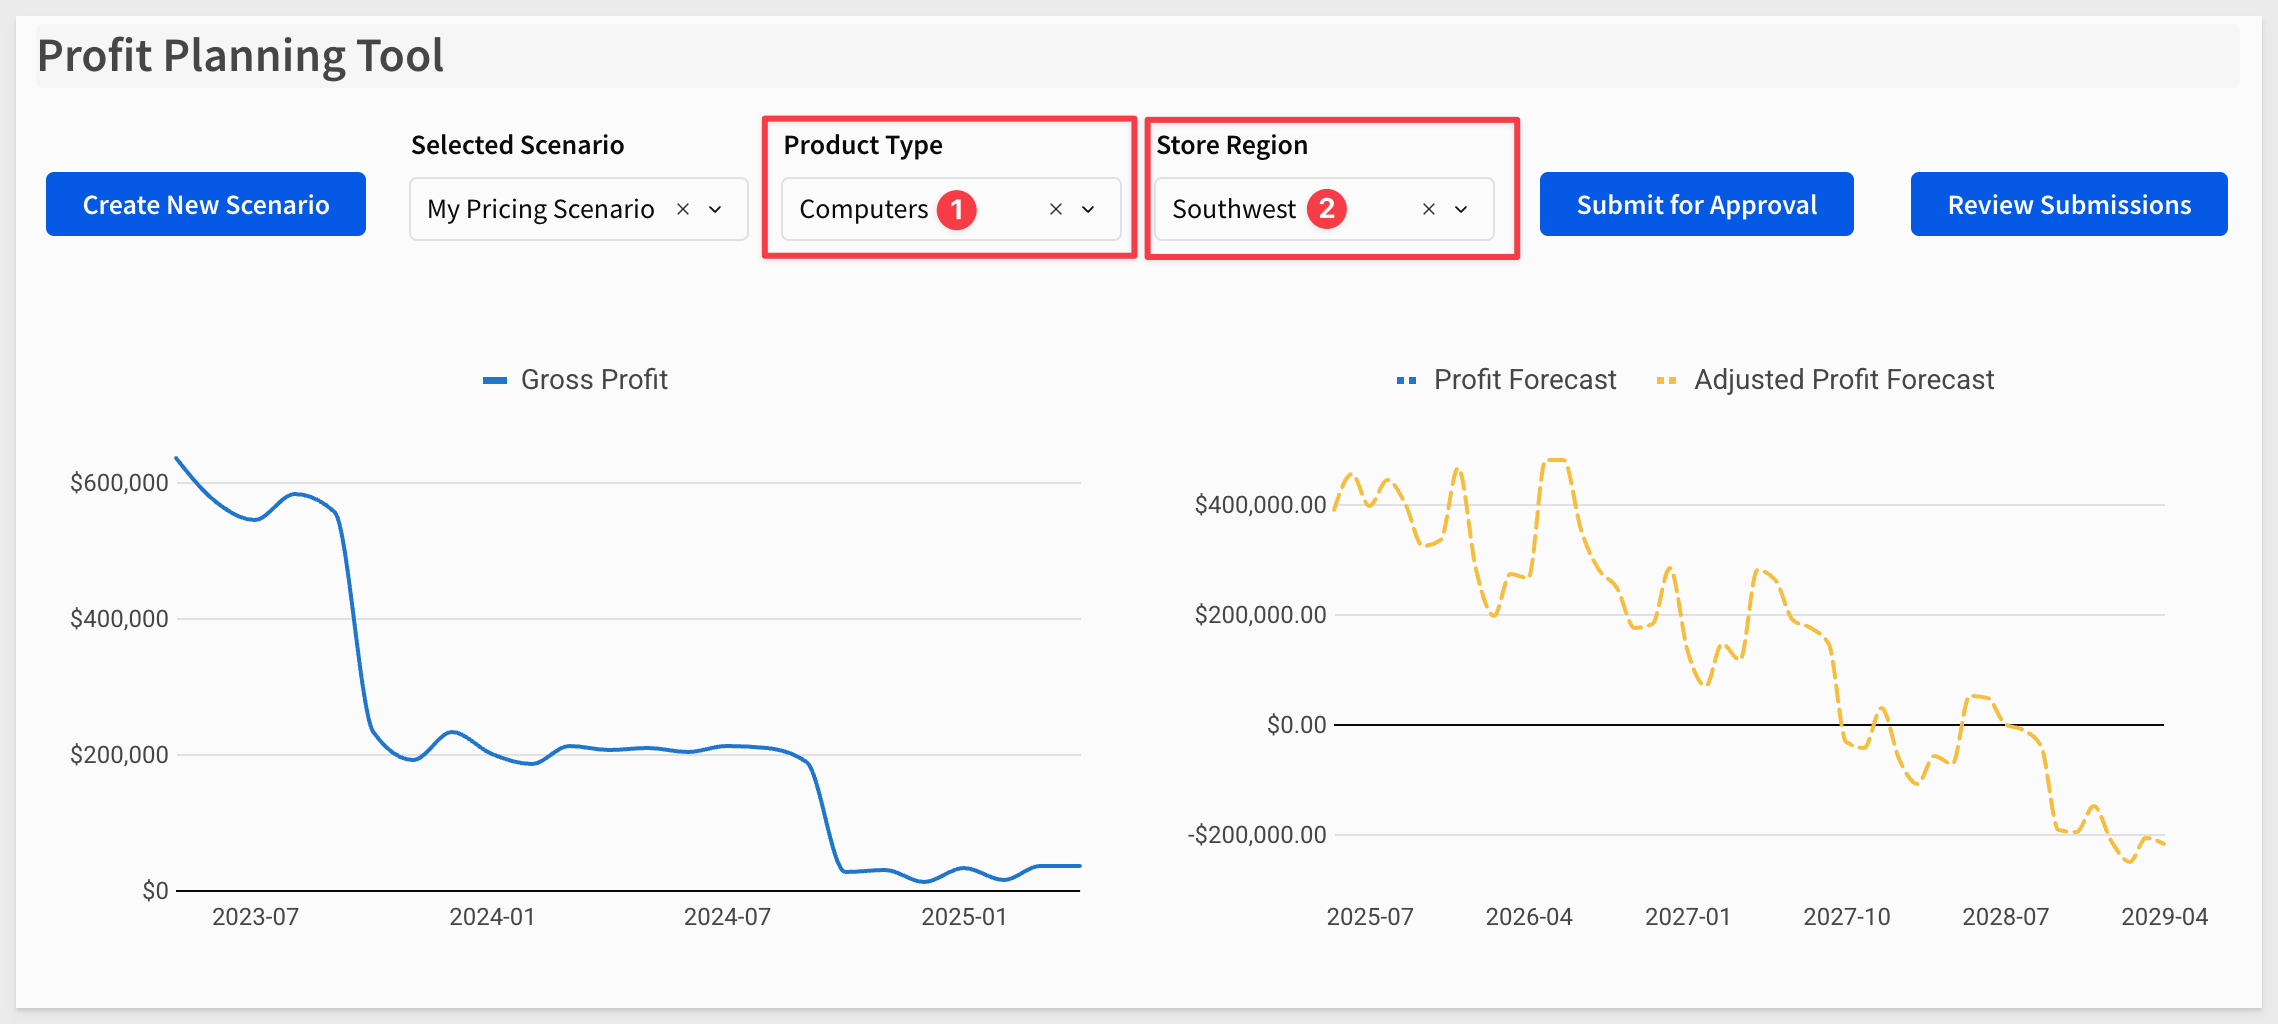
This is our third example of leveraging Snowflake Cortex AI functions directly inside of Sigma to open up new possibilities for real-time analytics.
We are now ready to hop in and apply some of our price adjustments from our scratch pad.
6: Return to your Big Buys - {your name} workbook. Sort the Price Changes input table ascending by the Brand column, and copy all values from the Price Change column:
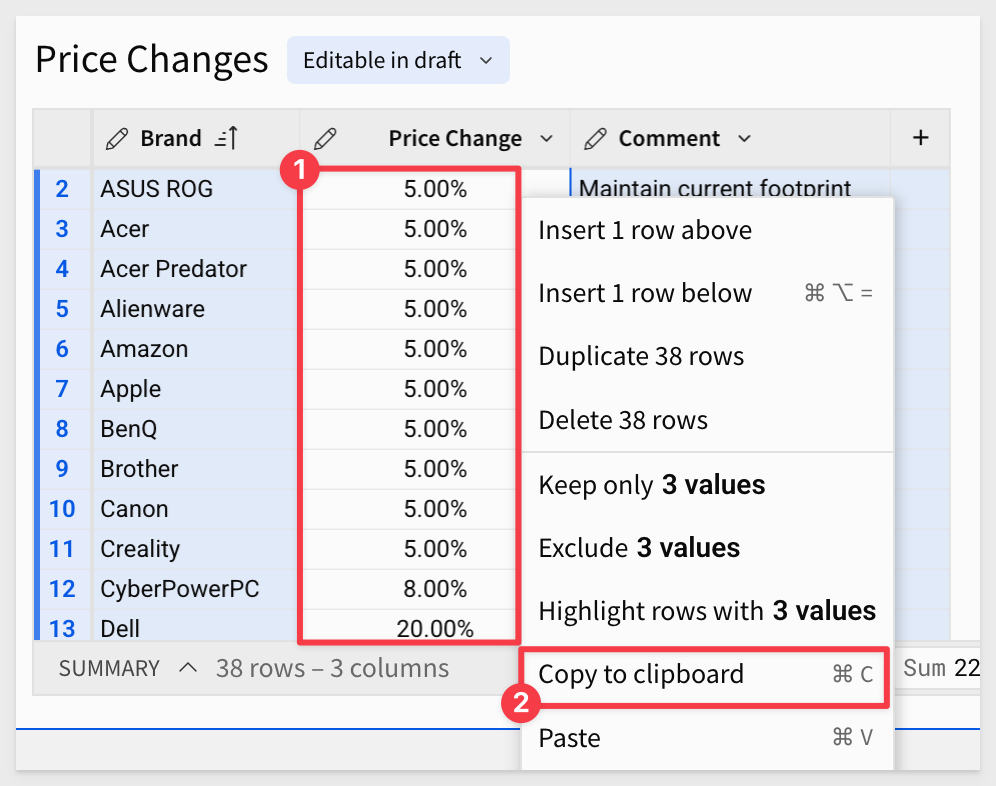
Go back to the Big Buys Profit Planning Tool > Price Adjustments table, click Edit Data, sort the table ascending on the Brand column and paste the values into the Price Change (%) column.
NOTE: Click the first cell in the "Price Change" column, then scroll to the bottom of the table. Hold down the Shift key and click the last cell in the same column.
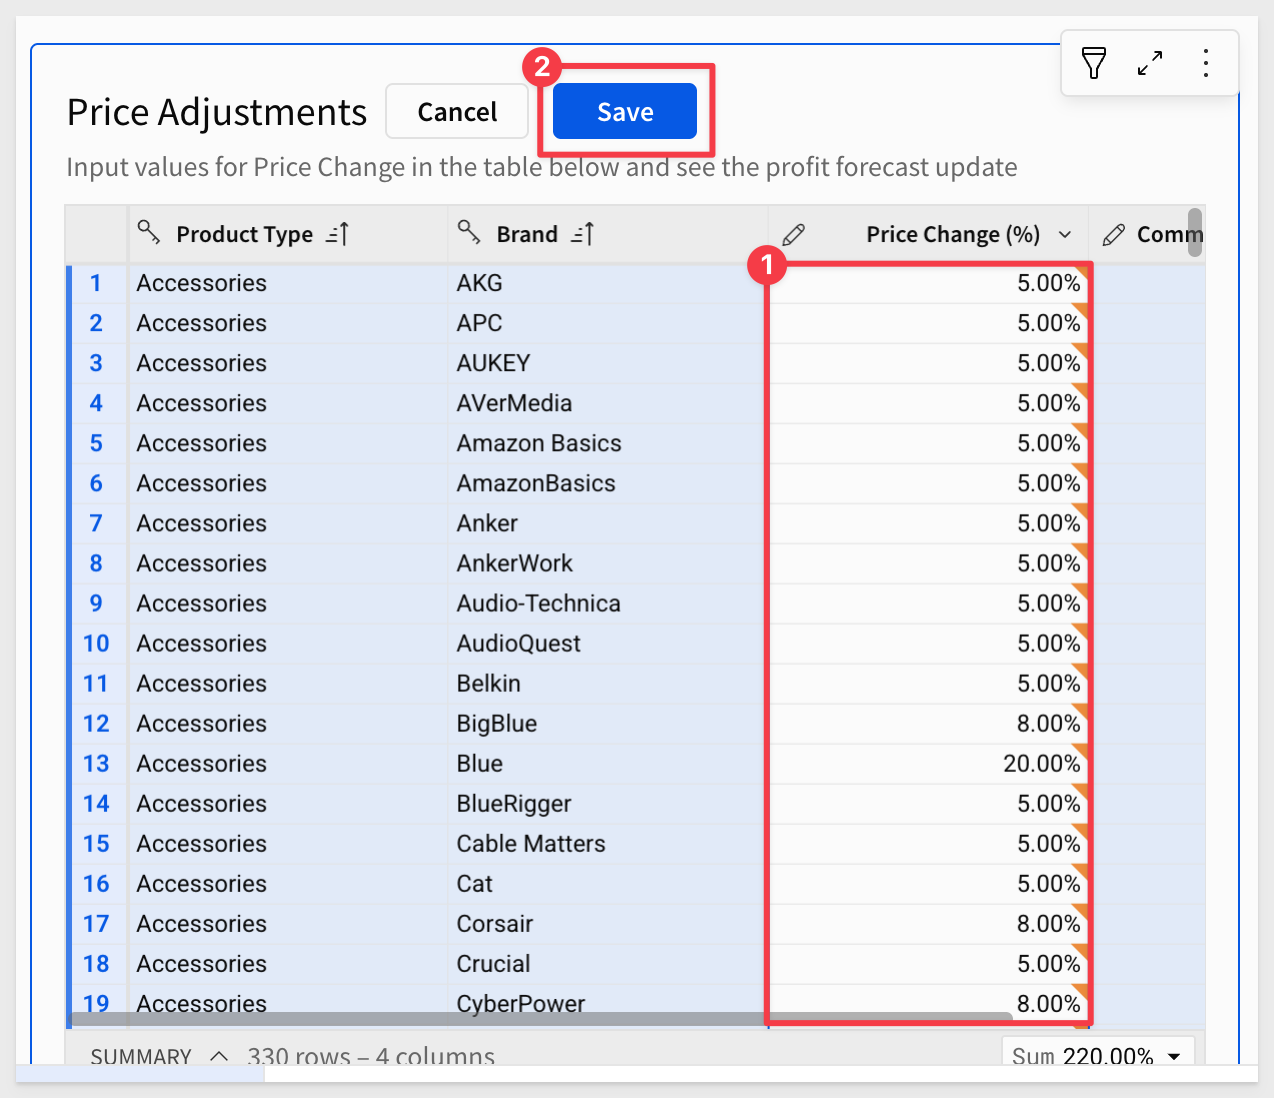
NOTE: To copy, press Ctrl+C on Windows and Command+C on macOS. To paste, press Ctrl+V on Windows and Command+V on macOS.
Click Save on the input table.
7: After entering the data, you should see a loading bar start. The Snowpark forecasting model will process your changes and show real-time results based on Snowflake’s projections.
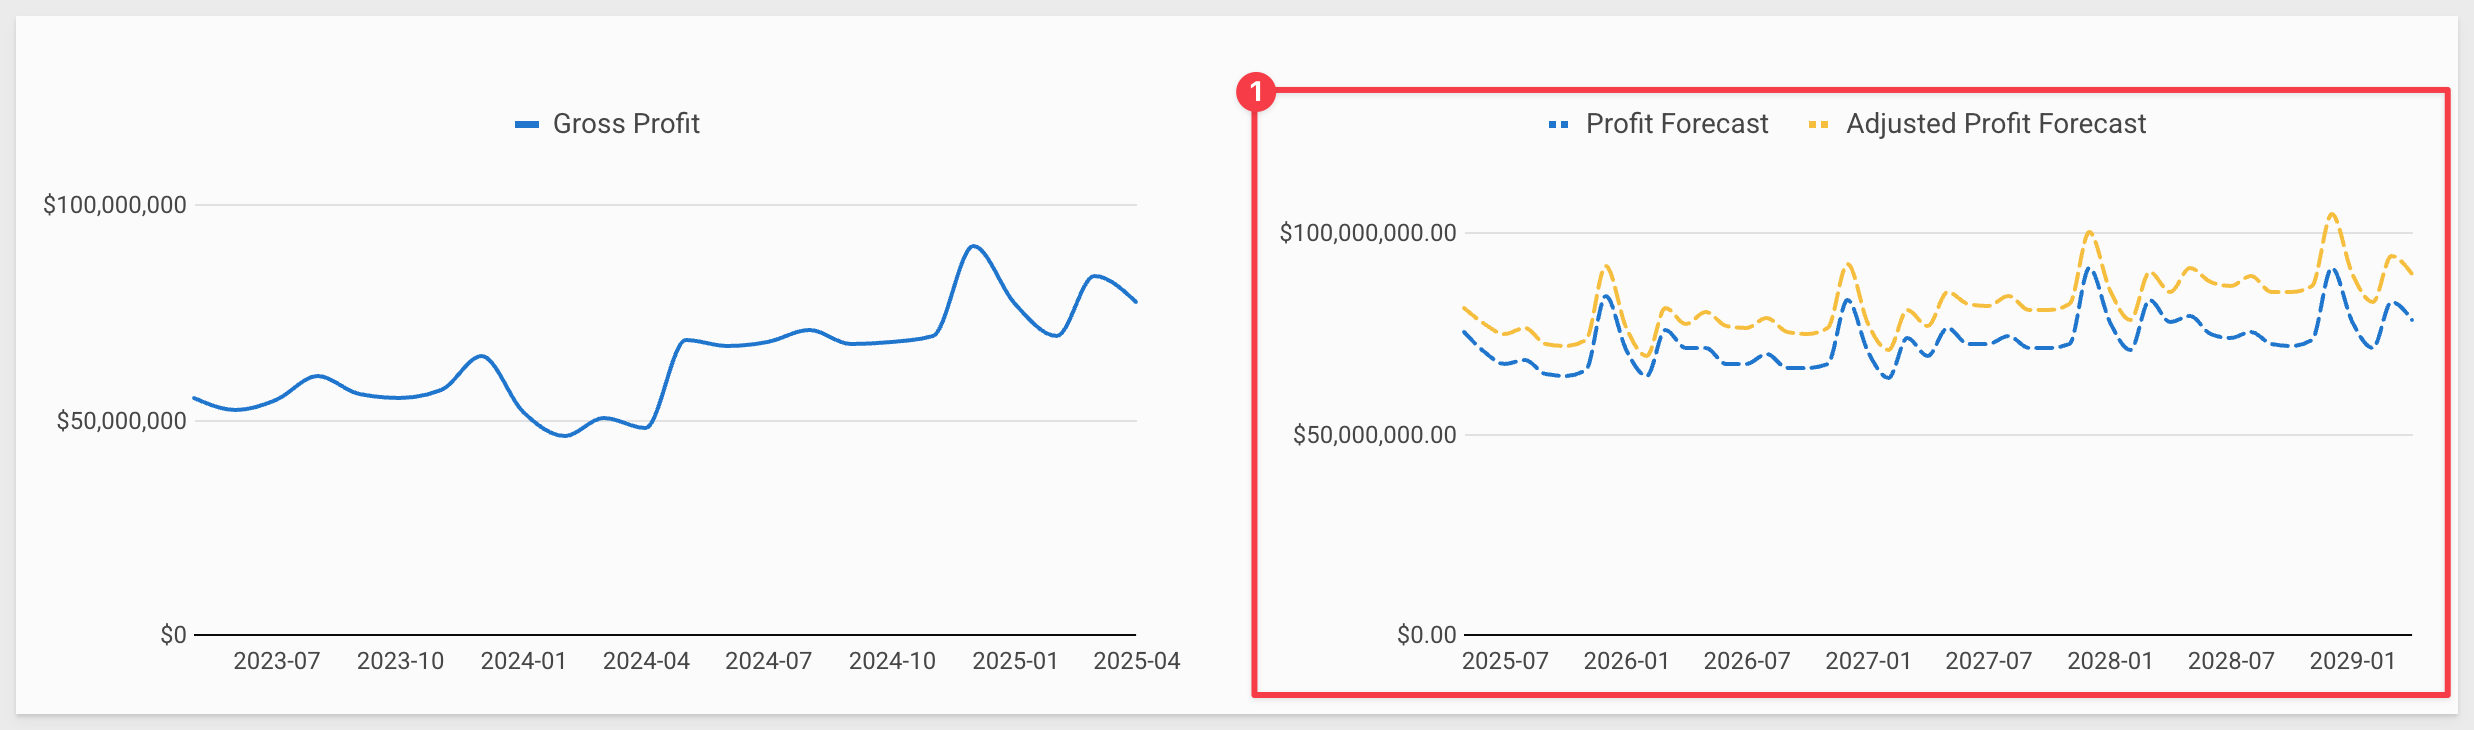
8: With our scenario now loaded in, we are ready to go ahead submit it for approval because Sigma AI Apps allow for multi step workflows.
Once we click approve, this can go into a queue that our manager or compliance officers could go through and review but for the purpose of this lab, we can just approve our own data.
I mean, we obviously know it's right, so first we'll click Submit for Approval in the top right and submit our scenario.
9: Finally, click Review Submission, select your scenario, and click Approve.
Conclusion And Resources
What You Learned
In this QuickStart, you used Sigma and Snowflake to take a business question all the way from initial discovery to a governed, approved decision. You used Sigma Assistant backed by a Cortex Agent to find the right data from a plain-language question, applied Snowflake Cortex AI functions to score thousands of product reviews in seconds, built a Sigma Agent to reason across performance data and generate price recommendations, and modeled the impact using a Snowpark forecasting model before submitting for approval through a Sigma AI App.
Along the way, you joined data from multiple sources, loaded external data directly into Snowflake, and wrote recommendations back through governed Input Tables. None of it required SQL.
The retail scenario is just the vehicle. The pattern of using Sigma and Snowflake to move from question to governed action applies across every industry and every team that runs on data.
Additional Resource Links
Be sure to check out all the latest developments at Sigma's First Friday Feature page!




This content is provided as is, and is not maintained on an ongoing basis. It may be out of date with current Snowflake instances
