Video
Introducing Observe by Snowflake
Jeremy Burton, Snowflake GM of Observability, introduces a new model for observability built natively on the Snowflake lakehouse.
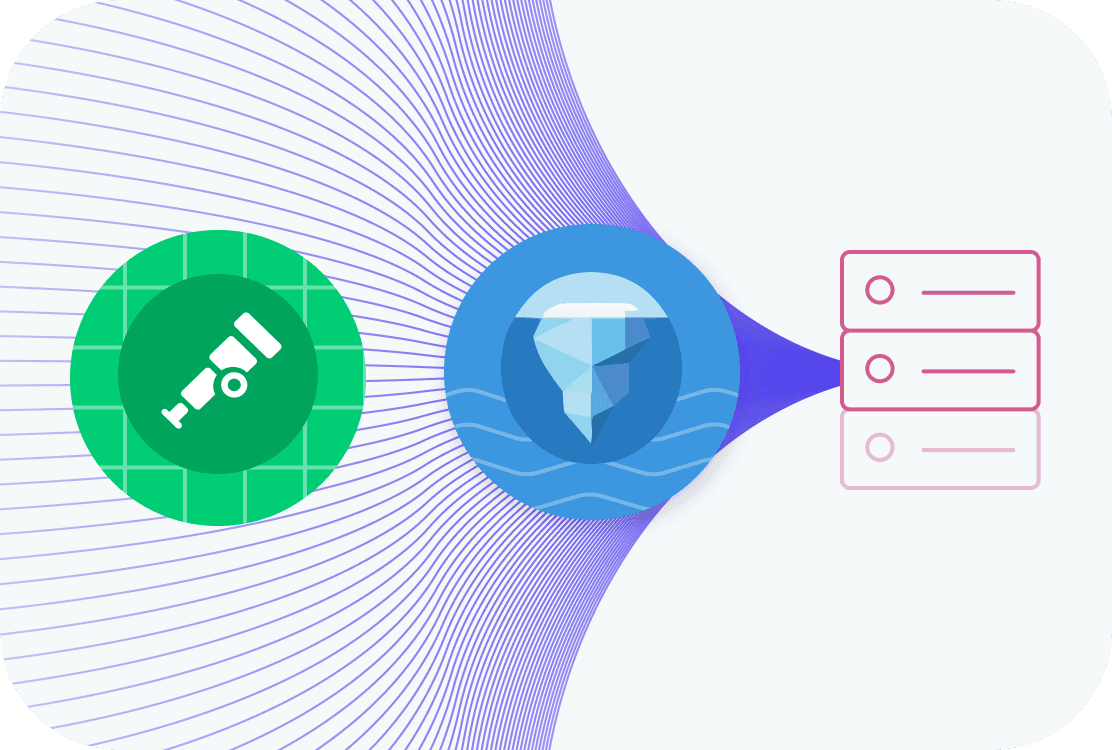
AI-powered observability at scale. Unify logs, metrics and traces on a cost-efficient Snowflake lakehouse, using an integrated AI SRE that helps resolve incidents faster.

BENEFITS
Programmable AI SRE
The Observe AI SRE, CLI and MCP Server support developers, engineers, DevOps and SREs where they are, enabling custom agentic workflows.
Context Engineered for Accuracy
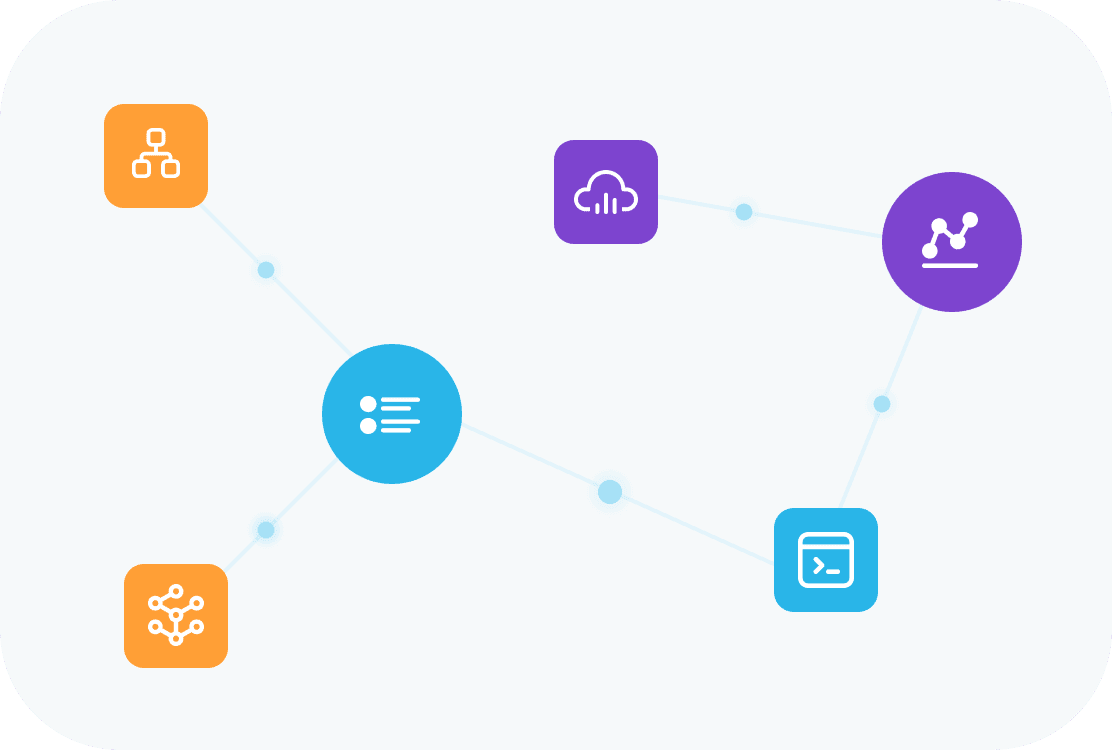
The Observability Context Graph maps semantics and relationships across logs, metrics and traces, extending to code and business context — so you get faster, more accurate reasoning.
Cost-Efficient Scale
Observe’s Telemetry Lakehouse Foundation, built on Snowflake, offers low-cost cloud storage and compute-storage separation to ingest, store and analyze more data at lower cost.
use cases
INVESTIGATE AND ROOT CAUSE FASTER
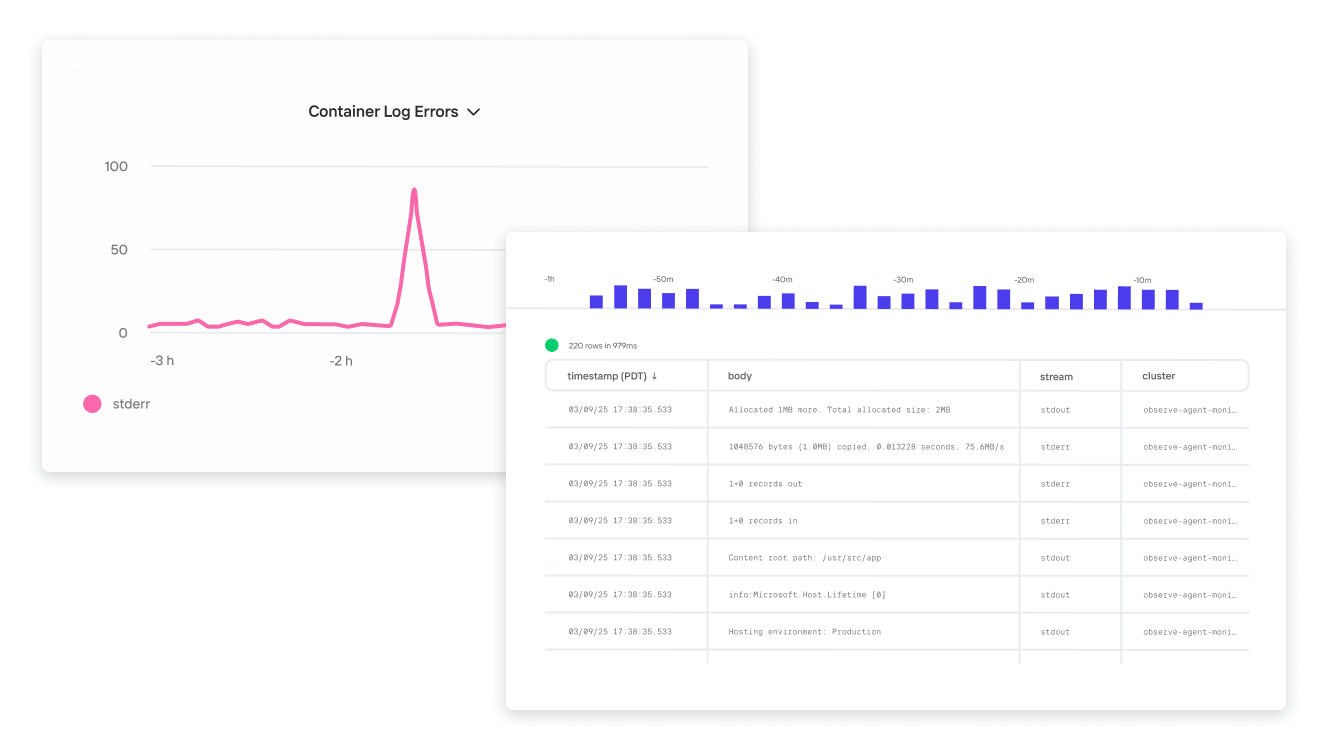
Search logs at scale
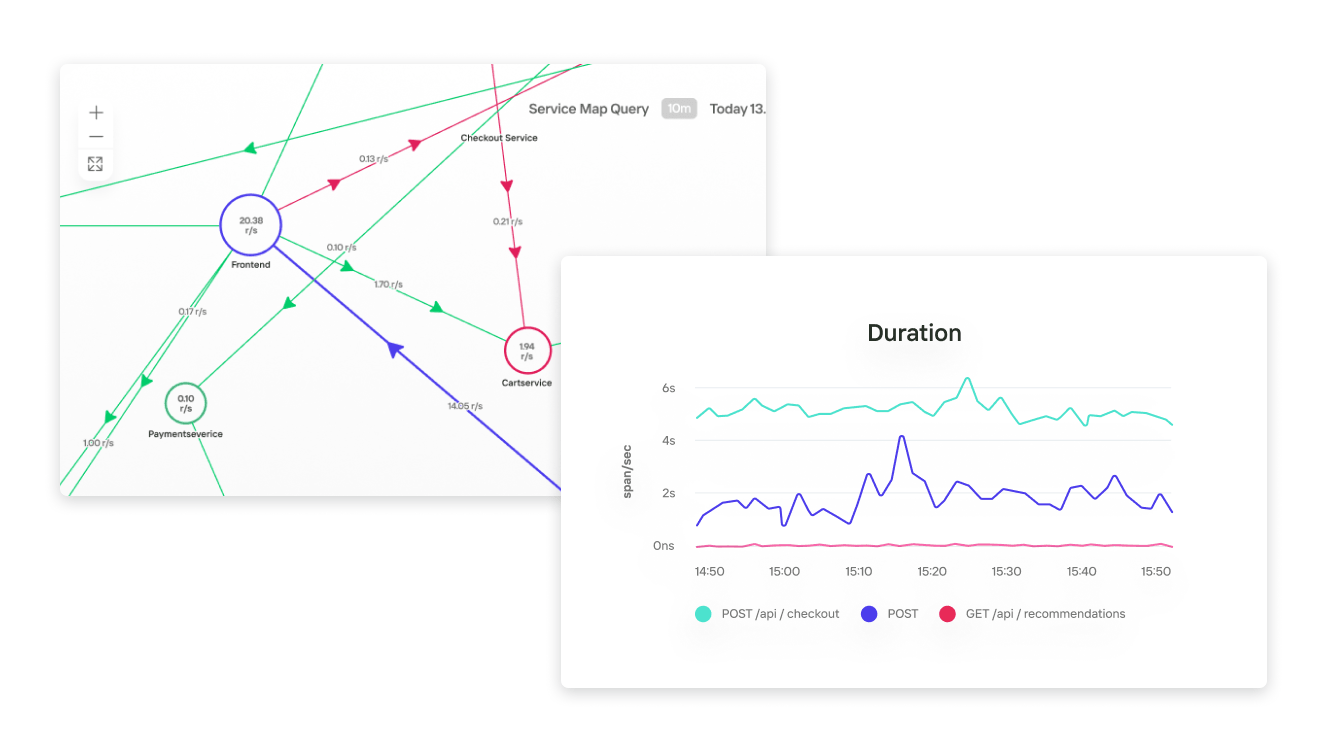
END-TO-END SERVICE VISIBILITY
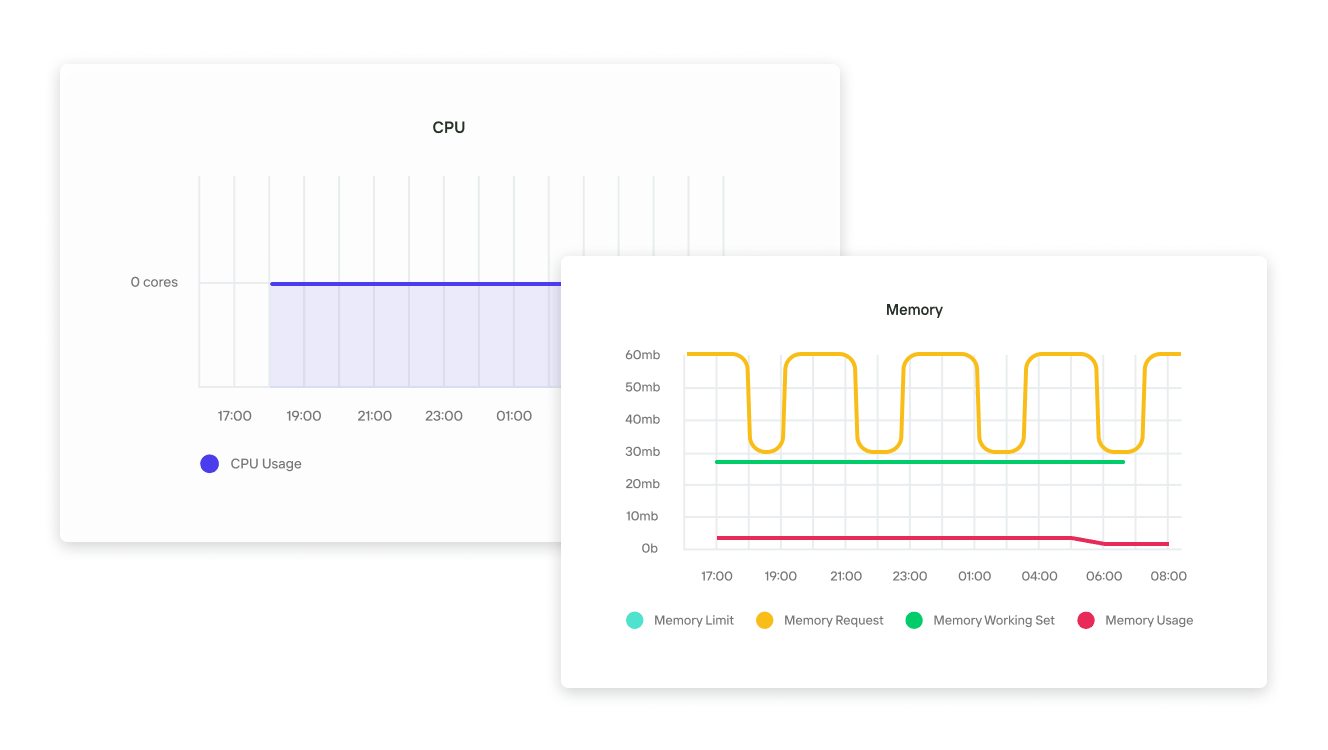
REAL-TIME SYSTEM HEALTH
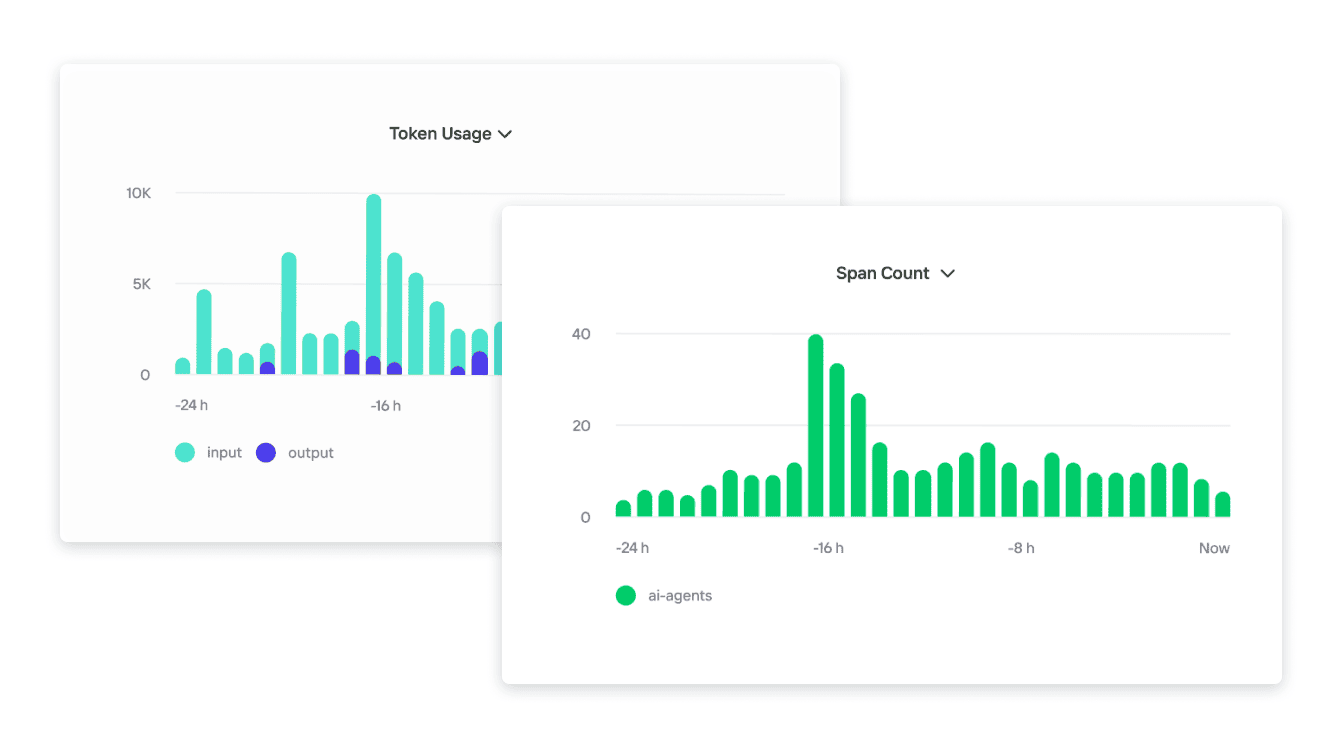
OPTIMIZE AI WORKLOADS
Resources
Video
Jeremy Burton, Snowflake GM of Observability, introduces a new model for observability built natively on the Snowflake lakehouse.
GET STARTED
Performance at scale
Faster troubleshooting
Lower cost with an open data lake
Snowflake for Observability
Your top questions about getting started with Observe by Snowflake, answered here.
Observe is an observability solution built on Snowflake's platform that helps teams troubleshoot faster at lower cost. Observe enables customers to bring all their telemetry (logs, metrics and traces) into a cost-efficient Snowflake lakehouse. Observe is now part of Snowflake.
Observe is purpose-built for infrastructure and application observability (logs, metrics and traces from distributed systems) and is designed for SREs and software engineers. Observe’s tools complement Snowflake’s data observability capabilities like Snowflake Trail.
Observe stores all telemetry in a single telemetry data lake, which lowers cost at scale and enables greater retention times. Its context graph automatically connects related signals across data streams, so that both AI agents and humans can investigate more quickly and accurately using a unified model instead of switching between disconnected tools.
Observe's Telemetry Lakehouse Foundation, built on Snowflake, helps customers to cost-effectively ingest, retain and analyze higher volumes of telemetry data with lower costs. Consolidating logs, metrics and traces at scale can often eliminate the need for multiple observability tools, reducing licensing costs and operational overhead.
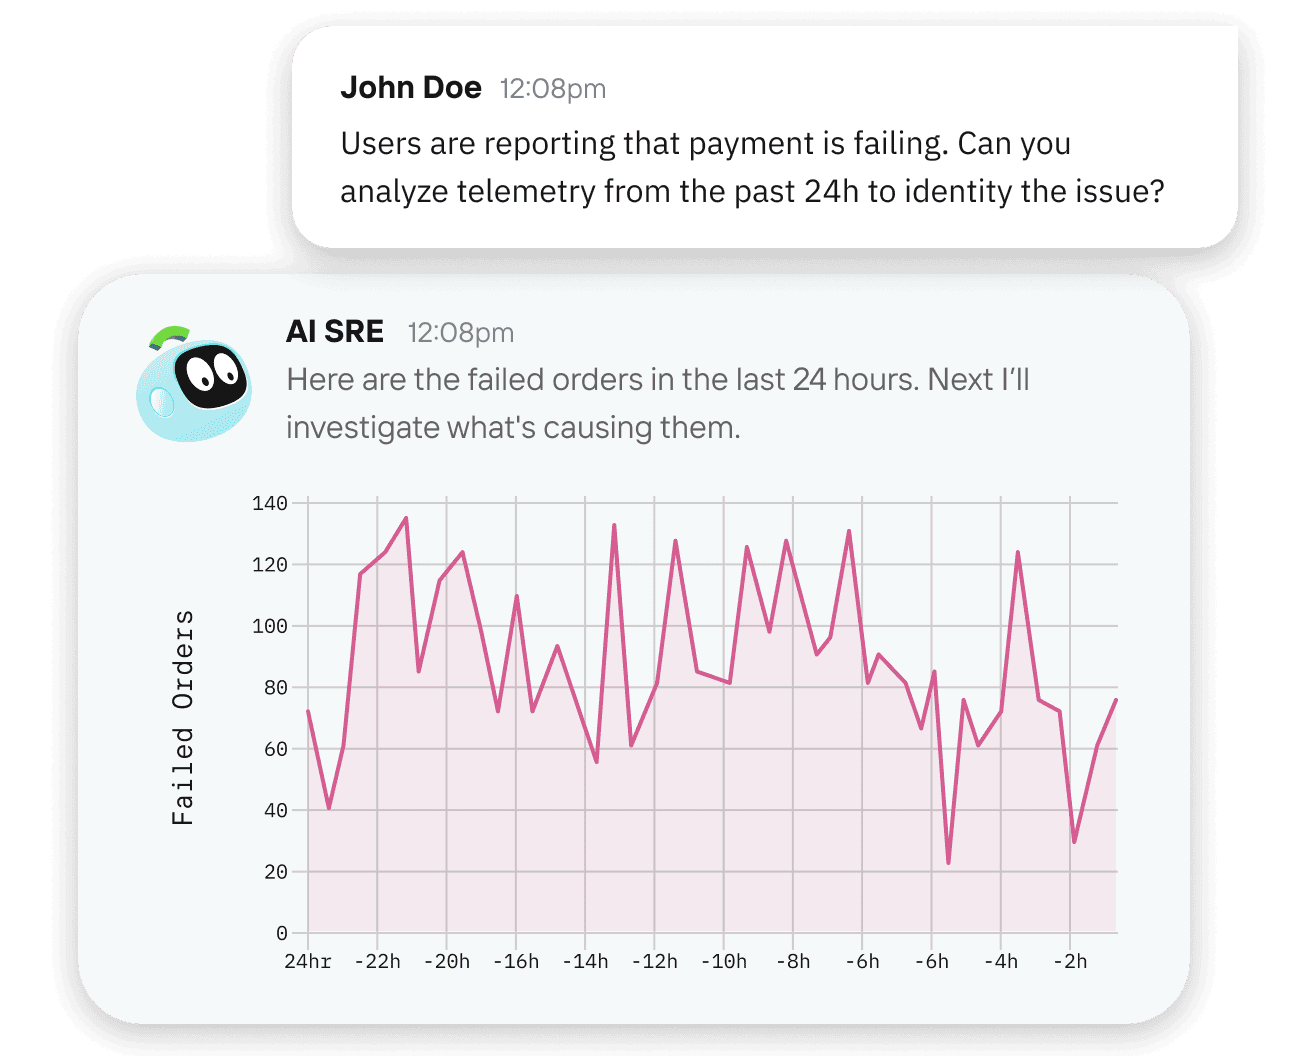
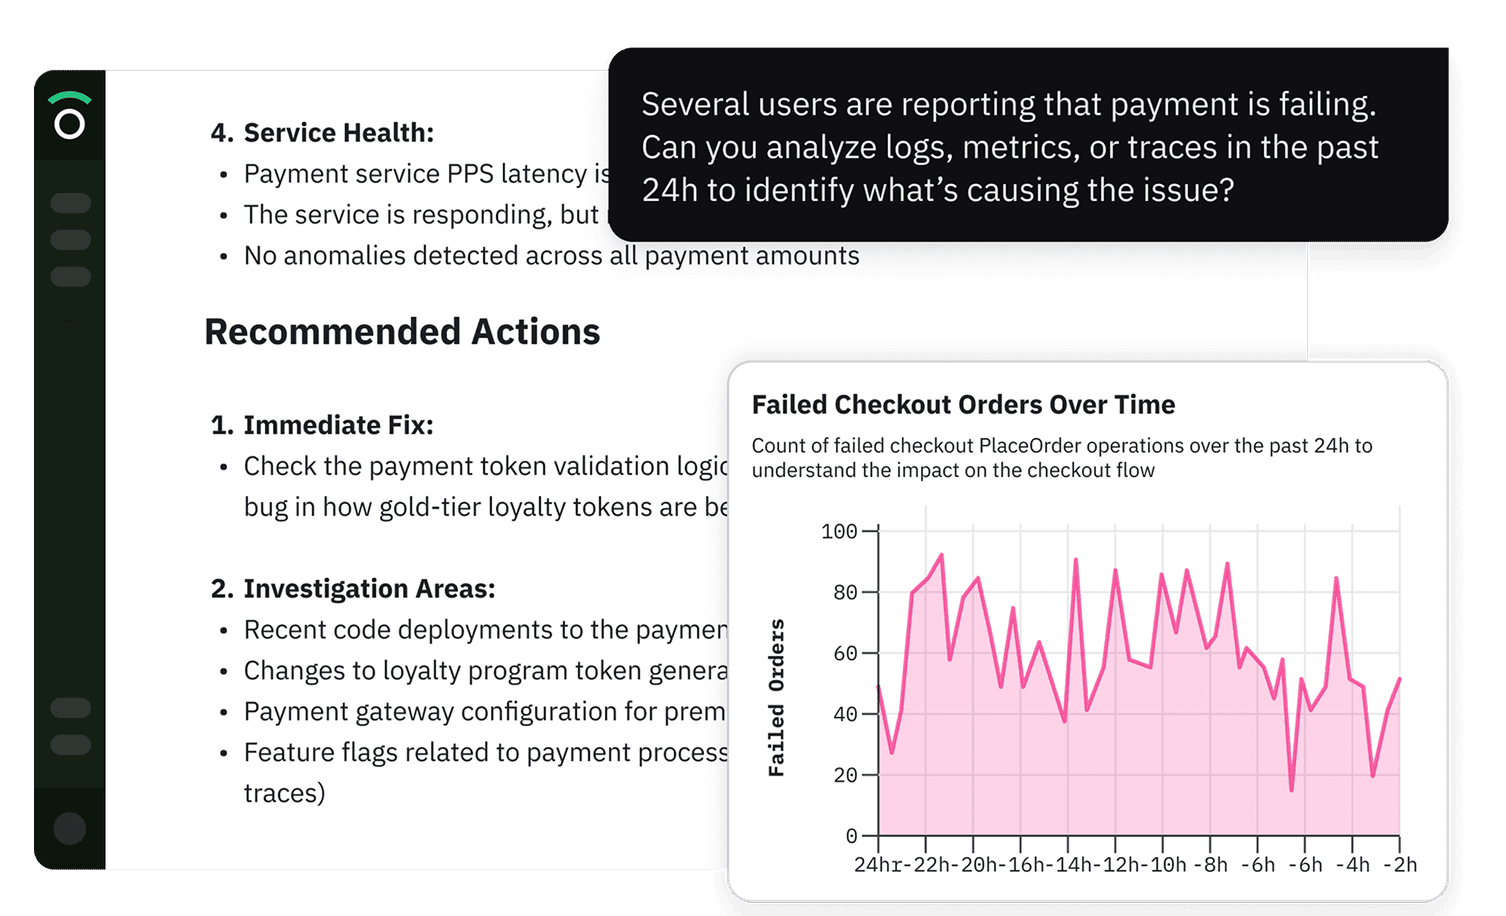
Observe's context graph automatically links related logs, metrics and traces, so that you can trace root causes without manually correlating data in separate tools. Combined with AI SRE, which can surface likely causes and recommend next steps, teams can significantly reduce investigation and incident resolution time.
Observe natively ingests any OpenTelemetry-compatible data and it works with telemetry stored in Iceberg tables. This open approach means you're never locked into a proprietary agent or format.
Observe's AI SRE is an AI agent that uses the Observability Context Graph, a semantic model of relationships across both your telemetry and business data types, to get more accurate answers. Teams can troubleshoot more quickly using natural language to surface root causes and suggest next steps during incidents.