Snowpark is the set of libraries and code execution environments that run Python and other programming languages next to data in Snowflake. Snowpark extends the capabilities of the core Snowflake engine and helps teams deliver data products faster and more cost-effectively.
However, with the ability to execute custom user code through user-defined functions (UDF) and stored procedures, there are new observability challenges.
Snowflake Trail is the new observability solution designed to enhance monitoring and debugging experiences. It provides a comprehensive set of telemetry signals, including metrics, logs and traces, to help developers better understand their applications and pipelines.

In this blog post, we’ll discuss how Snowflake Trail applied the concepts of distributed tracing from OpenTelemetry to the Snowflake and Snowpark execution model, to generate insights and simplify troubleshooting and performance optimization.
What is Distributed Tracing?
In OpenTelemetry, distributed tracing is a way of following requests as they propagate throughout the system. In the context of Snowpark, a trace represents a group of correlated queries and stored procedure jobs that originate from the same parent job.
Snowflake uses the standard OpenTelemetry data model to represent trace events inside an object called a span. Conceptually, a span describes an operation, such as the invocation of a stored procedure or the execution of a UDF over a set of rows.
Once tracing is enabled, each procedure and function execution generates a span record in the Event Table.
- A span includes the start time and end time of an operation to represent its duration.
- A span includes span attributes. Span attributes capture key metrics, like maximum memory usage and rows processed during the operation, providing insights into resource usage and data throughput.
- A span includes span events. Exceptions are automatically captured as span events, with stack traces to help debug errors during execution.

If a stored procedure submits child queries, the tracing context is propagated with each database call. As a result, each span record also includes a “parent_span_id” attribute, connecting them into a trace tree with a parent-child hierarchy.
So how does distributed tracing help with Snowpark workload optimization? Let's take a look at some concrete examples.
Optimize Procedures with Trace Diagram
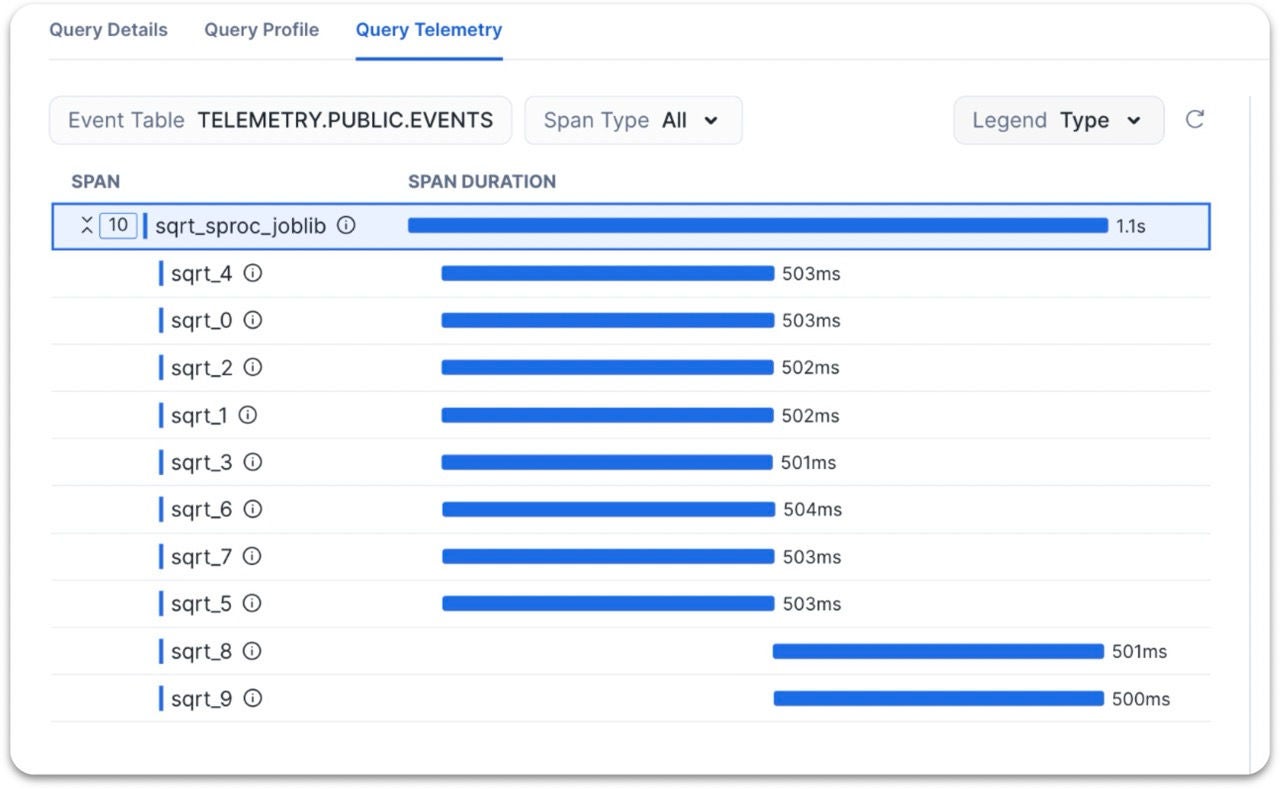
For each execution of a stored procedure, a single span is generated since stored procedures run on a single thread. The trace diagram provides a detailed breakdown view of a long-running procedure, making it easier to identify where time is spent. This often reveals optimization opportunities, such as removing redundant queries, using asynchronous child procedures, parallelizing Python processing and more.
Consider the following example: A stored procedure calls a sqrt function in a loop. The sqrt function represents an expensive Python processing task that takes approximately 500 ms to complete.
CREATE OR REPLACE PROCEDURE sqrt_sproc()
RETURNS STRING
LANGUAGE PYTHON
RUNTIME_VERSION = 3.9
HANDLER = 'run'
PACKAGES = ('snowflake-snowpark-python', 'snowflake-telemetry-python')
AS $$
import time
import math
from opentelemetry import trace

tracer = trace.get_tracer(__name__)

def sqrt(i):
# Create a new root span, set it as the current span in context
with tracer.start_as_current_span(f"sqrt_{i}"):
time.sleep(0.5)
return math.sqrt(i ** 2)

def run(session):
results = []
for i in range(10):
results.append(sqrt(i))
return str(results)
$$;

call sqrt_sproc();

The trace diagram clearly shows that the sqrt tasks are executed sequentially, which is inefficient and does not fully utilize the compute resources in the warehouse. To speed up processing, you can use joblib to run these tasks concurrently using Python worker processes. By setting n_jobs to -1, joblib will attempt to use all available CPU cores.
CREATE OR REPLACE PROCEDURE sqrt_sproc_joblib()
RETURNS STRING
LANGUAGE PYTHON
RUNTIME_VERSION = 3.9
HANDLER = 'run'
PACKAGES = ('snowflake-snowpark-python', 'snowflake-telemetry-python', 'joblib==1.2.0')
AS $$
import time
import math
from opentelemetry import trace
from opentelemetry import context

tracer = trace.get_tracer(__name__)

def sqrt(i, ctx: context.Context):
# Create a new root span, set it as the current span in context
with tracer.start_as_current_span(f"sqrt_{i}", context=ctx):
time.sleep(0.5)
return math.sqrt(i ** 2)

def run(session):
import joblib
result = joblib.Parallel(n_jobs=-1)(joblib.delayed(sqrt)(i, context.get_current()) for i in range(10))
return str(result)
$$;

call sqrt_sproc_joblib();
After executing the optimized stored procedure, the trace diagram confirms that the sqrt function is now executed concurrently. As the parallelized tasks finish processing, two more tasks (span 8 and span 9) are created and executed. This approach fully utilizes the compute resources in the warehouse, and the total execution time is reduced from 5 seconds to 1 second.


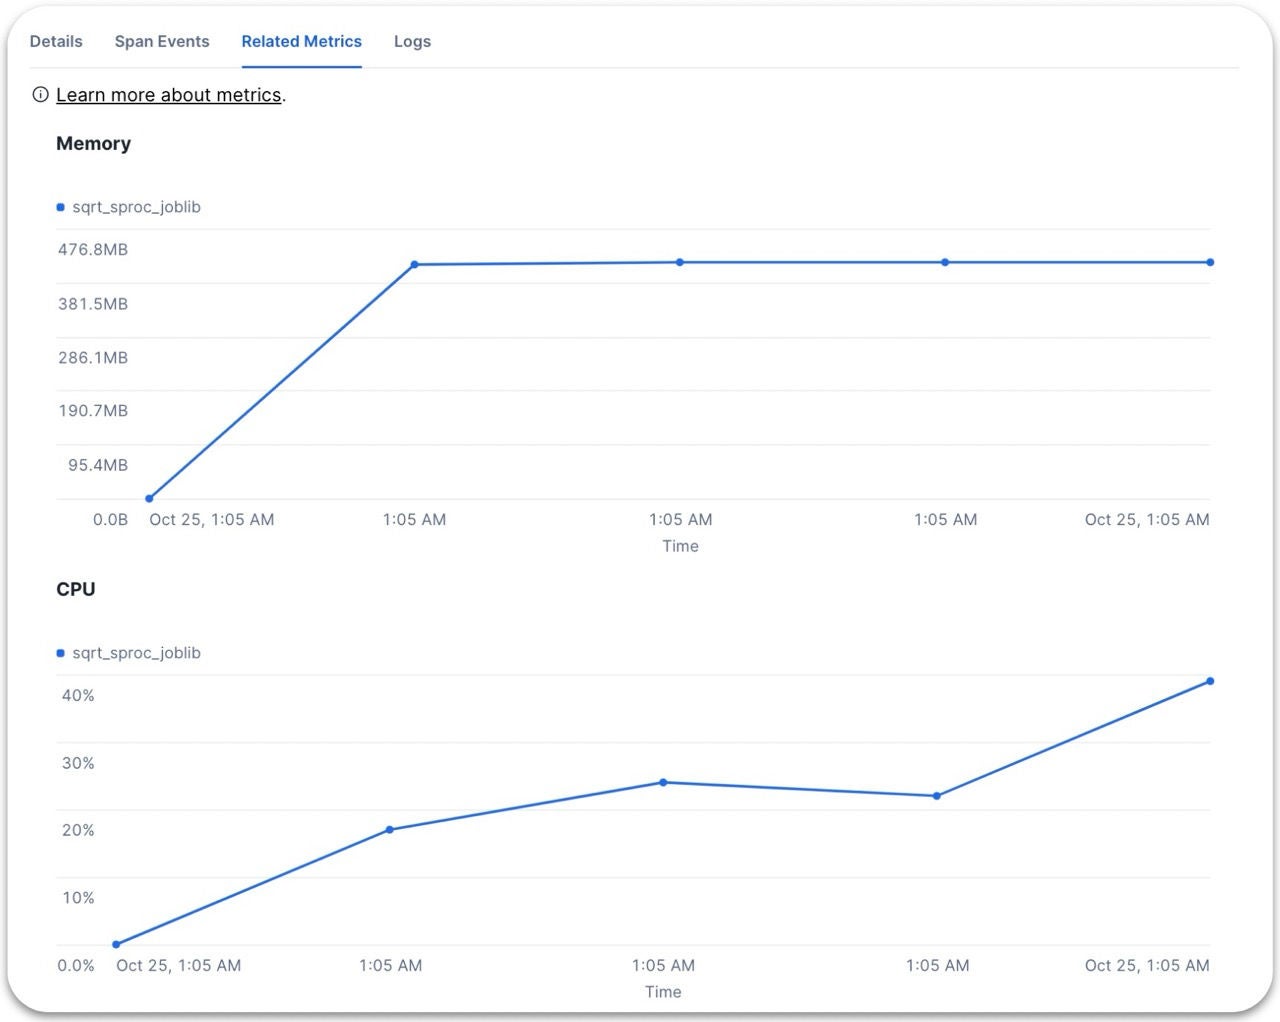
Looking at the CPU metrics reported for the procedure, the joblib-parallelized procedure also has much better CPU utilization.
Optimize UDFs with Trace Diagram
Complex data-processing logic that is hard to express in SQL can be encapsulated into a user-defined function (UDF), user-defined table function (UDTF) or user-defined aggregate function (UDAF). UDF spans provide insights into the UDF execution model. When a UDF is called in a SQL query, SQL engine sends batches of data to UDF workers, and these data are processed in parallel.
The trace diagram provides a detailed view of how function execution is parallelized. Along with attributes related to resource usage (maximum memory usage) and data throughput (number of input and output rows), this often reveals optimization opportunities related to data skew and outliers.
In the following example, we have a UDF that takes in a string and parses it into a JSON object to count the “ingredients” attributes.
import json
import timeit

def compute(x: str) -> int:
obj_dict = json.loads(x)
count = 0
for element in obj_dict["menu_item_health_metrics"]:
count += len(element["ingredients"])
return count

def parse_json(x: str) -> int:
timeit.Timer(compute(x))
if t.timeit() > 3.5:
logging.error(f'Perf degradation occurred for record_id:({x})')
In this example, Instance 5 is taking significantly longer than others to process, but the throughput from snow.input.rows and snow.output.rows remains the same across instances. This means there is no data skew problem, but some records might have complex structures and take longer to process and thus slowing down the query. Using this information, more logs can be instrumented to further debug the problematic records.
Conclusion
In this blog post, we explored how distributed tracing is implemented in the context of Snowpark and how to use auto-instrumented telemetry within the Snowsight interface to monitor and optimize data workloads within Snowflake. These features are just the beginning of improving observability. Our goal is to enable users to effortlessly gain insights into the various data-processing tasks running on Snowpark.
How to get started
To learn more about Snowflake Trail, watch this demo and go through the quick tutorial to start setting up the event table and try out the features today.


