
Blog
Comparing the ELK Stack vs. Observe for Observability at Scale
Learn why ELK's index-based architecture hits a wall at scale — and how Observe delivers better retention, lower cost and faster root cause analysis.
Use Case
Keep every log hot at scale. Search and analyze log data across your applications, infrastructure, security and business systems without worrying about indexing, data tiers or retention limits.

Overview
Log data grows fast and gets expensive even faster, forcing teams to sample, tier or delete the data they need most. Search, analyze and troubleshoot every log with Observe by Snowflake.

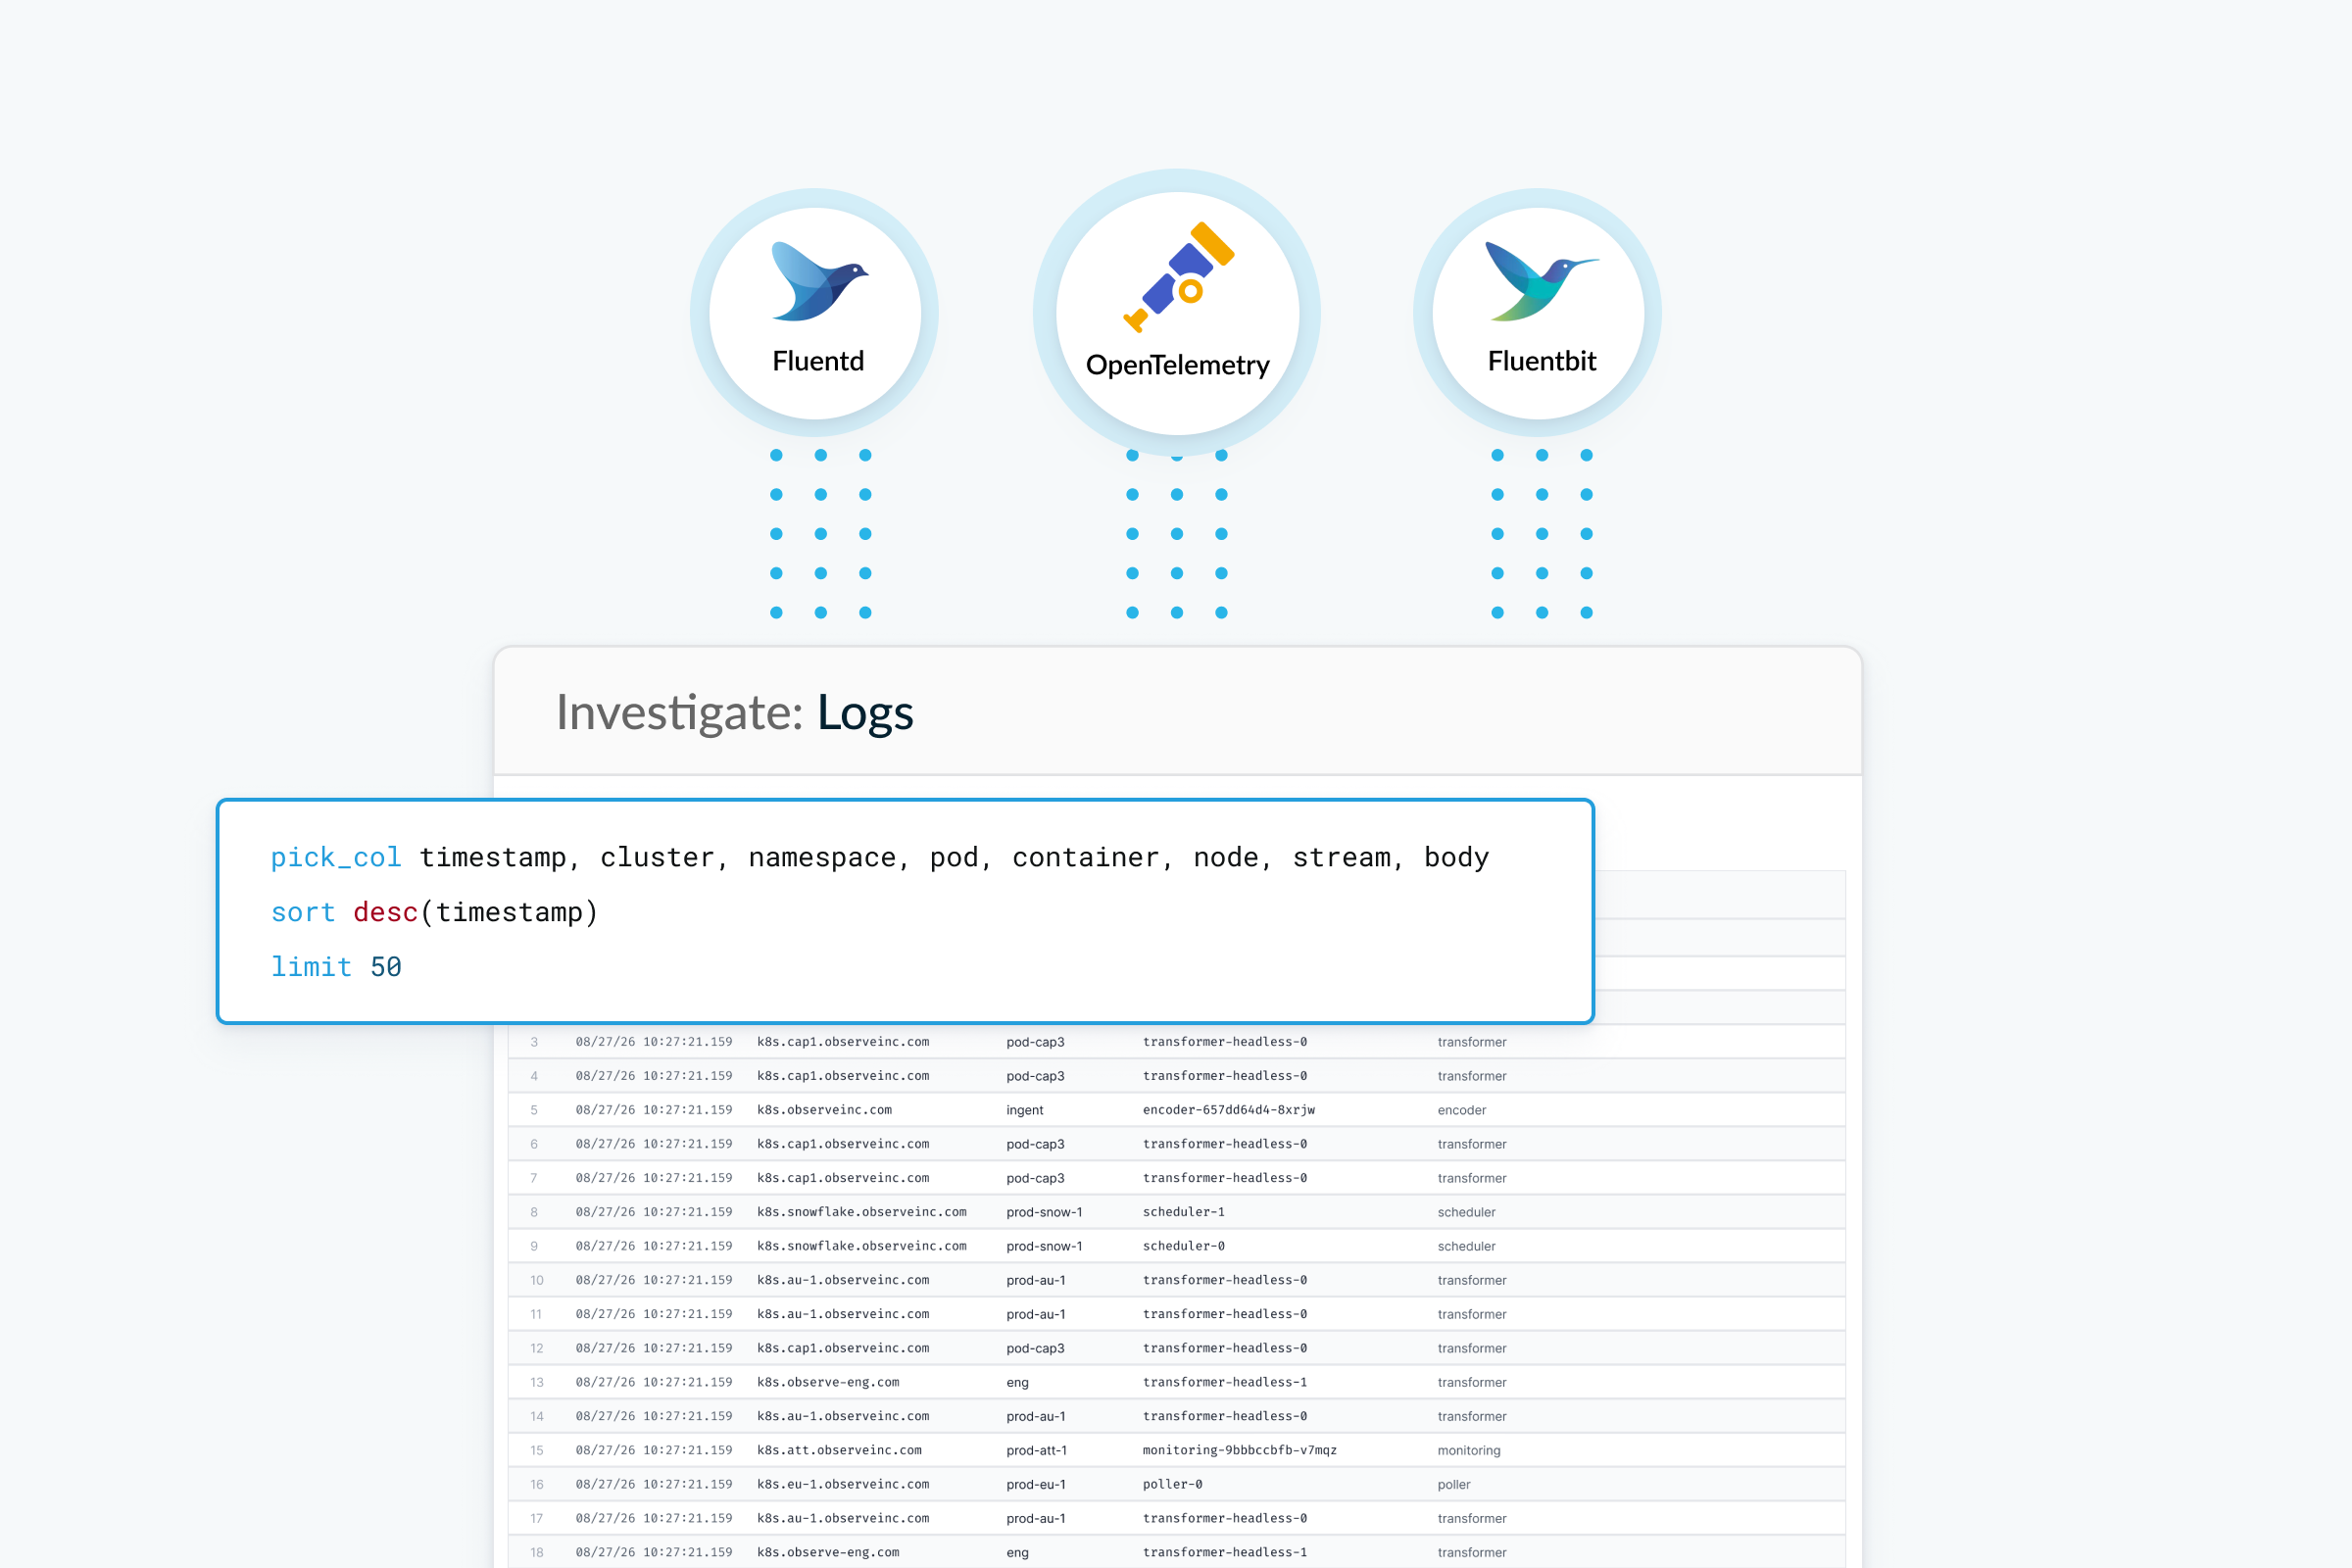
Ingest structured, semi-structured and unstructured logs from cloud, Kubernetes and serverless sources. Scale on demand and absorb bursts without building pipelines.

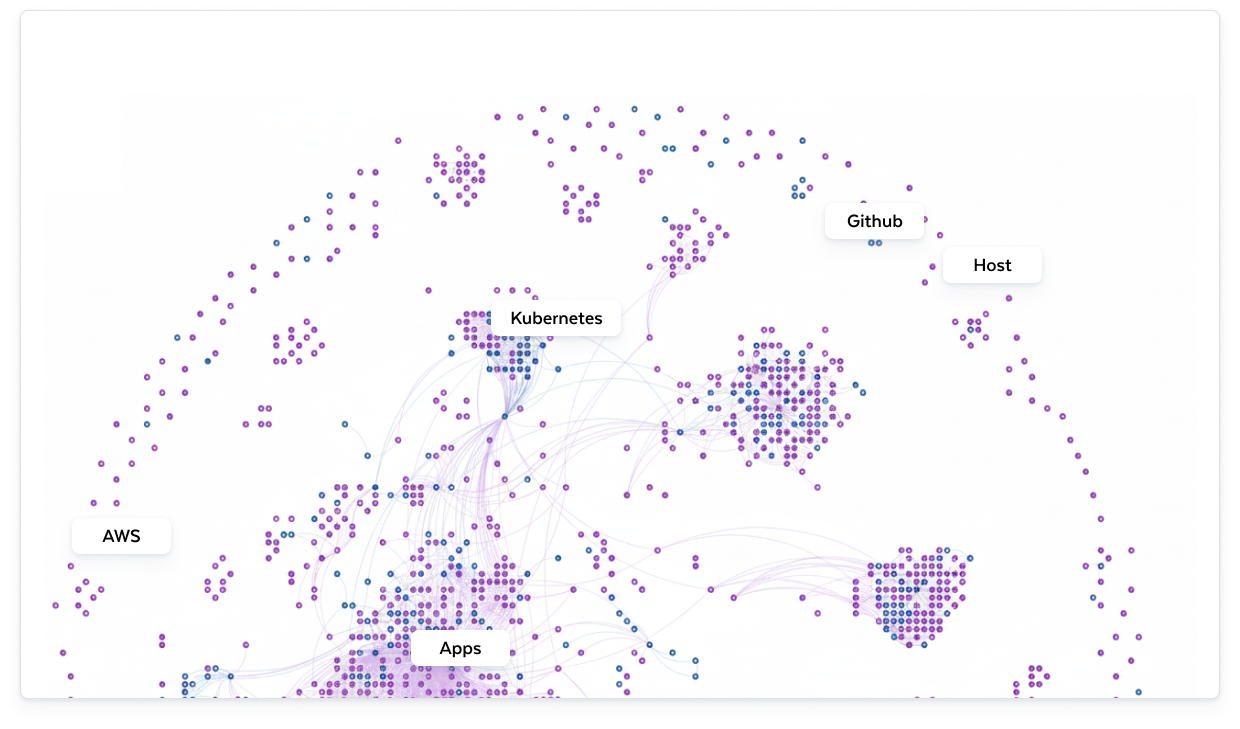
Get to the root cause with full context. Search, filter and analyze logs the moment they arrive, then pivot from dashboards and traces to the exact logs behind an issue.

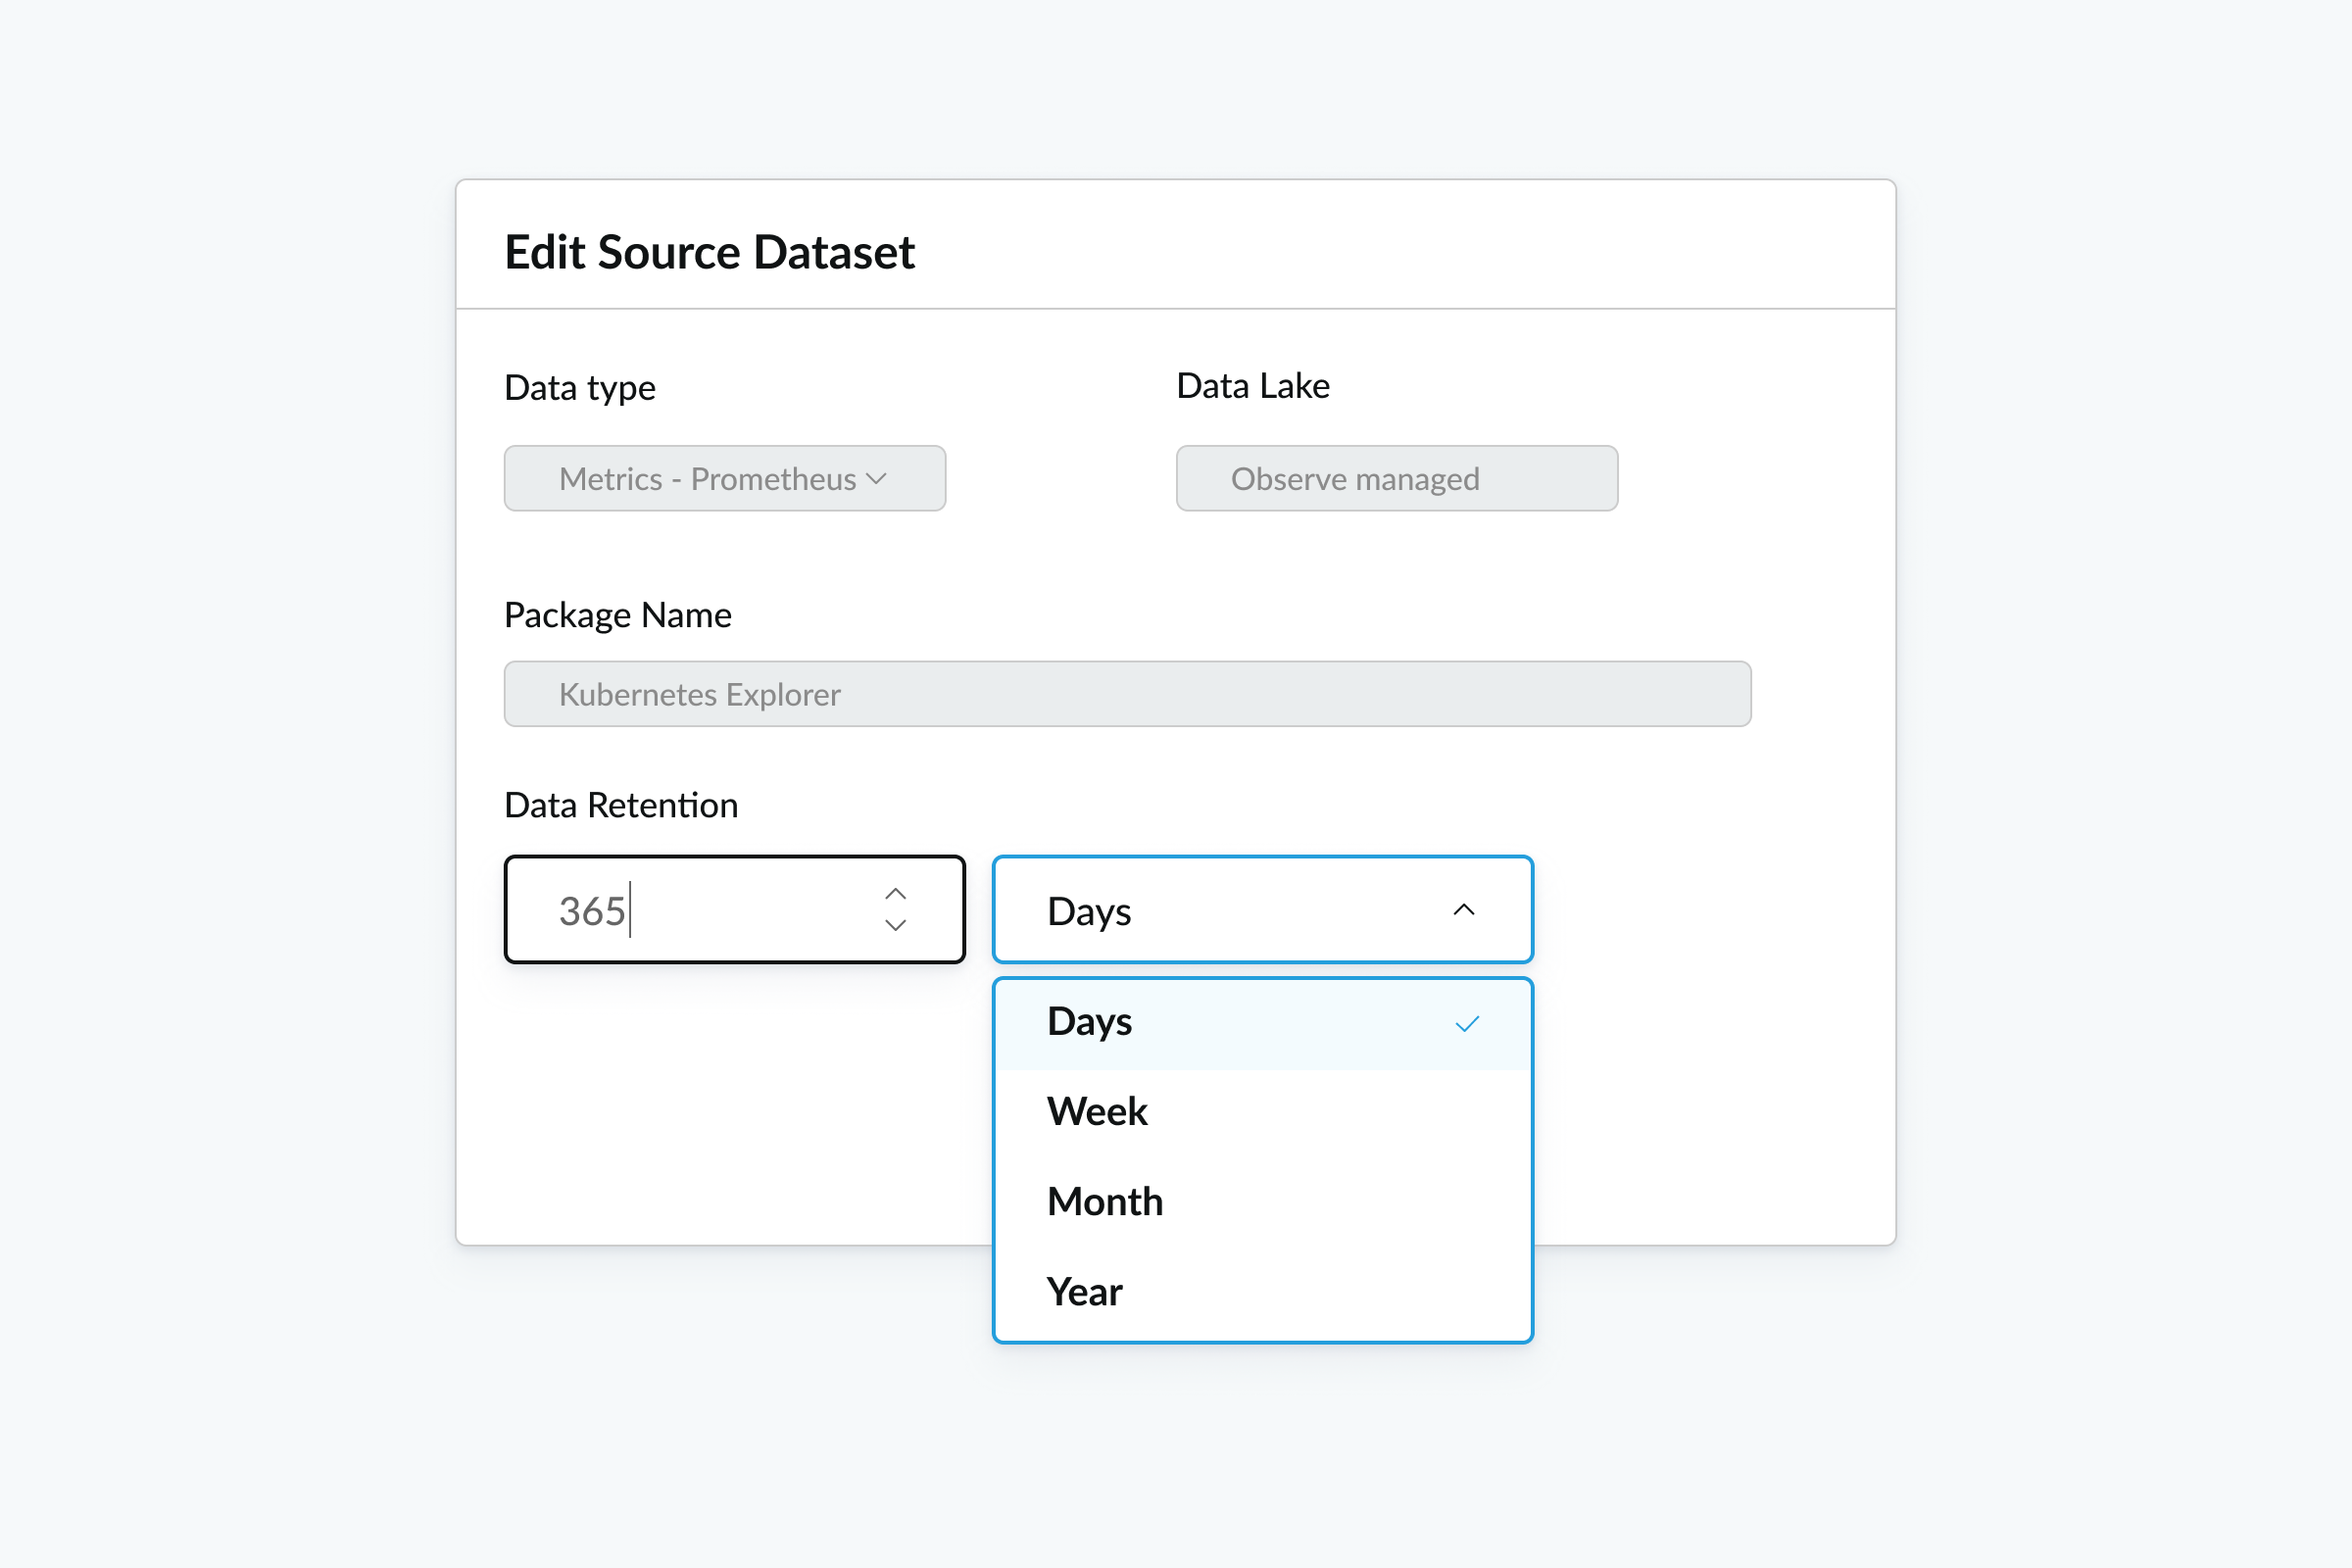
Retain logs for up to 13 months and keep them all instantly searchable. No tiers to manage, data to move or tradeoffs between compliance and budget.
OUR CUSTOMERS


Benefits
Quick setup
Faster troubleshooting
Retention and compliance
Log-derived metrics
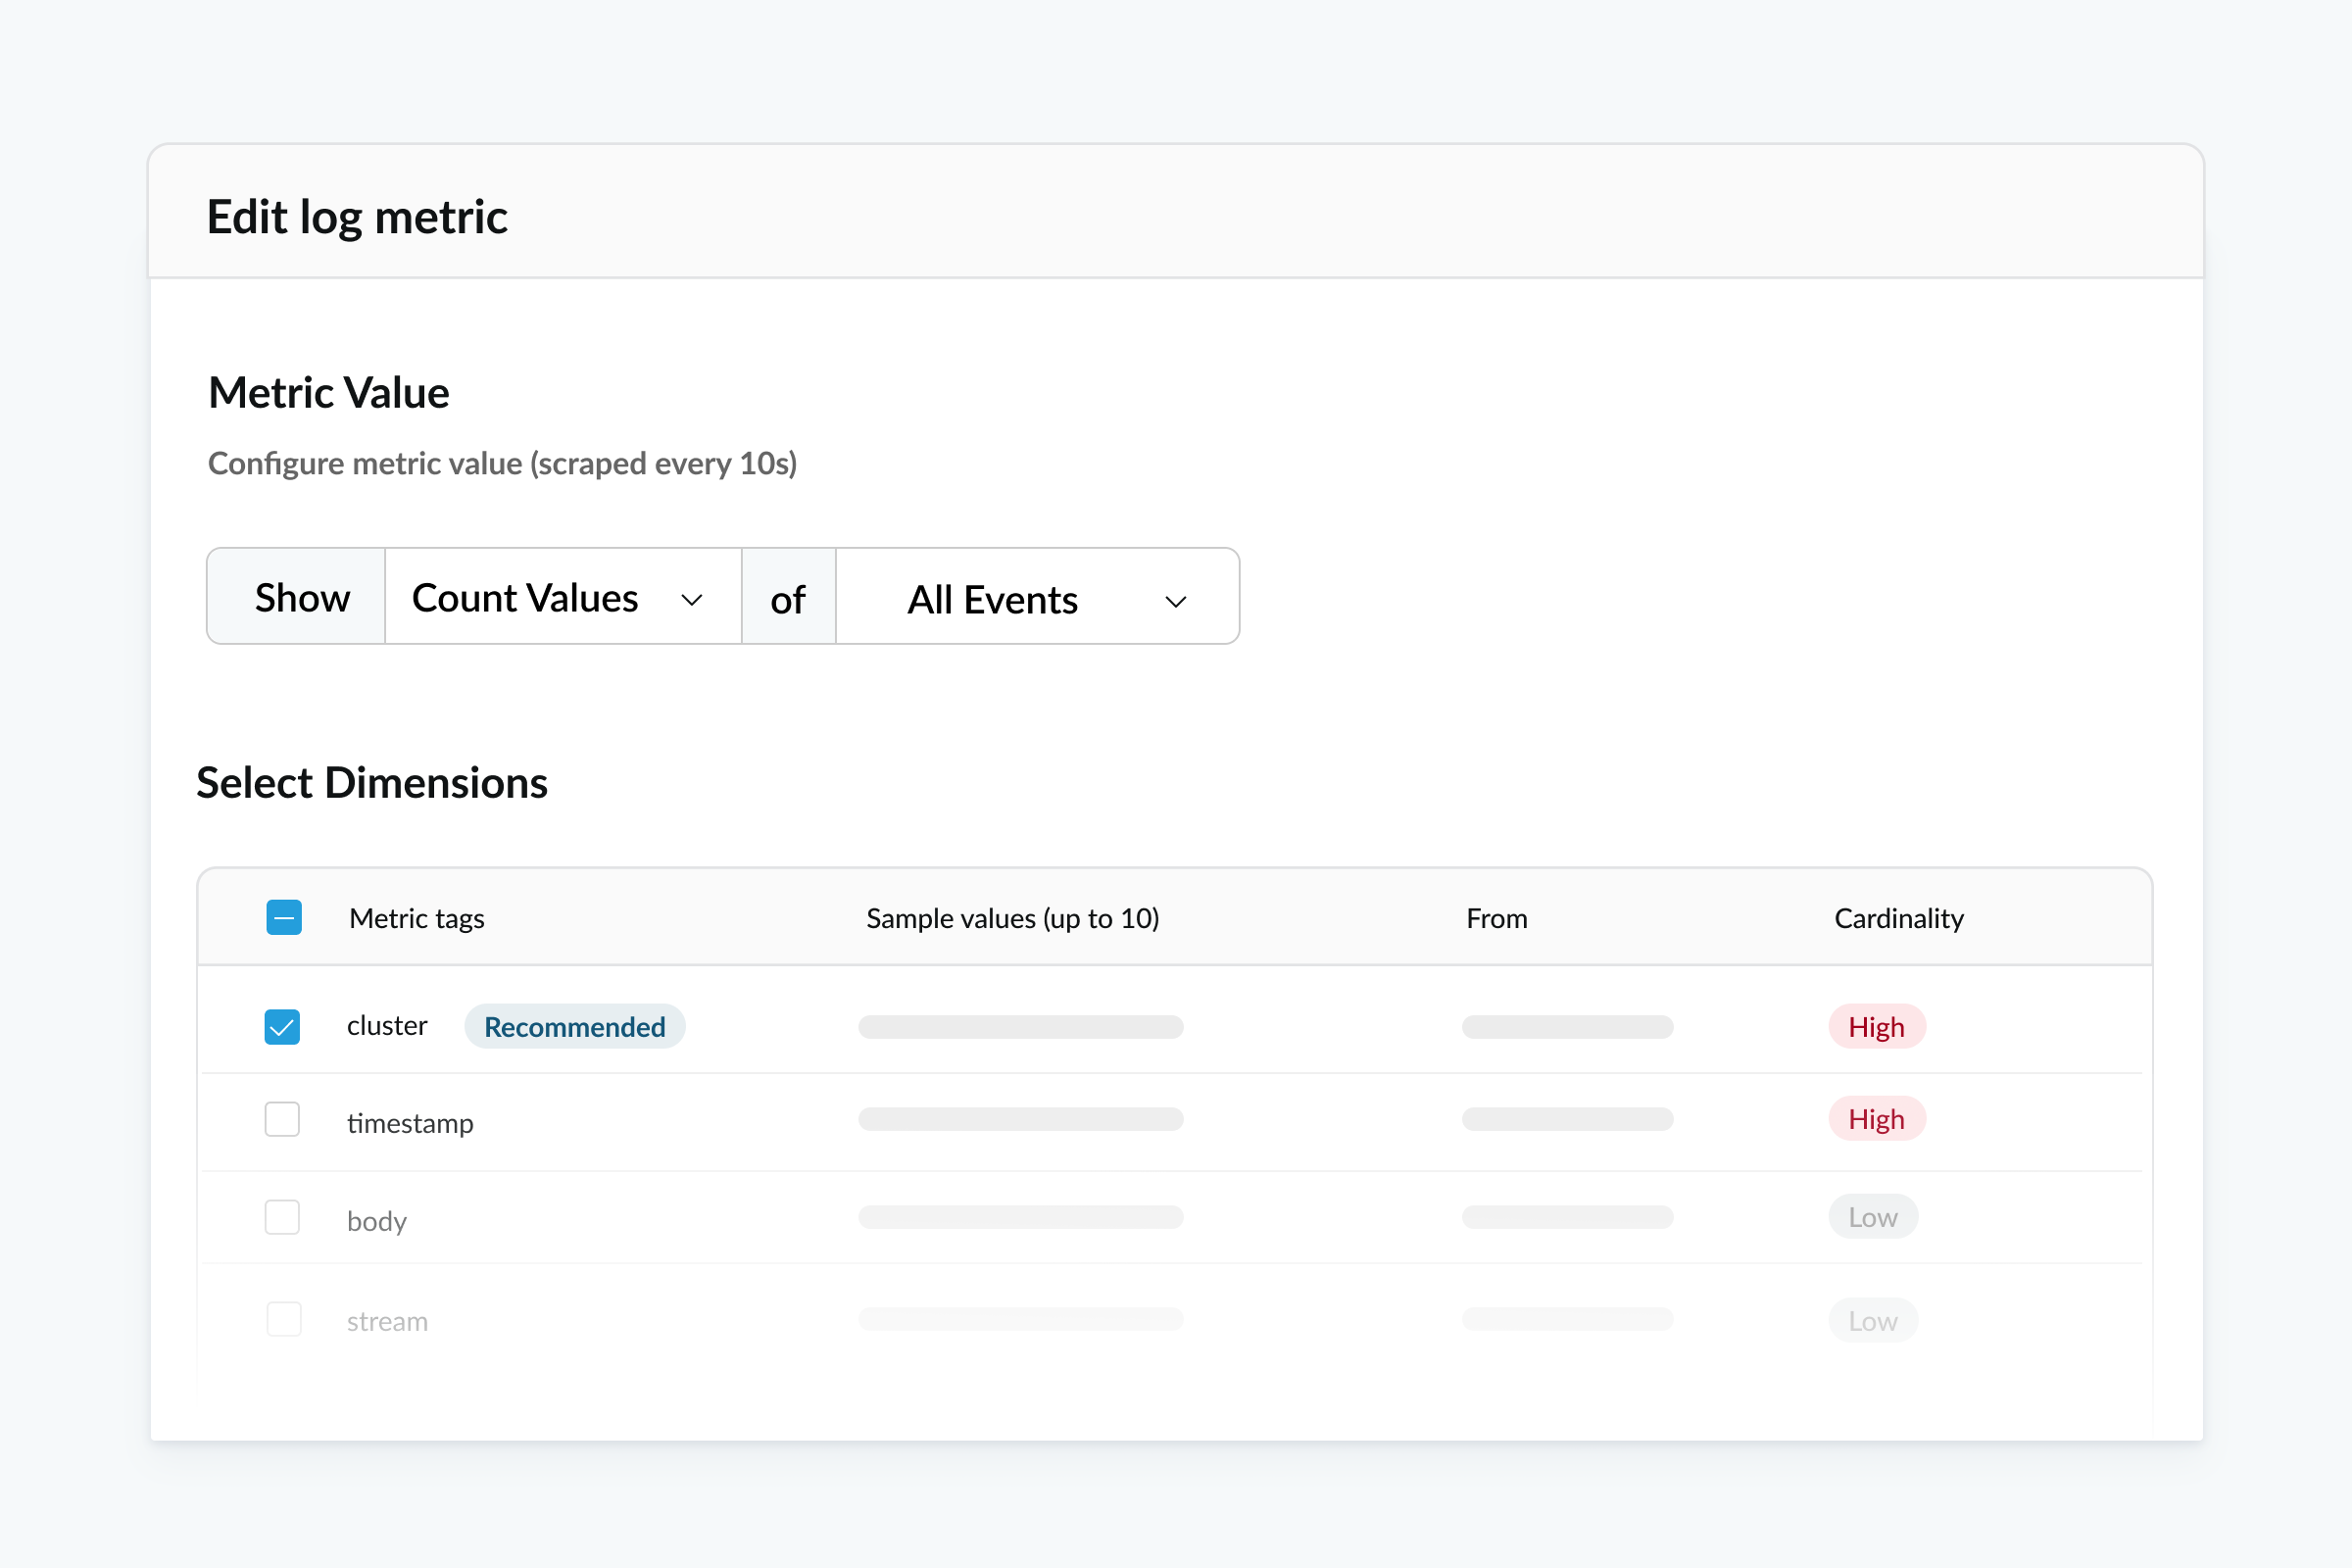
Derive custom metrics from the log attributes, patterns and content that matter to your business.
Extract any string from a log message with a point-and-click UI.
Generate virtually unlimited log-derived metrics for longer-term analysis at no extra cost.
Track trends over time without re-querying raw logs.
Dialpad accelerates troubleshooting for high-volume communications
Dialpad's platform handles millions of calls, texts and meetings a day, and reliability at scale is non-negotiable. With Observe uniting logs, metrics and traces in the Observability Context Graph, engineers can fix issues much faster.

Resources
Get Started
Performance at scale
Faster troubleshooting
Lower cost with an open data lake

Snowflake for Log Management
Get quick answers to log management questions and learn how Observe by Snowflake helps teams collect, search and retain logs at scale.
Log management is how teams collect, store, search and analyze the log data generated across their applications, infrastructure, security tools and business systems. With Observe by Snowflake, teams can bring all their log data into one platform and keep it instantly searchable, so they can troubleshoot issues, investigate incidents and meet compliance needs without managing indexes or data tiers.
Observe ingests logs through OpenTelemetry Collector, Fluentd, Fluent Bit and over 400 prebuilt integrations spanning cloud services, Kubernetes, containers and serverless environments. It accepts structured, semi-structured and unstructured data from any source, scales on demand and is built to absorb log bursts, so teams don't need to build buffers or pipelines to keep up.
Observe is built on the Telemetry Lakehouse Foundation, which separates storage from compute, so teams can retain logs long term at a nominal cost per GiB/month while keeping every log instantly searchable. There are no hot, warm, cold or frozen tiers to manage and no data to move, which removes both the cost surprises and the operational toil of traditional log platforms.
Logs in Observe don't sit in a silo. They're linked to metrics, traces and infrastructure through the Observability Context Graph, which maps how your services and systems relate. Teams can move from a service map or dashboard directly to the relevant logs, then bring in the Observe AI SRE to investigate across all telemetry and pinpoint the root cause faster.