
TL;DR:
A good data foundation that is ready for use by AI agents is essential when it comes to getting more accurate and efficient AI answers for your business questions. The AI Readiness Score measures how prepared your data is for AI-powered features like Cortex Code (CoCo) and CoWork, and provides concrete recommendations on how to improve your readiness. Run /ai-readiness-score in CoCo CLI or Snowsight in Cloud agents mode to try it.
Two factors that lead to AI readiness
We found that AI readiness boils down to two measurable dimensions:
1. Are there good data assets for AI to use? We call these consumption-ready (CR) tables, the analyst-facing data sets that are actively queried, return results quickly, and contain fresh data. We identify them from behavioral signals: read volume, user diversity, BI tool consumption, query latency and data freshness.
2. Can AI find those tables and query them correctly? This is where semantic views come in. Semantic views encode the metadata AI needs to query your data correctly: primary keys, table relationships, business metrics, column descriptions and verified example queries. Without this semantic layer, AI is more likely to be guessing the table names, column names and the way to conduct joins and aggregations.
A high AI Readiness score means both conditions are satisfied: the right tables exist and AI has the structured metadata to use them correctly.
How the score works
The AI Readiness Score combines three subdimensions:
| Dimension | What it measures |
|---|---|
| Demand Coverage | What percentage of your analytical queries land on consumption-ready tables (vs. raw/pipeline tables)? |
| Semantic View Coverage | What fraction of your consumption-ready tables have at least one semantic view defined over them? |
| Semantic View Quality | How complete are your semantic views — do they include primary keys, relationships, metrics, descriptions, and verified queries? |
The composite score combines demand coverage and SV readiness (itself a combination of coverage and quality) into a single 0–100 score. The scoring is designed so that a zero in any dimension — say, no semantic views at all — pulls the overall score down sharply.
For consumption-ready table identification, we score tables on four behavioral dimensions (activity, consumption breadth, speed and freshness) and require that all conditions are reasonably satisfied. A table with millions of reads but 10-minute query times still won't qualify — the scoring penalizes any single weak dimension rather than letting strong dimensions mask it.
Semantic view quality is assessed across nine signals that measure how much structured metadata AI has to work with — from basic properties like primary keys and relationships to richer signals like verified example queries and descriptive column comments.
How to improve your data
A score alone isn't useful. The framework classifies each schema's primary gap — the single dimension most limiting its AI readiness — and generates prioritized recommendations:
| Primary Gap | What it means | Action |
|---|---|---|
| Build CR tables | Most analytical traffic hits raw or pipeline tables — AI has no suitable targets. | Improve table design in high-traffic schemas. For example, create pipelines to create aggregated tables. |
| Create semantic views | Consumption-ready tables exist but AI can't reason over them effectively. | Build your first semantic views on the highest-read tables. That helps AI to query from the right table with the right columns. |
| Expand SV coverage | Some semantic views exist but most CR tables remain uncovered. | Extend semantic view coverage on the most frequently queried tables that are not yet covered. |
| Improve SV quality | Semantic views are in place but structurally incomplete. | Enrich the existing semantic views. Add join relationships between tables, define business metrics (for example, SUM(revenue), COUNT(DISTINCT user_id)), and add verified queries: curated Q&A examples that directly validate AI output. |
Each recommendation surfaces the specific schemas, tables or semantic views to act on, ranked by analytical read volume so you tackle the highest-impact items first.
Does it work?
We tested the framework on our own internal analytics database — dozens of schemas, thousands of tables and the relative rankings align with the team's understanding of these schemas.
One schema, containing SaaS connector metrics, initially scored 39/100. It had seven consumption-ready tables with strong analytical demand but zero semantic views. The framework's top recommendation was straightforward: create semantic views for these tables. After building SVs covering six of the seven tables, the score jumped to 82/100, along with better experiences using AI agents to answer business questions.
Try it yourself
The AI Readiness Score is available as a CoCo skill. See here for more details.
Skills are reusable workflows that extend CoCo's capabilities; invoke them with a slash command. Run it from the CLI or Snowsight in Cloud agents mode with /ai-readiness-score.
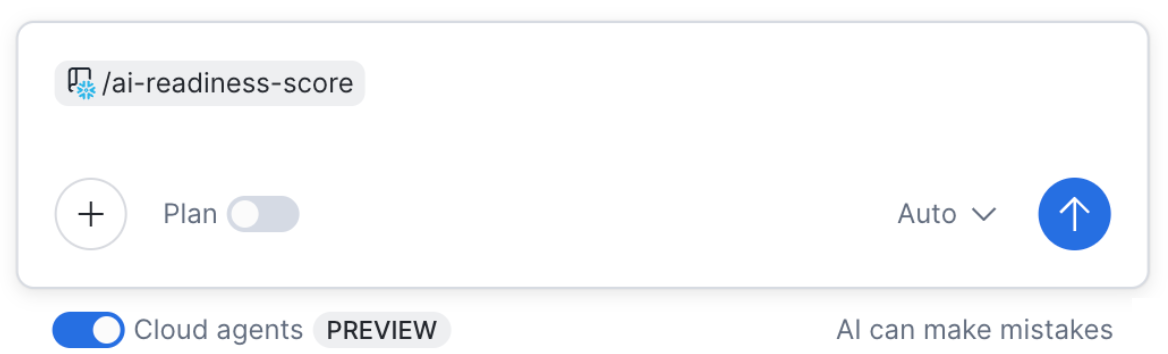
Once the skill is invoked, it will first ask you to choose how much query history to scan, from a quick 10% sample for a fast preview to a full scan for maximum accuracy.
It then scans your account_usage schema to identify all actively read tables, scores each one for consumption readiness, and evaluates semantic views. Runtime scales with your account's query activity. In our internal testing on a large, active development account (~43,000 tables), this was completed in 30–40 minutes on a Medium warehouse; a 2X-Large warehouse reduced that by roughly 15%. Accounts with lower query volumes should see proportionally shorter runtimes.
Note that you need a role that has access to the views in account_usage. Also, part of the semantic view metadata (verified queries) is retrieved using SHOW commands, which means the results are role-dependent. Users with broader privileges will see more semantic views and get a more complete picture of their account's readiness.
When the analysis is done, the skill produces a self-contained HTML report that you can share with your team. Results are cached so subsequent runs complete quickly.
We'd love to hear how your account scores and which improvements move the needle most for your team.
Example output
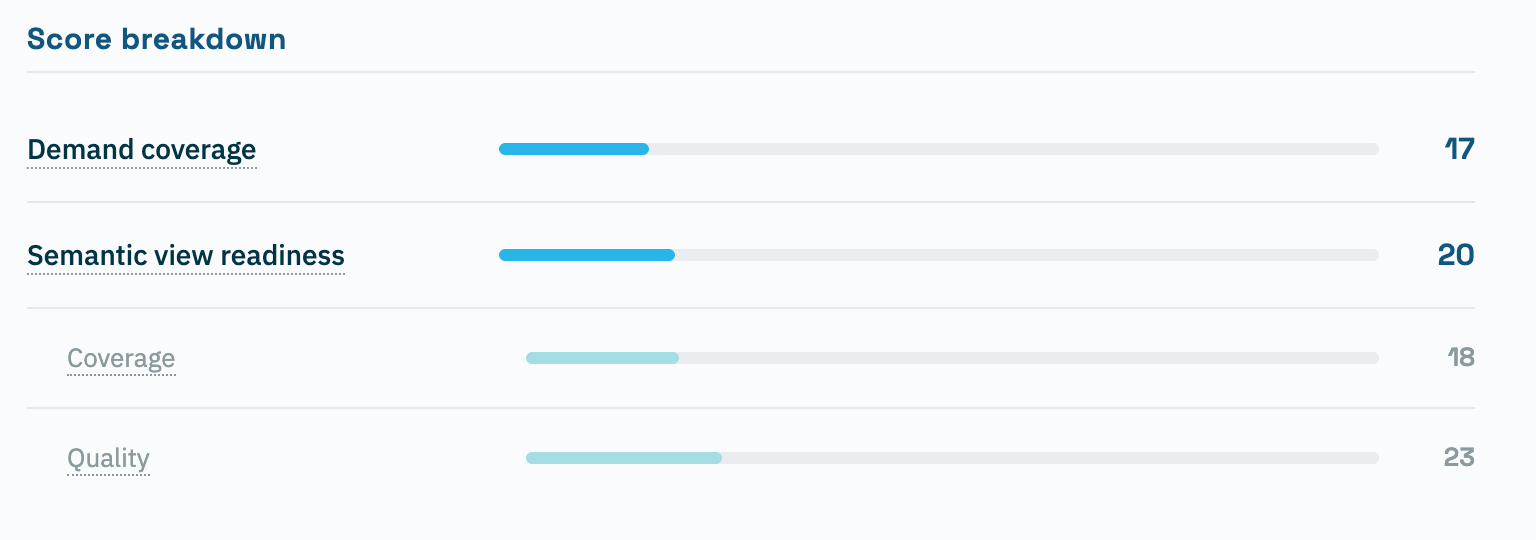
Below is an example report generated by the skill. The Score Breakdown section shows your composite score decomposed into its two primary dimensions, Demand Coverage and Semantic View Readiness, with SV Readiness further broken down into Coverage and Quality subscores, so you can see exactly where the gap is.
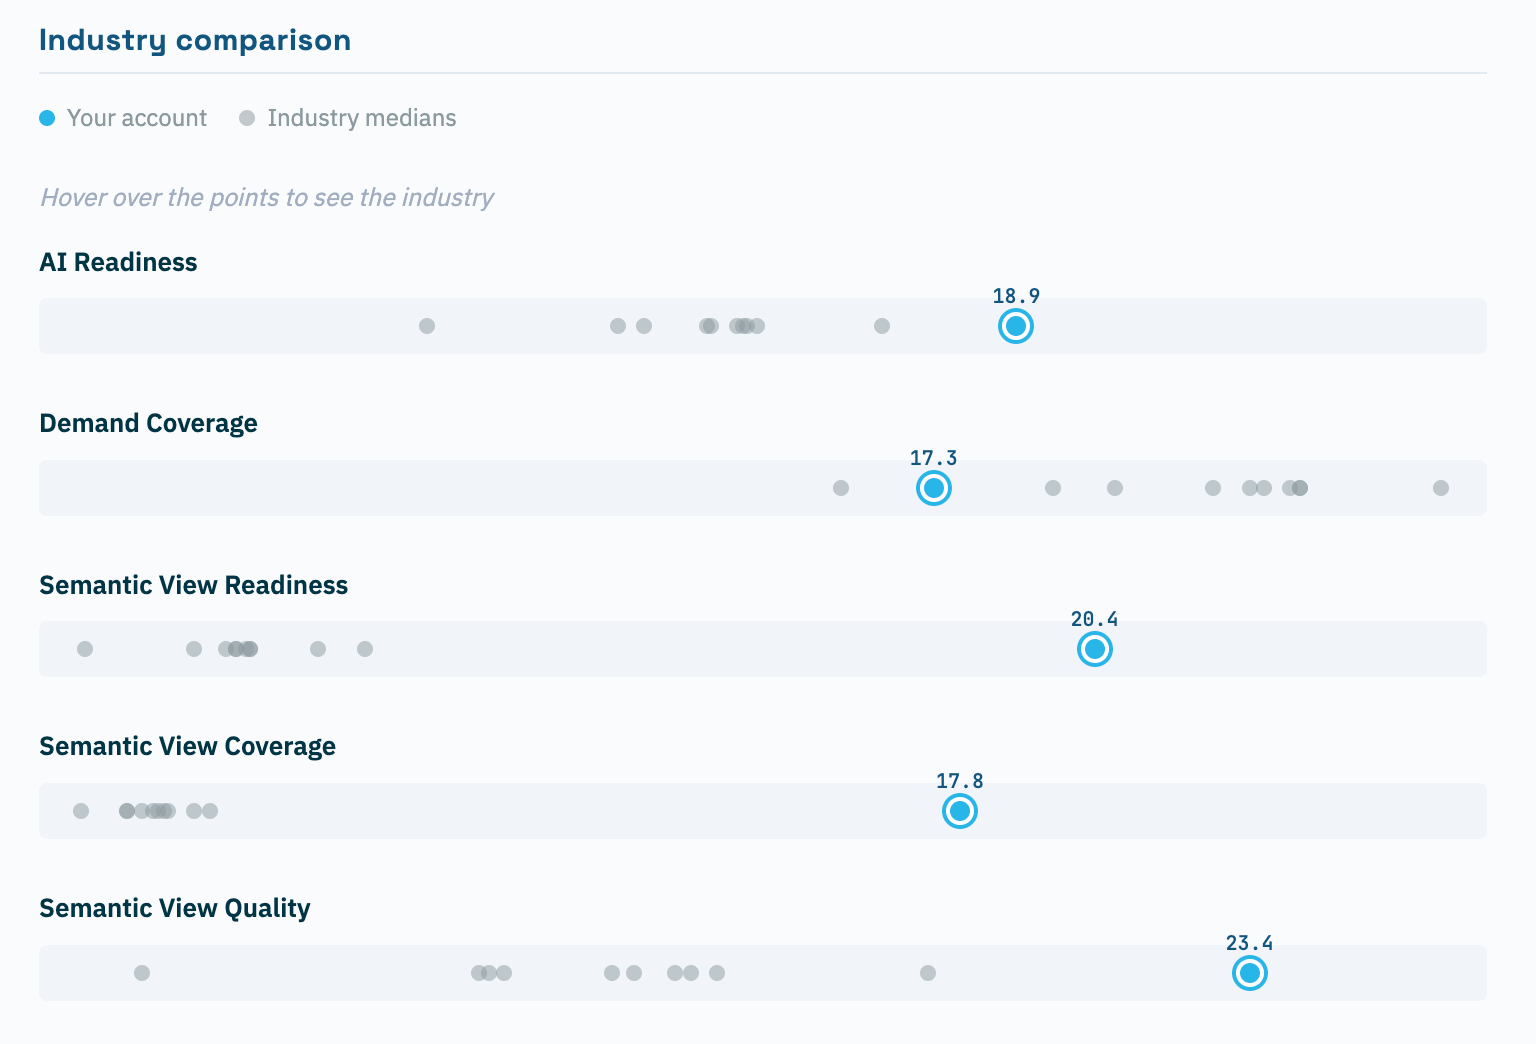
The Industry Comparison chart plots your account (blue) against the distribution of industry medians (gray), giving you a sense of where you stand relatively across each dimension.
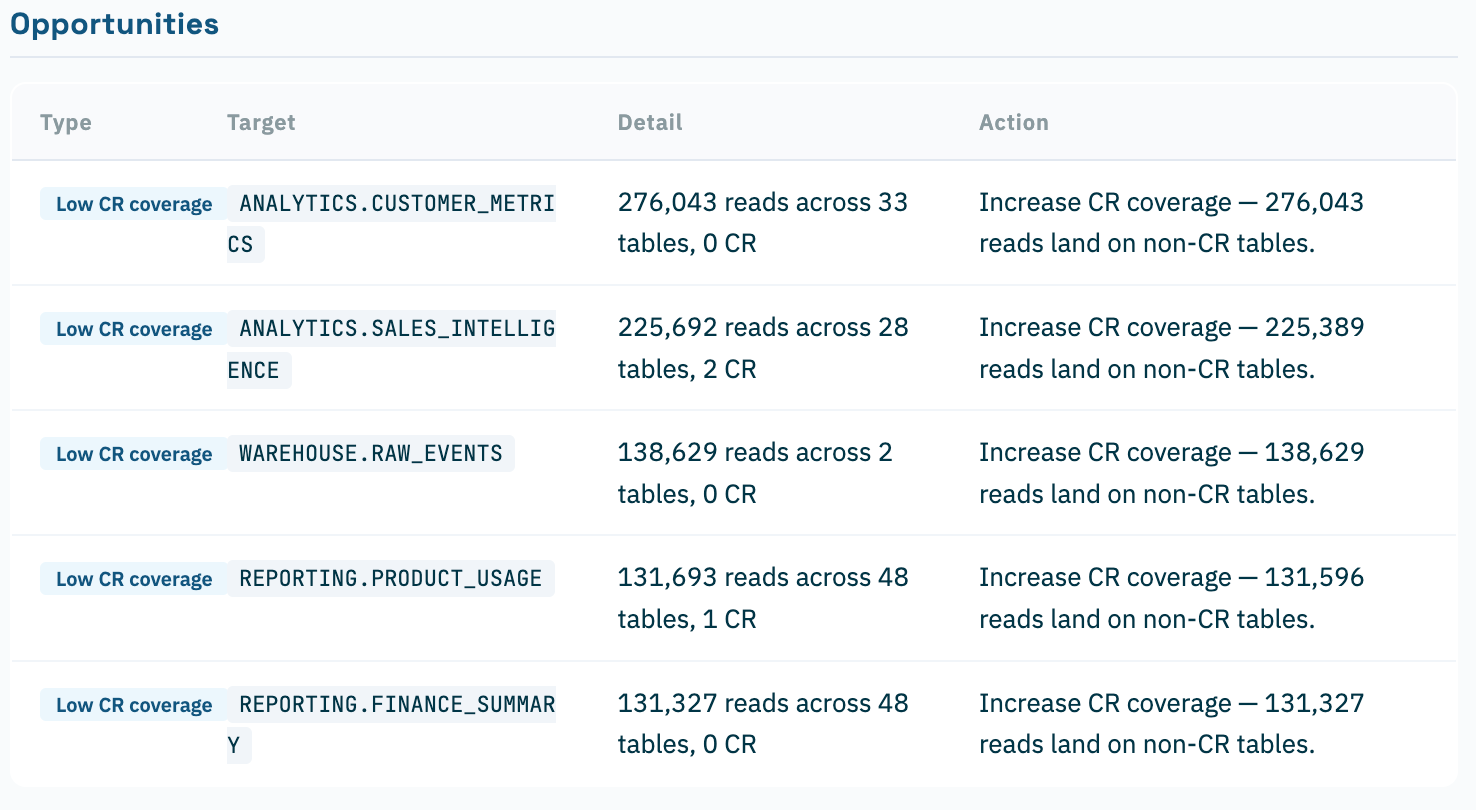
Finally, the Opportunities table is where the report gets actionable: It lists the specific schemas and tables ranked by analytical read volume, along with the gap type and a recommended action. In this example, the top opportunities are schemas with high read traffic but low CR table coverage — meaning most of those analytical queries are landing on tables that aren't suitable for AI, and that's where to focus first.
Appendix
Data sources
The skill queries the following views from SNOWFLAKE.ACCOUNT_USAGE:
| View | Used for |
|---|---|
ACCESS_HISTORY |
Per-table read counts, read-only detection, distinct user counts |
QUERY_HISTORY |
Query type, execution time, error filtering, warehouse detection |
SESSIONS |
Client application name (BI tool classification) |
TABLES |
DDL freshness (last_altered) |
SEMANTIC_VIEWS |
List of live semantic views |
SEMANTIC_TABLES |
Table-level signals: primary keys, unique keys, distinct ranges, synonyms |
SEMANTIC_DIMENSIONS |
Dimension-level synonyms and comments |
SEMANTIC_FACTS |
Fact-level synonyms and comments |
SEMANTIC_METRICS |
Metric existence, synonyms, and comments |
SEMANTIC_RELATIONSHIPS |
Relationship presence between tables |
Verified query counts are retrieved via SHOW SEMANTIC VIEWS commands, which are role-scoped: users with different roles will see different semantic views and may get different verified query counts. For the most accurate results, run the skill with a role that has visibility into all semantic views in your account.
Improving a semantic view: before and after
The SV quality score is built from nine signals. Here is a synthetic example showing how to go from a minimal semantic view to a well-enriched one.
Before — minimal, low-quality score:
CREATE OR REPLACE SEMANTIC VIEW mydb.analytics.orders_sv
  TABLES (
    orders AS mydb.analytics.fact_orders
  )
  DIMENSIONS (
    orders.order_date AS order_date,
    orders.status     AS status,
    orders.customer_id AS customer_id
  )
  FACTS (
    orders.revenue AS revenue
  );
This view scores low: no primary key, no relationships, no metrics, no synonyms, no verified queries and no column descriptions.
After — enriched, high-quality score:
CREATE OR REPLACE SEMANTIC VIEW mydb.analytics.orders_sv
  TABLES (
    orders    AS mydb.analytics.fact_orders
              PRIMARY KEY (order_id)                         -- +1: primary key
              WITH SYNONYMS = ('transactions', 'purchases')  -- +1: synonyms
              COMMENT = 'One row per customer order',
    customers AS mydb.analytics.dim_customers
              PRIMARY KEY (customer_id)
  )
  RELATIONSHIPS (
    -- Links orders to customers so AI can join across tables  -- +1: relationships
    orders_to_customers AS orders(customer_id) REFERENCES customers(customer_id)
  )
  DIMENSIONS (
    orders.order_date  AS order_date
                       WITH SYNONYMS = ('date', 'purchase date')
                       COMMENT = 'Date the order was placed',
    orders.status      AS status
                       COMMENT = 'Order status: pending, shipped, delivered, cancelled',
                       -- +1: distinct ranges (values hint for filters)
    orders.customer_id AS customer_id
                       COMMENT = 'Foreign key to dim_customers'
  )
  FACTS (
    orders.revenue AS revenue
                   COMMENT = 'Order revenue in USD'
  )
  METRICS (
    -- Pre-defined aggregations AI uses instead of guessing  -- +1: metrics
    orders.total_revenue  AS SUM(orders.revenue),
    orders.order_count    AS COUNT(orders.order_id),
    orders.unique_customers AS COUNT(DISTINCT orders.customer_id)
  )
  AI_VERIFIED_QUERIES (                                      -- +2: verified queries (highest weight)
    total_revenue_this_month AS (
      QUESTION 'What is total revenue this month?'
      SQL 'SELECT SUM(revenue) FROM mydb.analytics.fact_orders
           WHERE DATE_TRUNC(''month'', order_date) = DATE_TRUNC(''month'', CURRENT_DATE())'
    ),
    orders_by_status AS (
      QUESTION 'How many orders are in each status?'
      SQL 'SELECT status, COUNT(*) AS order_count
           FROM mydb.analytics.fact_orders
           GROUP BY status ORDER BY order_count DESC'
    )
  );
Each addition maps to a quality signal: primary key, synonyms, relationships, metrics, verified queries, and column comments all contribute to the score. Of these, verified queries carry the most weight — they are curated question-and-answer pairs that directly validate AI output. Even two or three verified queries per semantic view meaningfully improve the quality score.
