OCT 17, 2024|6 min read

Within Snowflake ML, the Snowflake Model Registry is a centralized hub for managing and deploying machine learning models directly within your Snowflake environment. Its core capabilities include centralized management with full Snowflake governance, lifecycle management, observability, enterprise security and, most importantly, a streamlined deployment experience that can typically be completed with a single API call for scalable inference.
Building a model inference solution that works well across diverse models, architectures and use cases (batch/online) is challenging. To meet these needs, we created a highly scalable online inference service from logged models, which also supports batch use cases.
This blog post details how we built the inference stack to cater all of the above. We leveraged Snowpark Container Services (to enable these inference services specifically optimized for low-latency online workloads while catering for batch requests as well. We will dive into the underlying architecture, starting with the simplicity of creating a service via a single API call or from Snowflake UI, exploring the automated process of building the container image with all necessary dependencies and concluding with a deep dive into the two-layer serving architecture (controller and engine) that powers these high-performance endpoints.
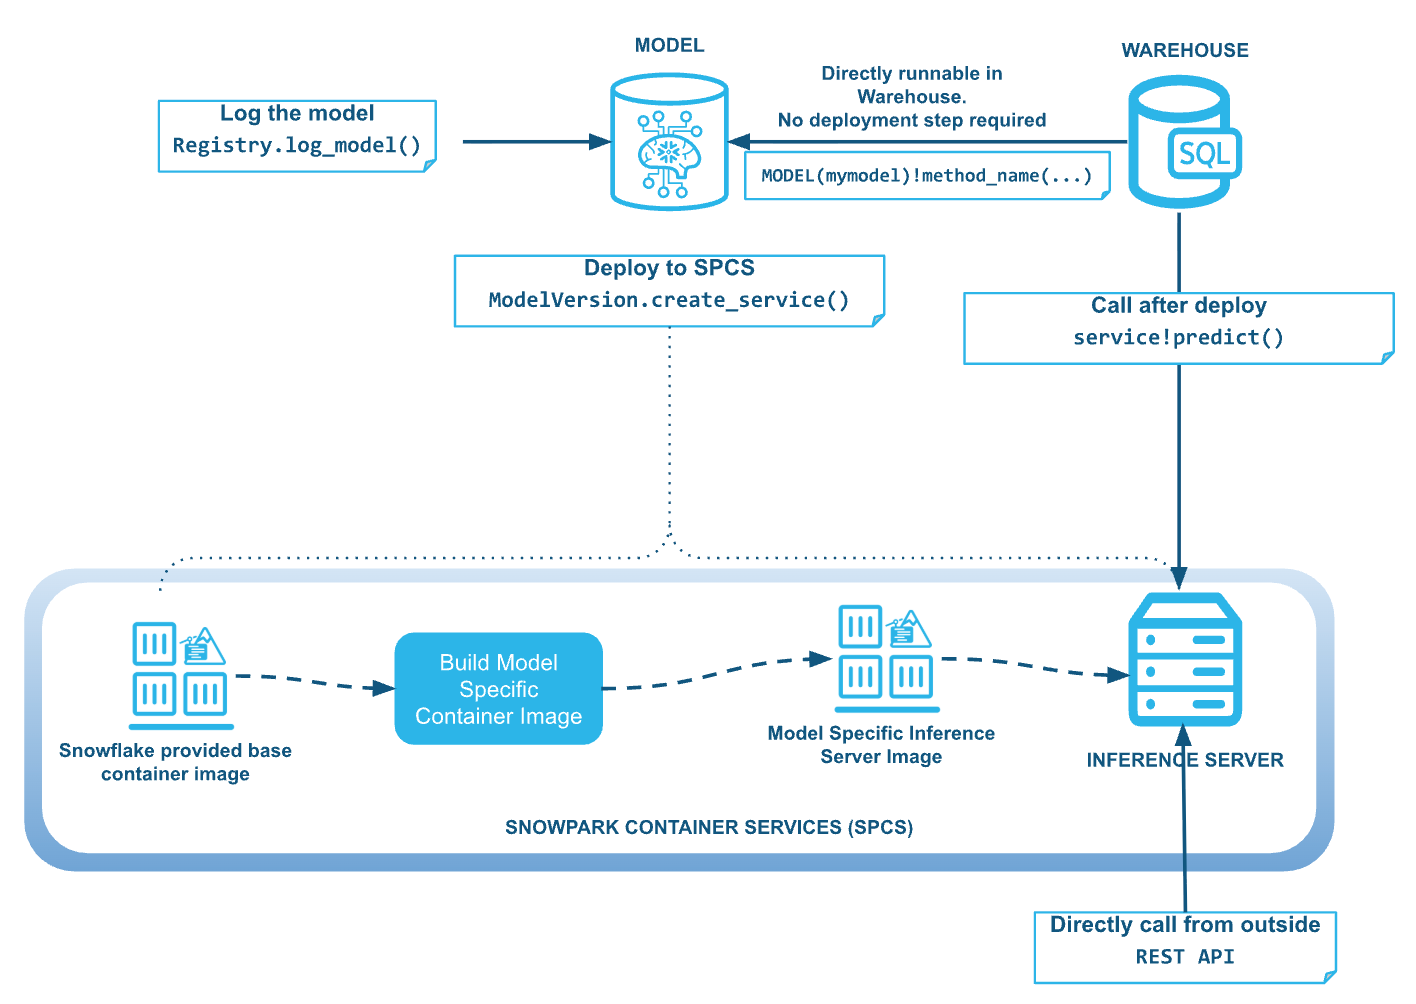
After logging a model in the Snowflake Model Registry, it’s just one API call (or click) away from a production-ready inference endpoint.
Model deployment is a simple process. Once you have a ModelVersion object, you can make your model available for inference by calling create_service():
model_version = registry.get_model("my_model").default
model_version.create_service(
    service_name="my_model_service",
    service_compute_pool="my_compute_pool",
    min_instances=0  # Available in 1.24+; 0 enabled auto-suspend
    max_instances=3,
)
In most common deployment scenarios, that's all it takes. Snowflake automates the rest: building the container image, deploying it to Snowpark Container Services and setting up the inference endpoint for your model. By default, a managed image repository is used, eliminating the need for you to manage container registries or image storage. Snowflake does what is needed to use the instances given to the deployment from the compute pool my_compute_pool.
When a service is created, Snowflake automatically constructs a custom container image perfectly tailored to your model's inference. This process involves a few key steps:
Artifacts and dependency resolution: The system automatically identifies and bundles all the necessary artifacts (model code, weights and custom wheels) and dependencies (such as conda packages or pip requirements) you specified during model logging into the container environment. We generally keep the dependencies of our inference server itself to very minimal.
Smart base image selection: Snowflake selects an optimized base image for the inference server based on your model's needs. For instance, GPU-enabled models receive CUDA-compatible base images, while CPU models utilize lighter alternatives. This optimization is designed to deliver peak performance by eliminating unnecessary overhead.
Optimization for low-latency inference: The final container image includes not only your model and its dependencies but also the inference runtime components engineered for low-latency serving. Furthermore, layer caching accelerates subsequent builds, streamlining the iterative development workflow.
While Snowflake is focused on ease of use, there is no compromise on flexibility. Users can still customize the deployment with more options such as GPU reservations or amount of parallelism put inside every single node (which depends on the model size and the node memory available). Refer to the Snowflake ML documentation for a complete list of available options.
model_version.create_service(
    service_name="my_model_service",
    service_compute_pool="my_compute_pool",
    max_instances=3,
    gpu_requests="1",
    num_workers=8
)
The performance of your model service is directly tied to the compute pool you select. For workloads that significantly benefit from GPU acceleration such as deep learning models, large language models or other data-intensive tasks, be sure to specify a GPU-enabled compute pool. This enables your model to run on the optimal hardware for the best possible inference performance.
We will provide more guidance on how to tune the other arguments for the create service API in a subsequent blog post in this series.
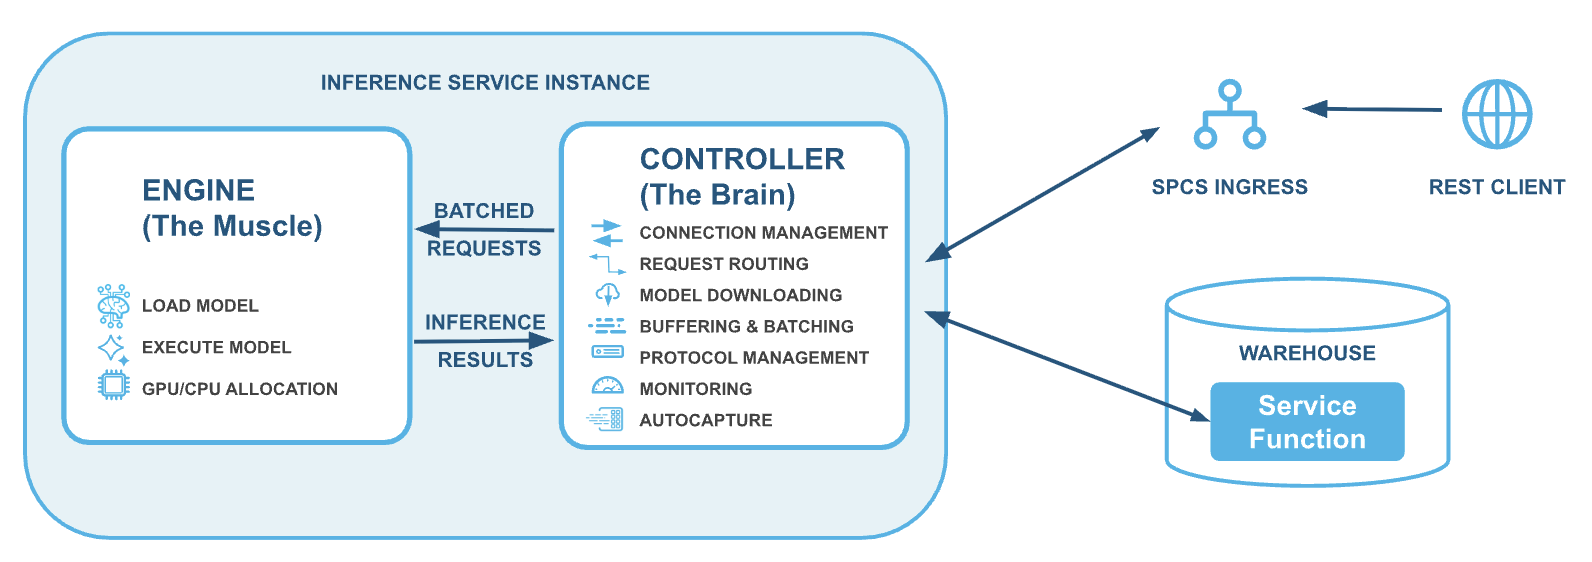
Snowflake's model serving architecture is fundamentally a two-layer system, designed for optimal performance and flexibility: a controller layer and an engine layer. This setup is best understood by thinking of the controller layer as the brain and the engine layer as the muscle, where each role is distinct and highly optimized.
This decoupled design offers key advantages:
Independent optimization: Layers scale separately. The CPU/memory-bound controller handles protocol translation, while the inference-optimized engine (often GPU-bound) focuses purely on execution.
Minimized dependency conflicts: Keeping the engine focused on inference reduces its dependency footprint, allowing it to support any model's specific dependencies without conflicts with the inference stack.
Encapsulation of complexity: The controller manages sophisticated features such as dynamic batching and autocapture, keeping the inference server simple and allowing Snowflake to deliver improvements without requiring model changes.
Crucially, this unified stack supports both high-volume service function requests (on Snowflake tables) and standard REST-based inference calls, with the controller efficiently managing both for optimal performance.
The controller layer functions as the service's central intelligence, managing the entire inference process from model downloading to request routing, ensuring a smooth and efficient inference endpoint.
Upon service startup, the controller's first task is to download your model from Snowflake's internal storage to the inference node. This is a crucial step, especially for large models such as LLMs that can range from tens to hundreds of gigabytes. Snowflake’s highly optimized model downloader leverages the node's full bandwidth, enabling the transfer of even very large models in minutes instead of hours. For example, in internal testing under optimized conditions, a 100-GB model has been observed to download in under a minute. To achieve this we used multipart download from a cloud provider’s blob storage with optimized chunk size. This design supports rapid service startup and allows for quicker scale-outs of the deployment.
Once the model is ready, the controller assumes its primary role as the intelligent gateway between external clients and your inference workers, providing the following functions.
Traffic buffering: To ensure consistent performance and prevent system overload during peak volume, the controller efficiently buffers incoming requests and manages the flow to the engine layer. Note that this is the layer that enables the same stack to be used for both online and batch use cases. At the same time, it balances latency, throughput and utilization.
Health and readiness: The controller provides essential health check endpoints, simplifying service status monitoring and integration with external orchestration systems.
Metrics collection: The controller also collects platform and some other performance metrics related to the processing of inference requests. These metrics are made available via the Snowflake event table. The platform metrics also power the dashboards found on the metrics page of your inference service.
The controller offers several advanced capabilities to optimize performance and integration:
Dynamic batching: For workloads that benefit from parallelism, the controller can intelligently group multiple individual requests into a single batch for the engine layer. This can lead to significant throughput improvements for specific model architectures. Our dynamic batching approach is also unique in that it does not introduce intentional batching delays, only batching requests when they have built up in the controller buffer because of unavailable inference workers.
Autocapture: The controller automatically logs prediction requests and responses into Snowflake tables, establishing a comprehensive audit trail for monitoring model behavior in a production environment. We will be publishing more details about our autocapture mechanism in a later blog post in this series.
Protocol support: Specifically for LLM workloads, the controller includes OpenAI-compatible endpoints, guaranteeing seamless integration with existing applications and tools that rely on standard chat completion APIs.
Running models in production requires visibility into what's happening. Snowflake's model serving comes with observability built in from the ground up. We collect both platform and application metrics automatically. Platform metrics track resource utilization CPU, memory and GPU, while application metrics capture inference-specific data such as request latency, throughput and error rates. These metrics flow through an OpenTelemetry-powered pipeline that collects data from the inference service and lands it directly into your Snowflake event table, ready for querying and dashboarding. Beyond metrics, we also provide an autocapture system that records inference requests and responses. This data is stored in a dedicated event table, making it available for analysis whether you're debugging unexpected model behavior, monitoring data drift or auditing predictions. Autocapture runs seamlessly in the background with minimal impact on inference performance.
The engine layer is the muscle of the service; it's where your model lives and where predictions actually happen. This layer focuses solely on fast, core ML tasks, providing a thin service to load and execute model predictions.
When the service starts, the inference server loads your model into memory. This happens in the background, allowing the service to become responsive quickly while the model initializes. The server caches important metadata such as input/output column names and data types so that subsequent requests can be processed efficiently without repeated lookups. For large models, this loading step is carefully optimized to use available memory efficiently and to prepare the model for fast inference.
As stated earlier, the inference engine is an extremely lightweight container. On startup it spawns inference workers that listen for inference requests from the controller. Each inference worker can perform inference independently. If there are GPUs available, they are split evenly among these workers.
Each inference worker is thin and simply calls the method on your model that matches the request the inference request is for.
This pipeline is streamlined for speed. The server knows your model's signature ahead of time, so there's no guesswork, with data flowing directly to the right method with the right format.
The inference server supports multiple workers to handle requests in parallel. Each worker can process requests independently, which means your service can handle multiple predictions simultaneously. For models that are CPU-bound, more workers can improve throughput. For GPU models, workers share the GPU efficiently to maximize utilization. The num_workers parameter in create_service() lets you tune this based on your workload.
The inference server is designed to work with a wide variety of model frameworks, including scikit-learn, XGBoost, PyTorch, Hugging Face Transformers and more. Regardless of the framework, the interface remains consistent: Data comes in, predictions go out. This abstraction lets you deploy models without worrying about framework-specific serving details.
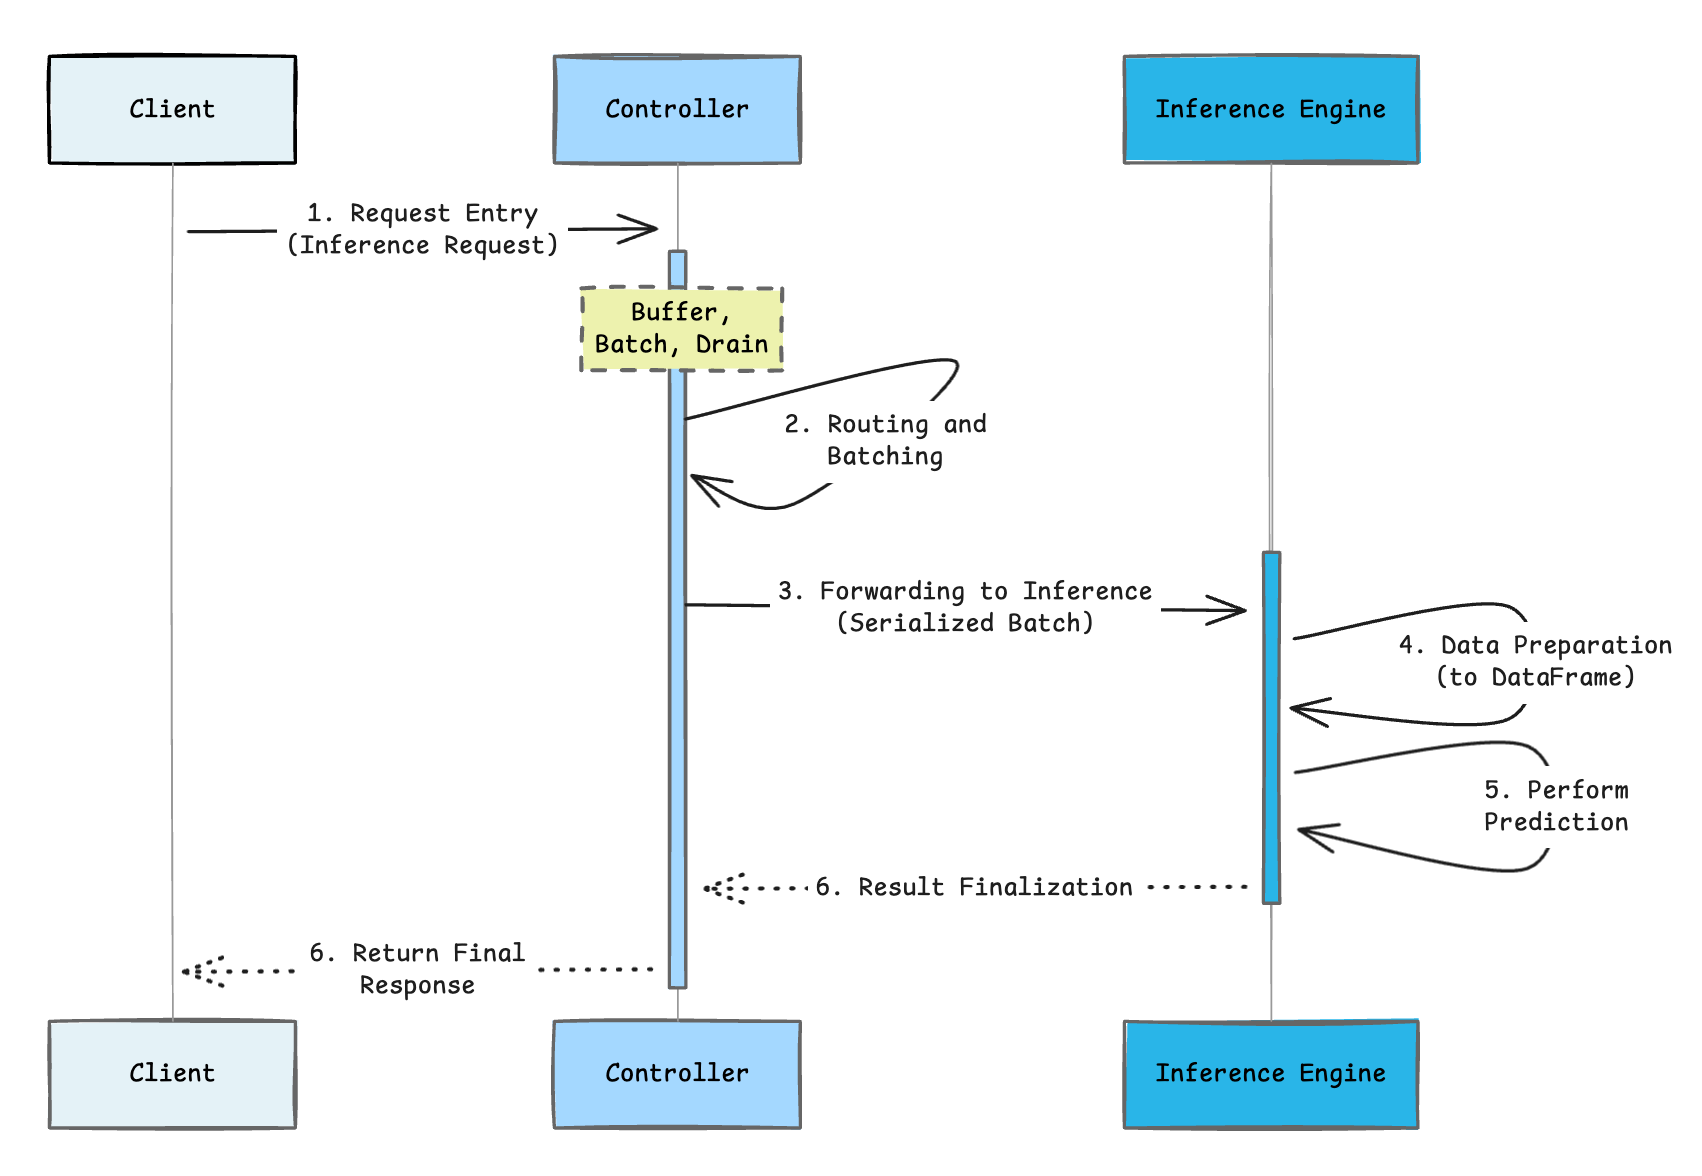
1. Entry request (controller)
All inference requests, whether from REST, the mv.run API or the MODEL(my_model)!predict() SQL syntax, initially arrive at the controller server.
2. Routing and batching
Upon arrival, the controller immediately adds the request to its buffer. Controller workers efficiently drain the buffer, constructing batches up to a maximum size. Crucially, there is no waiting time at the controller; requests are processed and batched as long as inference workers are available.
3. Forwarding to inference
The batched (or individual) request data is serialized by the controller and sent to the inference engine.
4. Data preparation
The inference server transforms input data into a pandas DataFrame, which is the precise input format required by the model.
5. Model execution (core inference)
This is where the actual prediction happens. The trained model processes the prepared input features and executes the inference to generate the results.
6. Result finalization and response
The prediction results are serialized back into JSON format. The response then travels back through the controller to the client. If inference capture is enabled, the controller asynchronously logs the request-response pair for monitoring and delivers the final result to the caller.
This entire flow is optimized for latency. Every component is engineered to minimize overhead and help deliver predictions with low end-to-end latency.
In this blog post, we outlined the two-layer architecture behind Snowflake ML’s unified model serving that delivers scalable, low-latency inference. The process enables the transition from a registered model to a service that can be used for a low-latency endpoint as well as backend for batch inference called from SQL with a single API call. Key to this are the intelligent controller layer, which handles orchestration, and the specialized engine layer, focused on high-speed prediction execution. This separation allows operational simplicity and peak performance for LLM and deep learning workloads.
In the next part of this series, we will dive deeper into dynamic batching, analyzing its impact on latency through performance benchmarks. We will also explore the autocapture mechanism, which automatically creates an MLOps audit trail by logging production data into Snowflake tables.