Resource Optimization: Billing Metrics
Overview
This resource optimization guide represents one module of the four contained in the series. These guides are meant to help customers better monitor and manage their credit consumption. Helping our customers build confidence that their credits are being used efficiently is key to an ongoing successful partnership. In addition to this set of Snowflake Quickstarts for Resource Optimization, Snowflake also offers community support as well as Training and Professional Services offerings. To learn more about the paid offerings, take a look at upcoming education and training.
This blog post can provide you with a better understanding of Snowflake's Resource Optimization capabilities.
Billing Metrics
Billing queries are responsible for identifying total costs associated with the high level functions of the Snowflake Cloud Data Platform, which includes warehouse compute, snowpipe compute, and storage costs. If costs are noticeably higher in one category versus the others, you may want to evaluate what might be causing that.
These metrics also seek to identify those queries that are consuming the most amount of credits. From there, each of these queries can be analyze for their importance (do they need to be run as frequently, if at all) and explore if additional controls need to be in place to prevent excessive consumption (i.e. resource monitors, statement timeouts, etc.).
What You’ll Learn
- how to identify and analyze Snowflake consumption across all services
- how to analyze most resource-intensive queries
- how to analyze serverless consumption
What You’ll Need
- A Snowflake Account
- Access to view Account Usage Data Share
Related Materials
- Resource Optimization: Setup & Configuration
- Resource Optimization: Usage Monitoring
- Resource Optimization: Performance
Query Tiers
Each query within the Resource Optimization Snowflake Quickstarts will have a tier designation just to the right of its name as "(T*)". The following tier descriptions should help to better understand those designations.
Tier 1 Queries
At its core, Tier 1 queries are essential to Resource Optimization at Snowflake and should be used by each customer to help with their consumption monitoring - regardless of size, industry, location, etc.
Tier 2 Queries
Tier 2 queries, while still playing a vital role in the process, offer an extra level of depth around Resource Optimization and while they may not be essential to all customers and their workloads, it can offer further explanation as to any additional areas in which over-consumption may be identified.
Tier 3 Queries
Finally, Tier 3 queries are designed to be used by customers that are looking to leave no stone unturned when it comes to optimizing their consumption of Snowflake. While these queries are still very helpful in this process, they are not as critical as the queries in Tier 1 & 2.
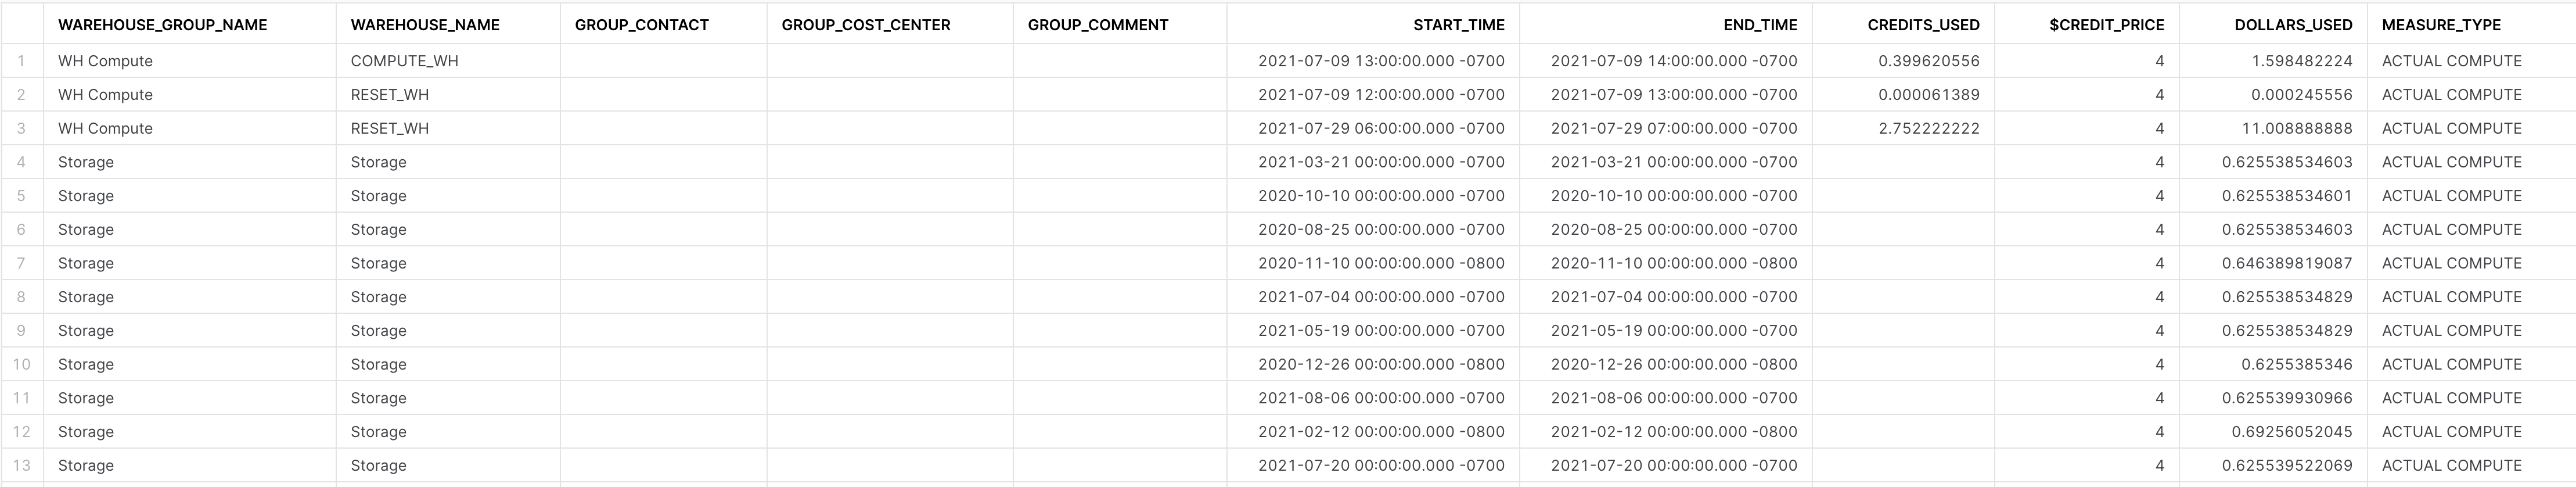
Billing Metrics (T1)
Tier 1
Description:
Identify key metrics as it pertains to total compute costs from warehouses, serverless features, and total storage costs.
How to Interpret Results:
Where are we seeing most of our costs coming from (compute, serverless, storage)? Are seeing excessive costs in any of those categories that are above expectations?
Primary Schema:
Account_Usage
SQL
/* These queries can be used to measure where costs have been incurred by
   the different cost vectors within a Snowflake account including:
   1) Warehouse Costs
   2) Serverless Costs
   3) Storage Costs

   To accurately report the dollar amounts, make changes to the variables
   defined on lines 17 to 20 to properly reflect your credit price, the initial
   capacity purchased, when your contract started and the term (default 12 months)

   If unsure, ask your Sales Engineer or Account Executive
*/

USE DATABASE SNOWFLAKE;
USE SCHEMA ACCOUNT_USAGE;

SET CREDIT_PRICE = 4.00; --edit this number to reflect credit price
SET TERM_LENGTH = 12; --integer value in months
SET TERM_START_DATE = '2019-01-01';
SET TERM_AMOUNT = 100000.00; --number(10,2) value in dollars


WITH CONTRACT_VALUES AS (

      SELECT
               $CREDIT_PRICE::decimal(10,2) as CREDIT_PRICE
              ,$TERM_AMOUNT::decimal(38,0) as TOTAL_CONTRACT_VALUE
              ,$TERM_START_DATE::timestamp as CONTRACT_START_DATE
              ,DATEADD(month,$TERM_LENGTH,$TERM_START_DATE)::timestamp as CONTRACT_END_DATE

),
PROJECTED_USAGE AS (

      SELECT
                 CREDIT_PRICE
                ,TOTAL_CONTRACT_VALUE
                ,CONTRACT_START_DATE
                ,CONTRACT_END_DATE
                ,(TOTAL_CONTRACT_VALUE)
                    /
                    DATEDIFF(day,CONTRACT_START_DATE,CONTRACT_END_DATE)  AS DOLLARS_PER_DAY
                , (TOTAL_CONTRACT_VALUE/CREDIT_PRICE)
                    /
                DATEDIFF(day,CONTRACT_START_DATE,CONTRACT_END_DATE) AS CREDITS_PER_DAY
      FROM      CONTRACT_VALUES

)

--COMPUTE FROM WAREHOUSES
SELECT
         'WH Compute' as WAREHOUSE_GROUP_NAME
        ,WMH.WAREHOUSE_NAME
        ,NULL AS GROUP_CONTACT
        ,NULL AS GROUP_COST_CENTER
        ,NULL AS GROUP_COMMENT
        ,WMH.START_TIME
        ,WMH.END_TIME
        ,WMH.CREDITS_USED
        ,$CREDIT_PRICE
        ,($CREDIT_PRICE*WMH.CREDITS_USED) AS DOLLARS_USED
        ,'ACTUAL COMPUTE' AS MEASURE_TYPE
from    SNOWFLAKE.ACCOUNT_USAGE.WAREHOUSE_METERING_HISTORY WMH

UNION ALL

--COMPUTE FROM SNOWPIPE
SELECT
         'Snowpipe' AS WAREHOUSE_GROUP_NAME
        ,PUH.PIPE_NAME AS WAREHOUSE_NAME
        ,NULL AS GROUP_CONTACT
        ,NULL AS GROUP_COST_CENTER
        ,NULL AS GROUP_COMMENT
        ,PUH.START_TIME
        ,PUH.END_TIME
        ,PUH.CREDITS_USED
        ,$CREDIT_PRICE
        ,($CREDIT_PRICE*PUH.CREDITS_USED) AS DOLLARS_USED
        ,'ACTUAL COMPUTE' AS MEASURE_TYPE
from    SNOWFLAKE.ACCOUNT_USAGE.PIPE_USAGE_HISTORY PUH

UNION ALL

--COMPUTE FROM CLUSTERING
SELECT
         'Auto Clustering' AS WAREHOUSE_GROUP_NAME
        ,DATABASE_NAME || '.' || SCHEMA_NAME || '.' || TABLE_NAME AS WAREHOUSE_NAME
        ,NULL AS GROUP_CONTACT
        ,NULL AS GROUP_COST_CENTER
        ,NULL AS GROUP_COMMENT
        ,ACH.START_TIME
        ,ACH.END_TIME
        ,ACH.CREDITS_USED
        ,$CREDIT_PRICE
        ,($CREDIT_PRICE*ACH.CREDITS_USED) AS DOLLARS_USED
        ,'ACTUAL COMPUTE' AS MEASURE_TYPE
from    SNOWFLAKE.ACCOUNT_USAGE.AUTOMATIC_CLUSTERING_HISTORY ACH

UNION ALL

--COMPUTE FROM MATERIALIZED VIEWS
SELECT
         'Materialized Views' AS WAREHOUSE_GROUP_NAME
        ,DATABASE_NAME || '.' || SCHEMA_NAME || '.' || TABLE_NAME AS WAREHOUSE_NAME
        ,NULL AS GROUP_CONTACT
        ,NULL AS GROUP_COST_CENTER
        ,NULL AS GROUP_COMMENT
        ,MVH.START_TIME
        ,MVH.END_TIME
        ,MVH.CREDITS_USED
        ,$CREDIT_PRICE
        ,($CREDIT_PRICE*MVH.CREDITS_USED) AS DOLLARS_USED
        ,'ACTUAL COMPUTE' AS MEASURE_TYPE
from    SNOWFLAKE.ACCOUNT_USAGE.MATERIALIZED_VIEW_REFRESH_HISTORY MVH

UNION ALL

--COMPUTE FROM SEARCH OPTIMIZATION
SELECT
         'Search Optimization' AS WAREHOUSE_GROUP_NAME
        ,DATABASE_NAME || '.' || SCHEMA_NAME || '.' || TABLE_NAME AS WAREHOUSE_NAME
        ,NULL AS GROUP_CONTACT
        ,NULL AS GROUP_COST_CENTER
        ,NULL AS GROUP_COMMENT
        ,SOH.START_TIME
        ,SOH.END_TIME
        ,SOH.CREDITS_USED
        ,$CREDIT_PRICE
        ,($CREDIT_PRICE*SOH.CREDITS_USED) AS DOLLARS_USED
        ,'ACTUAL COMPUTE' AS MEASURE_TYPE
from    SNOWFLAKE.ACCOUNT_USAGE.SEARCH_OPTIMIZATION_HISTORY SOH

UNION ALL

--COMPUTE FROM REPLICATION
SELECT
         'Replication' AS WAREHOUSE_GROUP_NAME
        ,DATABASE_NAME AS WAREHOUSE_NAME
        ,NULL AS GROUP_CONTACT
        ,NULL AS GROUP_COST_CENTER
        ,NULL AS GROUP_COMMENT
        ,RUH.START_TIME
        ,RUH.END_TIME
        ,RUH.CREDITS_USED
        ,$CREDIT_PRICE
        ,($CREDIT_PRICE*RUH.CREDITS_USED) AS DOLLARS_USED
        ,'ACTUAL COMPUTE' AS MEASURE_TYPE
from    SNOWFLAKE.ACCOUNT_USAGE.REPLICATION_USAGE_HISTORY RUH

UNION ALL

--STORAGE COSTS
SELECT
         'Storage' AS WAREHOUSE_GROUP_NAME
        ,'Storage' AS WAREHOUSE_NAME
        ,NULL AS GROUP_CONTACT
        ,NULL AS GROUP_COST_CENTER
        ,NULL AS GROUP_COMMENT
        ,SU.USAGE_DATE
        ,SU.USAGE_DATE
        ,NULL AS CREDITS_USED
        ,$CREDIT_PRICE
        ,((STORAGE_BYTES + STAGE_BYTES + FAILSAFE_BYTES)/(1024*1024*1024*1024)*23)/DA.DAYS_IN_MONTH AS DOLLARS_USED
        ,'ACTUAL COMPUTE' AS MEASURE_TYPE
from    SNOWFLAKE.ACCOUNT_USAGE.STORAGE_USAGE SU
JOIN    (SELECT COUNT(*) AS DAYS_IN_MONTH,TO_DATE(DATE_PART('year',D_DATE)||'-'||DATE_PART('month',D_DATE)||'-01') as DATE_MONTH FROM SNOWFLAKE_SAMPLE_DATA.TPCDS_SF10TCL.DATE_DIM GROUP BY TO_DATE(DATE_PART('year',D_DATE)||'-'||DATE_PART('month',D_DATE)||'-01')) DA ON DA.DATE_MONTH = TO_DATE(DATE_PART('year',USAGE_DATE)||'-'||DATE_PART('month',USAGE_DATE)||'-01')

UNION ALL


SELECT
         NULL as WAREHOUSE_GROUP_NAME
        ,NULL as WAREHOUSE_NAME
        ,NULL as GROUP_CONTACT
        ,NULL as GROUP_COST_CENTER
        ,NULL as GROUP_COMMENT
        ,DA.D_DATE::timestamp as START_TIME
        ,DA.D_DATE::timestamp as END_TIME
        ,PU.CREDITS_PER_DAY AS CREDITS_USED
        ,PU.CREDIT_PRICE
        ,PU.DOLLARS_PER_DAY AS DOLLARS_USED
        ,'PROJECTED COMPUTE' AS MEASURE_TYPE
FROM    PROJECTED_USAGE PU
JOIN    SNOWFLAKE_SAMPLE_DATA.TPCDS_SF10TCL.DATE_DIM DA ON DA.D_DATE BETWEEN PU.CONTRACT_START_DATE AND PU.CONTRACT_END_DATE

UNION ALL


SELECT
         NULL as WAREHOUSE_GROUP_NAME
        ,NULL as WAREHOUSE_NAME
        ,NULL as GROUP_CONTACT
        ,NULL as GROUP_COST_CENTER
        ,NULL as GROUP_COMMENT
        ,NULL as START_TIME
        ,NULL as END_TIME
        ,NULL AS CREDITS_USED
        ,PU.CREDIT_PRICE
        ,PU.TOTAL_CONTRACT_VALUE AS DOLLARS_USED
        ,'CONTRACT VALUES' AS MEASURE_TYPE
FROM    PROJECTED_USAGE PU
;
Screenshot
Most Expensive Queries (T2)
Tier 2
Description:
This query orders the most expensive queries from the last 30 days. It takes into account the warehouse size, assuming that a 1 minute query on larger warehouse is more expensive than a 1 minute query on a smaller warehouse
How to Interpret Results:
This is an opportunity to evaluate expensive queries and take some action. The admin could:
-look at the query profile
-contact the user who executed the query
-take action to optimize these queries
Primary Schema:
Account_Usage
SQL
WITH WAREHOUSE_SIZE AS
(
     SELECT WAREHOUSE_SIZE, NODES
       FROM (
              SELECT 'X-SMALL' AS WAREHOUSE_SIZE, 1 AS NODES
              UNION ALL
              SELECT 'SMALL' AS WAREHOUSE_SIZE, 2 AS NODES
              UNION ALL
              SELECT 'MEDIUM' AS WAREHOUSE_SIZE, 4 AS NODES
              UNION ALL
              SELECT 'LARGE' AS WAREHOUSE_SIZE, 8 AS NODES
              UNION ALL
              SELECT 'X-LARGE' AS WAREHOUSE_SIZE, 16 AS NODES
              UNION ALL
              SELECT '2X-LARGE' AS WAREHOUSE_SIZE, 32 AS NODES
              UNION ALL
              SELECT '3X-LARGE' AS WAREHOUSE_SIZE, 64 AS NODES
              UNION ALL
              SELECT '4X-LARGE' AS WAREHOUSE_SIZE, 128 AS NODES
            )
),
QUERY_HISTORY AS
(
     SELECT QH.QUERY_ID
           ,QH.QUERY_TEXT
           ,QH.USER_NAME
           ,QH.ROLE_NAME
           ,QH.EXECUTION_TIME
           ,QH.WAREHOUSE_SIZE
      FROM SNOWFLAKE.ACCOUNT_USAGE.QUERY_HISTORY QH
     WHERE START_TIME > DATEADD(month,-2,CURRENT_TIMESTAMP())
)

SELECT QH.QUERY_ID
      ,'https://' || current_account() || '.snowflakecomputing.com/console#/monitoring/queries/detail?queryId='||QH.QUERY_ID AS QU
      ,QH.QUERY_TEXT
      ,QH.USER_NAME
      ,QH.ROLE_NAME
      ,QH.EXECUTION_TIME as EXECUTION_TIME_MILLISECONDS
      ,(QH.EXECUTION_TIME/(1000)) as EXECUTION_TIME_SECONDS
      ,(QH.EXECUTION_TIME/(1000*60)) AS EXECUTION_TIME_MINUTES
      ,(QH.EXECUTION_TIME/(1000*60*60)) AS EXECUTION_TIME_HOURS
      ,WS.WAREHOUSE_SIZE
      ,WS.NODES
      ,(QH.EXECUTION_TIME/(1000*60*60))*WS.NODES as RELATIVE_PERFORMANCE_COST

FROM QUERY_HISTORY QH
JOIN WAREHOUSE_SIZE WS ON WS.WAREHOUSE_SIZE = upper(QH.WAREHOUSE_SIZE)
ORDER BY RELATIVE_PERFORMANCE_COST DESC
LIMIT 200
;
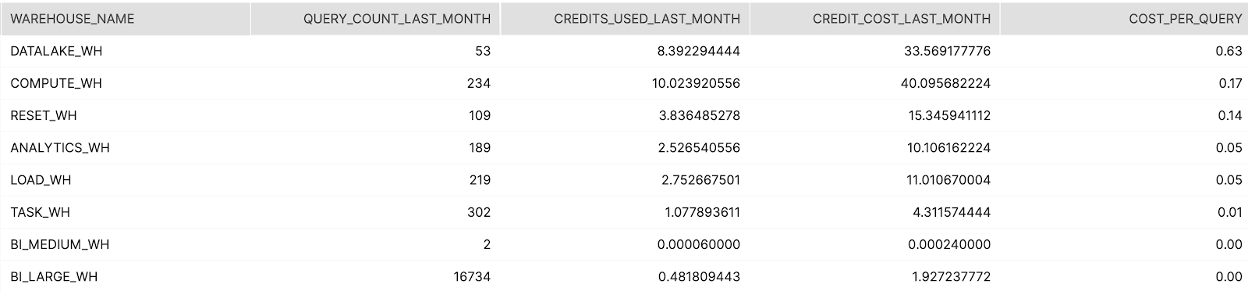
Average Cost per Query by Warehouse (T2)
Tier 2
Description:
This summarize the query activity and credit consumption per warehouse over the last month. The query also includes the ratio of queries executed to credits consumed on the warehouse
How to Interpret Results:
Highlights any scenarios where warehouse consumption is significantly out of line with the number of queries executed. Maybe auto-suspend needs to be adjusted or warehouses need to be consolidated.
Primary Schema:
Account_Usage
SQL
set credit_price = 4;  --edit this value to reflect your credit price

SELECT
    COALESCE(WC.WAREHOUSE_NAME,QC.WAREHOUSE_NAME) AS WAREHOUSE_NAME
    ,QC.QUERY_COUNT_LAST_MONTH
    ,WC.CREDITS_USED_LAST_MONTH
    ,WC.CREDIT_COST_LAST_MONTH
    ,CAST((WC.CREDIT_COST_LAST_MONTH / QC.QUERY_COUNT_LAST_MONTH) AS decimal(10,2) ) AS COST_PER_QUERY

FROM (
    SELECT
       WAREHOUSE_NAME
      ,COUNT(QUERY_ID) as QUERY_COUNT_LAST_MONTH
    FROM SNOWFLAKE.ACCOUNT_USAGE.QUERY_HISTORY
    WHERE TO_DATE(START_TIME) >= TO_DATE(DATEADD(month,-1,CURRENT_TIMESTAMP()))
    GROUP BY WAREHOUSE_NAME
      ) QC
JOIN (

    SELECT
        WAREHOUSE_NAME
        ,SUM(CREDITS_USED) as CREDITS_USED_LAST_MONTH
        ,SUM(CREDITS_USED)*($CREDIT_PRICE) as CREDIT_COST_LAST_MONTH
    FROM SNOWFLAKE.ACCOUNT_USAGE.WAREHOUSE_METERING_HISTORY
    WHERE TO_DATE(START_TIME) >= TO_DATE(DATEADD(month,-1,CURRENT_TIMESTAMP()))
    GROUP BY WAREHOUSE_NAME
  ) WC
    ON WC.WAREHOUSE_NAME = QC.WAREHOUSE_NAME

ORDER BY COST_PER_QUERY DESC
;
Screenshot
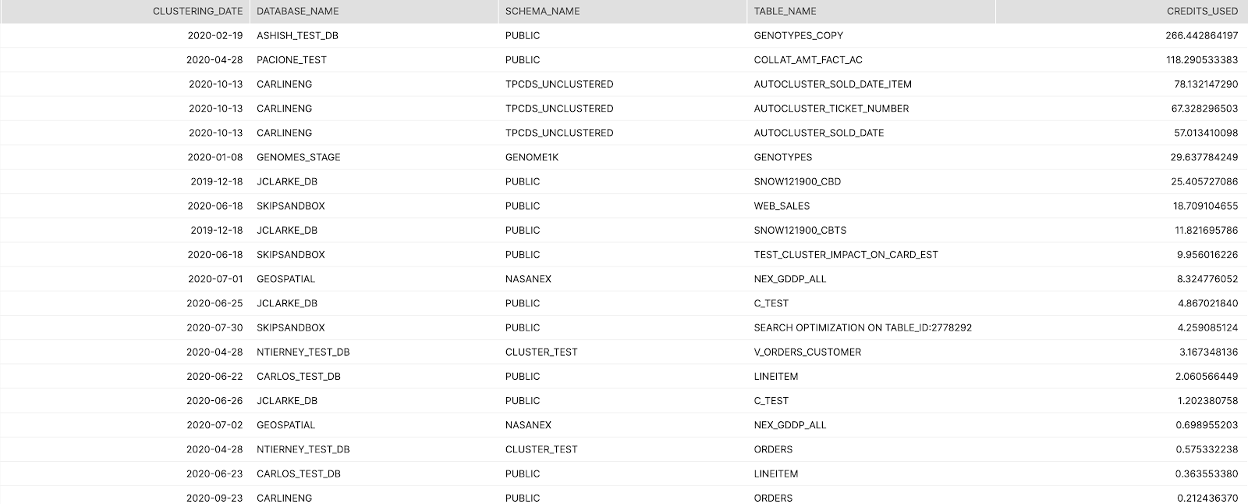
AutoClustering Cost History (by Day by Object) (T3)
Tier 3
Description:
Full list of tables with auto-clustering and the volume of credits consumed via the service over the last 30 days, broken out by day.
How to Interpret Results:
Look for irregularities in the credit consumption or consistently high consumption
Primary Schema:
Account_Usage
SQL
SELECT TO_DATE(START_TIME) as DATE
,DATABASE_NAME
,SCHEMA_NAME
,TABLE_NAME
,SUM(CREDITS_USED) as CREDITS_USED


FROM "SNOWFLAKE"."ACCOUNT_USAGE"."AUTOMATIC_CLUSTERING_HISTORY"

WHERE START_TIME >= dateadd(month,-1,current_timestamp())
GROUP BY 1,2,3,4
ORDER BY 5 DESC
;
Screenshot
Materialized Views Cost History (by Day by Object) (T3)
Tier 3
Description:
Full list of materialized views and the volume of credits consumed via the service over the last 30 days, broken out by day.
How to Interpret Results:
Look for irregularities in the credit consumption or consistently high consumption
Primary Schema:
Account_Usage
SQL
SELECT

TO_DATE(START_TIME) as DATE
,DATABASE_NAME
,SCHEMA_NAME
,TABLE_NAME
,SUM(CREDITS_USED) as CREDITS_USED

FROM "SNOWFLAKE"."ACCOUNT_USAGE"."MATERIALIZED_VIEW_REFRESH_HISTORY"

WHERE START_TIME >= dateadd(month,-1,current_timestamp())
GROUP BY 1,2,3,4
ORDER BY 5 DESC
;
Search Optimization Cost History (by Day by Object) (T3)
Tier 3
Description:
Full list of tables with search optimization and the volume of credits consumed via the service over the last 30 days, broken out by day.
How to Interpret Results:
Look for irregularities in the credit consumption or consistently high consumption
Primary Schema:
Account_Usage
SQL
SELECT

TO_DATE(START_TIME) as DATE
,DATABASE_NAME
,SCHEMA_NAME
,TABLE_NAME
,SUM(CREDITS_USED) as CREDITS_USED

FROM "SNOWFLAKE"."ACCOUNT_USAGE"."SEARCH_OPTIMIZATION_HISTORY"

WHERE START_TIME >= dateadd(month,-1,current_timestamp())
GROUP BY 1,2,3,4
ORDER BY 5 DESC
;
Snowpipe Cost History (by Day by Object) (T3)
Tier 3
Description:
Full list of pipes and the volume of credits consumed via the service over the last 30 days, broken out by day.
How to Interpret Results:
Look for irregularities in the credit consumption or consistently high consumption
Primary Schema:
Account_Usage
SQL
SELECT

TO_DATE(START_TIME) as DATE
,PIPE_NAME
,SUM(CREDITS_USED) as CREDITS_USED

FROM "SNOWFLAKE"."ACCOUNT_USAGE"."PIPE_USAGE_HISTORY"

WHERE START_TIME >= dateadd(month,-1,current_timestamp())
GROUP BY 1,2
ORDER BY 3 DESC
;
Replication Cost History (by Day by Object) (T3)
Tier 3
Description:
Full list of replicated databases and the volume of credits consumed via the replication service over the last 30 days, broken out by day.
How to Interpret Results:
Look for irregularities in the credit consumption or consistently high consumption
Primary Schema:
Account_Usage
SQL
SELECT
TO_DATE(START_TIME) as DATE
,DATABASE_NAME
,SUM(CREDITS_USED) as CREDITS_USED
FROM "SNOWFLAKE"."ACCOUNT_USAGE"."REPLICATION_USAGE_HISTORY"
WHERE START_TIME >= dateadd(month,-1,current_timestamp())
GROUP BY 1,2
ORDER BY 3 DESC
;
This content is provided as is, and is not maintained on an ongoing basis. It may be out of date with current Snowflake instances