Comprehensive Guide to Snowpark Connect for Apache Spark™
Overview
Snowpark Connect lets you use the PySpark DataFrame API in Snowflake. Through this comprehensive guide, you will learn how Snowpark Connect executes PySpark jobs on Snowflake infrastructure and how to build production-ready pipelines.
What You'll Learn
By the end of this quickstart, you will learn how to:
- Understand how Snowpark Connect translates PySpark code into Snowflake-native operations
- Connect to the Snowpark Connect server and initialize a Spark session
- Ingest data from tables, stages, and cloud storage
- Apply transformations, joins, and aggregations using PySpark DataFrame API
- Validate data quality throughout your pipeline
- Write output with partitioning and compression options
- Implement telemetry and best practices for production pipelines
What is Snowpark?
Snowpark is the set of libraries and code execution environments that run Python and other programming languages next to your data in Snowflake. Snowpark can be used to build data pipelines, ML models, apps, and other data processing tasks.
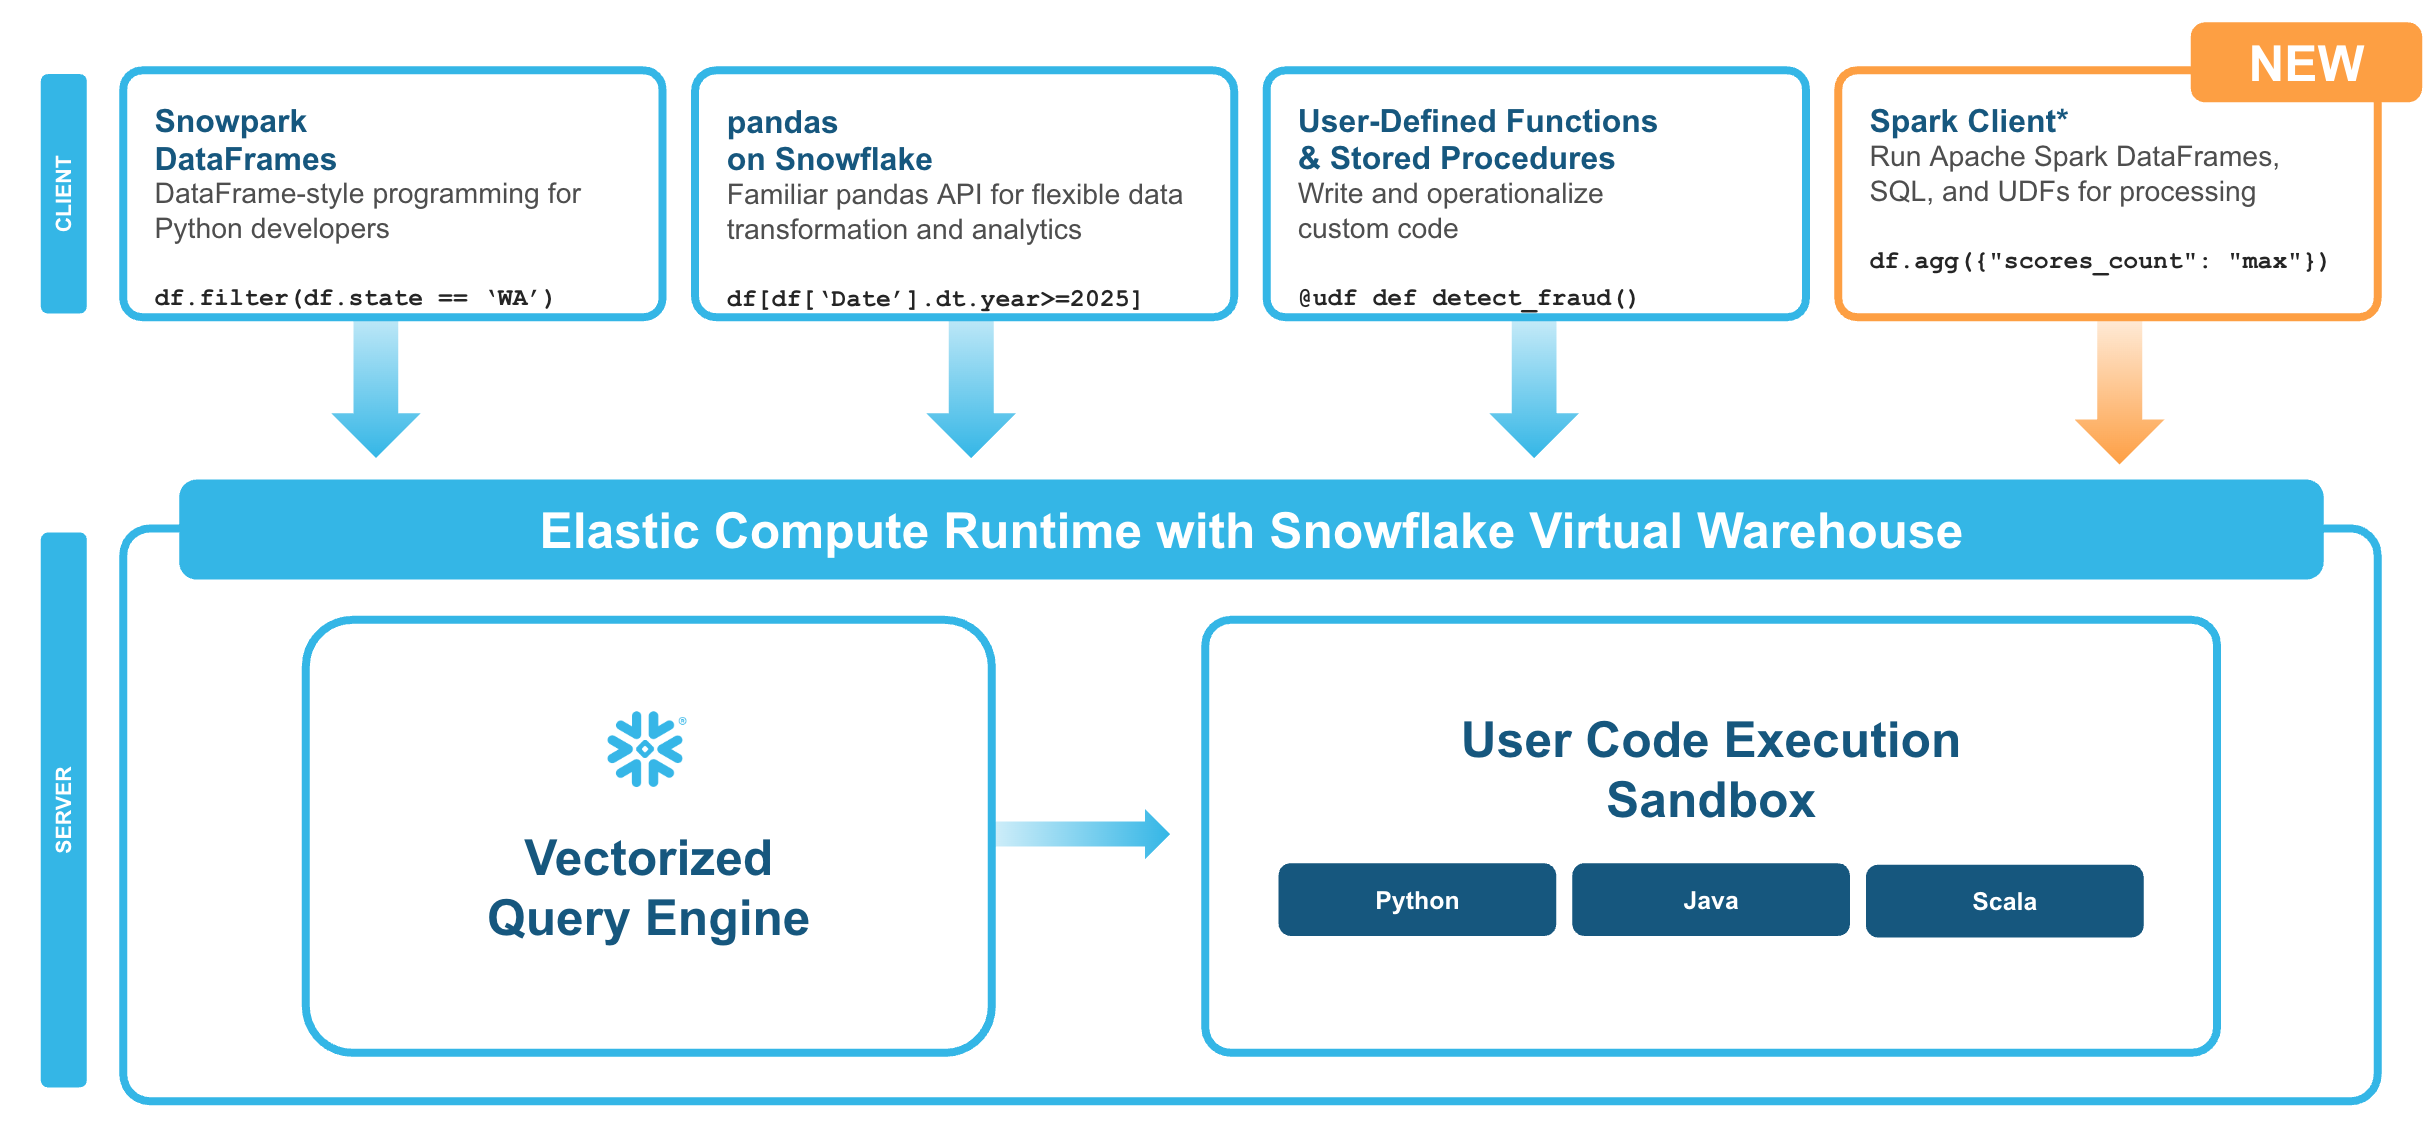
What is Snowpark Connect for Apache Spark™?
With Snowpark Connect for Apache Spark, you can connect your existing Spark workloads directly to Snowflake and run them on the Snowflake compute engine. Snowpark Connect for Spark supports using the Spark DataFrame API on Snowflake. All workloads run on Snowflake warehouse. As a result, you can run your PySpark dataframe code with all the benefits of the Snowflake engine.
In Apache Spark™ version 3.4, the Apache Spark community introduced Spark Connect. Its decoupled client-server architecture separates the user's code from the Spark cluster where the work is done. This new architecture makes it possible for Snowflake to power Spark jobs.
Key Concepts
Execution model:
- Your DataFrame operations are translated to Snowflake SQL
- Computation happens in Snowflake warehouses
- Results stream back via Apache Arrow format
- No Spark cluster, driver, or executors required
Query pushdown:
- ✅ Fully optimized: DataFrame operations, SQL functions, aggregations push down to Snowflake
- ⚠️ Performance impact: Python UDFs run client-side (fetch data → process → send back)
- 💡 Better alternative: Use built-in SQL functions instead of UDFs
What You'll Build
A production-ready menu analytics pipeline for Tasty Bytes (a fictitious global food truck network) that demonstrates:
- Data ingestion from external stages
- Data validation and quality checks
- Profit calculations and categorization
- Brand-level aggregations
- Output with telemetry and metrics tracking
Prerequisites
- A Snowflake account. If you do not have a Snowflake account, you can register for a free trial account.
- Basic familiarity with Python and PySpark concepts
Pipeline Overview
The demo pipeline follows these eight steps from setup to summary:
- Setup & Configuration - Initialize sessions and define pipeline parameters
- Telemetry Initialization - Set up logging and metrics tracking
- Data Ingestion - Load data from stages into Spark DataFrames
- Data Validation - Verify data quality before processing
- Transformations - Apply business logic and profit analysis
- Data Quality Checks - Validate output before writing
- Write Output - Save results to Snowflake tables
- Cleanup & Summary - Release resources and report metrics
Step 1: Initialize Session
First, import the necessary packages and initialize your Spark session.
🛑 Before proceeding, select "snowpark-connect" from the "Packages" dropdown in your Snowflake Notebook.
# =============================================================================
# STEP 0: INITIALIZE SESSION
# =============================================================================

# import packages - select "snowpark_connect" from the packages dropdown
from snowflake import snowpark_connect
from snowflake.snowpark.context import get_active_session

# initialize session
session = get_active_session()
session.sql("USE ROLE SNOWFLAKE_LEARNING_ROLE").collect()
spark = snowpark_connect.server.init_spark_session()

# print session info
print(session)
Step 2: Setup and Configuration
Define your pipeline configuration using a dataclass for type-safe, centralized settings.
# =============================================================================
# STEP 1: SETUP & CONFIGURATION
# =============================================================================

import os
import uuid
import logging
from datetime import datetime
from dataclasses import dataclass
from typing import Optional, List

from pyspark.sql import DataFrame
from pyspark.sql.functions import (
    col, lit, when, coalesce, trim, upper,
    sum, avg, count, min, max, countDistinct,
    current_timestamp, round
)

# --- Configuration for Tasty Bytes Menu Pipeline ---
@dataclass
class PipelineConfig:
    """Centralized configuration for the menu analytics pipeline."""

    # Pipeline metadata
    pipeline_name: str = "tastybytes_menu_analytics"
    pipeline_version: str = "1.0.0"
    environment: str = os.getenv("ENVIRONMENT", "dev")

    # Snowflake context
    role: str = "SNOWFLAKE_LEARNING_ROLE"
    warehouse: str = "SNOWFLAKE_LEARNING_WH"
    database: str = "SNOWFLAKE_LEARNING_DB"

    # Source configuration
    stage_url: str = "s3://sfquickstarts/tastybytes/"
    stage_path: str = "@blob_stage/raw_pos/menu/"
    source_table: str = "MENU_RAW"

    # Output configuration
    output_table: str = "MENU_BRAND_SUMMARY"
    output_mode: str = "overwrite"

    # Quality thresholds
    min_expected_rows: int = 50
    max_expected_rows: int = 10_000
    max_null_percentage: float = 0.05
    min_profit_margin: float = 0.0  # No negative margins allowed

config = PipelineConfig()

# --- Initialize sessions ---
# Note: session and spark should already be initialized
print(f"🚀 Pipeline: {config.pipeline_name} v{config.pipeline_version}")
print(f"📍 Environment: {config.environment}")
Step 3: Telemetry Initialization
Set up logging and metrics tracking for observability.
# =============================================================================
# STEP 2: TELEMETRY INITIALIZATION
# =============================================================================

logging.basicConfig(
    level=logging.INFO,
    format="%(asctime)s | %(levelname)s | %(message)s",
    datefmt="%Y-%m-%d %H:%M:%S"
)
logger = logging.getLogger(config.pipeline_name)

@dataclass
class PipelineMetrics:
    """Track metrics throughout pipeline execution."""
    run_id: str
    start_time: datetime
    end_time: Optional[datetime] = None
    status: str = "running"

    # Stage metrics
    rows_ingested: int = 0
    rows_after_validation: int = 0
    rows_after_transform: int = 0
    rows_written: int = 0

    # Business metrics
    total_menu_items: int = 0
    total_brands: int = 0
    avg_profit_margin: float = 0.0

    # Quality metrics
    validation_passed: bool = False
    quality_score: float = 0.0
    warnings: List[str] = None

    def __post_init__(self):
        self.warnings = self.warnings or []

    def add_warning(self, message: str):
        self.warnings.append(message)
        logger.warning(f"⚠️  {message}")

    def duration_seconds(self) -> float:
        end = self.end_time or datetime.now()
        return (end - self.start_time).total_seconds()

metrics = PipelineMetrics(
    run_id=str(uuid.uuid4())[:8],
    start_time=datetime.now()
)

logger.info(f"{'='*60}")
logger.info(f"🚀 PIPELINE START | Run ID: {metrics.run_id}")
logger.info(f"{'='*60}")

print(f"📊 Telemetry initialized | Run ID: {metrics.run_id}")
Step 4: Data Ingestion
Load data from Snowflake stages into Spark DataFrames.
# =============================================================================
# STEP 3: DATA INGESTION
# =============================================================================

def setup_snowflake_context(session, config: PipelineConfig) -> str:
    """Set up Snowflake role, warehouse, database, and schema."""
    logger.info("Setting up Snowflake context...")

    session.sql(f"USE ROLE {config.role}").collect()
    session.sql(f"USE WAREHOUSE {config.warehouse}").collect()
    session.sql(f"USE DATABASE {config.database}").collect()

    # Create user-specific schema
    current_user = session.sql("SELECT current_user()").collect()[0][0]
    schema_name = f"{current_user}_INTRO_TO_SNOWPARK_CONNECT"
    session.sql(f"CREATE SCHEMA IF NOT EXISTS {schema_name}").collect()
    session.sql(f"USE SCHEMA {schema_name}").collect()

    logger.info(f"  Context: {config.database}.{schema_name}")
    return schema_name

def create_stage_and_table(session, config: PipelineConfig):
    """Create external stage and target table."""
    logger.info("Creating stage and table...")

    # Create stage for S3 access
    session.sql(f"""
        CREATE OR REPLACE STAGE blob_stage
        URL = '{config.stage_url}'
        FILE_FORMAT = (TYPE = CSV)
    """).collect()

    # Create raw table with proper schema
    session.sql(f"""
        CREATE OR REPLACE TABLE {config.source_table} (
            MENU_ID NUMBER(19,0),
            MENU_TYPE_ID NUMBER(38,0),
            MENU_TYPE VARCHAR,
            TRUCK_BRAND_NAME VARCHAR,
            MENU_ITEM_ID NUMBER(38,0),
            MENU_ITEM_NAME VARCHAR,
            ITEM_CATEGORY VARCHAR,
            ITEM_SUBCATEGORY VARCHAR,
            COST_OF_GOODS_USD NUMBER(38,4),
            SALE_PRICE_USD NUMBER(38,4),
            MENU_ITEM_HEALTH_METRICS_OBJ VARIANT
        )
    """).collect()

    logger.info("  ✓ Stage and table created")

def load_data_from_stage(session, config: PipelineConfig) -> int:
    """Load CSV data using COPY INTO."""
    logger.info(f"Loading data from: {config.stage_path}")

    result = session.sql(f"""
        COPY INTO {config.source_table}
        FROM {config.stage_path}
    """).collect()

    # Get loaded row count
    count_result = session.sql(f"SELECT COUNT(*) FROM {config.source_table}").collect()
    row_count = count_result[0][0]

    logger.info(f"  ✓ Loaded {row_count:,} rows")
    return row_count

# Execute ingestion
logger.info("STEP 3: Data Ingestion")
schema_name = setup_snowflake_context(session, config)
create_stage_and_table(session, config)
metrics.rows_ingested = load_data_from_stage(session, config)

# Read into Spark DataFrame for processing
df_raw = spark.read.table(config.source_table)
logger.info(f"  ✓ DataFrame created with {len(df_raw.columns)} columns")

print(f"✅ Data ingestion complete: {metrics.rows_ingested:,} rows loaded into {config.source_table}")
Data Ingestion Methods Reference
Beyond the pipeline example above, here are additional ways to load data into Spark DataFrames.
Read from Snowflake Tables
Query existing tables directly or use SQL for filtered reads.
df = spark.read.table("MY_DATABASE.MY_SCHEMA.MY_TABLE")
df = spark.sql("SELECT * FROM MY_TABLE WHERE status = 'active' LIMIT 1000")
Read from Snowflake Stages
Load files directly from internal or external stages in various formats.
# parquet
df = spark.read.parquet("@MY_STAGE/path/to/data.parquet")
# CSV
df = spark.read.format("csv") \
    .option("header", True) \
    .option("inferSchema", False) \
    .option("delimiter", ",") \
    .option("quote", '"') \
    .option("escape", "\\") \
    .option("nullValue", "") \
    .option("dateFormat", "yyyy-MM-dd") \
    .load("@MY_STAGE/path/to/data.csv")
# JSON
df = spark.read.format("json") \
    .option("multiLine", True) \
    .option("allowComments", True) \
    .option("dateFormat", "yyyy-MM-dd") \
    .load("@MY_STAGE/path/to/data.json")
Direct Cloud Storage Access
Read from S3, GCS, or Azure Blob Storage when you have the appropriate credentials configured.
# S3
df = spark.read.parquet("s3://my-bucket/path/to/data/")
# GCP
df = spark.read.parquet("gs://my-bucket/path/to/data/")
# Azure
df = spark.read.parquet("wasbs://[email protected]/path/to/data/")
Read Multiple Files
Use wildcards and recursive options to load data from multiple files at once.
# Wildcard pattern - Match all parquet files in a directory
df = spark.read.parquet("@MY_STAGE/data/*.parquet")

# Match files with a naming pattern
df = spark.read.csv("@MY_STAGE/logs/2024-*/events_*.csv")

# Recursive directory search
df = spark.read.option("recursiveFileLookup", True).parquet("@MY_STAGE/nested_data/")
Handling Large CSVs
Optimize CSV reads by defining schemas explicitly and converting to Parquet for repeated access.
❌ Slow pattern - Scans entire file just to guess column types:
df = spark.read.format("csv") \
    .option("header", True) \
    .option("inferSchema", True) \
    .load("@MY_STAGE/large_file.csv")
✅ Fast pattern - Define schema explicitly:
from pyspark.sql.types import StructType, StructField, StringType, IntegerType, DoubleType, TimestampType, BooleanType

schema = StructType([
    StructField("id", IntegerType(), False),
    StructField("name", StringType(), True),
    StructField("amount", DoubleType(), True),
    StructField("created_at", TimestampType(), True),
    StructField("is_active", BooleanType(), True)
])

df = spark.read.format("csv") \
    .option("header", True) \
    .schema(schema) \
    .load("@MY_STAGE/large_file.csv")
✅ Compressed files - Auto-decompressed on read:
df = spark.read.format("csv") \
    .option("header", True) \
    .schema(schema) \
    .load("@MY_STAGE/data.csv.gz")
✅ Best practice - Convert CSV to Parquet:
# Read CSV once
df_csv = spark.read.format("csv") \
    .option("header", True) \
    .schema(schema) \
    .load("@MY_STAGE/raw.csv")

# Write as Parquet
df_csv.write.mode("overwrite").parquet("@MY_STAGE/optimized/data.parquet")

# Read from Parquet for all future queries
df = spark.read.parquet("@MY_STAGE/optimized/data.parquet")
Step 5: Data Validation
Validate menu data before processing.
# =============================================================================
# STEP 4: DATA VALIDATION
# =============================================================================

class ValidationError(Exception):
    """Raised when critical validation fails."""
    pass

def validate_menu_data(
    df: DataFrame,
    config: PipelineConfig,
    metrics: PipelineMetrics
) -> DataFrame:
    """
    Validate menu data before processing.

    Checks:
    - Row count within expected range
    - Required columns present
    - No nulls in key columns
    - No duplicate menu items
    - Prices are positive
    """
    logger.info("STEP 4: Data Validation")
    errors = []
    row_count = metrics.rows_ingested

    # Check 1: Row count bounds
    if row_count < config.min_expected_rows:
        errors.append(f"Row count {row_count:,} below minimum {config.min_expected_rows:,}")
    if row_count > config.max_expected_rows:
        errors.append(f"Row count {row_count:,} exceeds maximum {config.max_expected_rows:,}")
    else:
        logger.info(f"  ✓ Row count ({row_count:,}) within bounds")

    # Check 2: Required columns
    required = ["MENU_ITEM_ID", "MENU_ITEM_NAME", "TRUCK_BRAND_NAME",
                "COST_OF_GOODS_USD", "SALE_PRICE_USD"]
    missing = [c for c in required if c not in df.columns]
    if missing:
        errors.append(f"Missing required columns: {missing}")
    else:
        logger.info(f"  ✓ All {len(required)} required columns present")

    # Check 3: Null check on key columns
    key_columns = ["MENU_ITEM_ID", "MENU_ITEM_NAME", "COST_OF_GOODS_USD", "SALE_PRICE_USD"]
    for col_name in key_columns:
        null_count = df.filter(col(col_name).isNull()).count()
        null_pct = null_count / row_count if row_count > 0 else 0
        if null_pct > config.max_null_percentage:
            errors.append(f"Column '{col_name}' has {null_pct:.1%} nulls")
        elif null_pct > 0:
            metrics.add_warning(f"Column '{col_name}' has {null_pct:.1%} nulls")

    if not any("nulls" in str(e) for e in errors):
        logger.info("  ✓ Null check passed")

    # Check 4: No duplicate menu items
    unique_items = df.select("MENU_ITEM_ID").distinct().count()
    if unique_items < row_count:
        duplicates = row_count - unique_items
        metrics.add_warning(f"Found {duplicates:,} duplicate menu items")
    else:
        logger.info("  ✓ No duplicate menu items")

    # Check 5: Positive prices
    negative_prices = df.filter(
        (col("COST_OF_GOODS_USD") < 0) | (col("SALE_PRICE_USD") < 0)
    ).count()
    if negative_prices > 0:
        errors.append(f"Found {negative_prices:,} items with negative prices")
    else:
        logger.info("  ✓ All prices are positive")

    # Handle validation results
    if errors:
        for error in errors:
            logger.error(f"  ✗ VALIDATION FAILED: {error}")
        raise ValidationError(f"Validation failed with {len(errors)} error(s)")

    metrics.validation_passed = True
    metrics.rows_after_validation = row_count
    logger.info("  ✅ Validation PASSED")

    return df

# Execute validation
df_validated = validate_menu_data(df_raw, config, metrics)

print(f"✅ Validation complete: {metrics.rows_after_validation:,} rows passed all checks")
Feature Support Matrix
Understanding what PySpark features are supported helps you write efficient code.
✅ Fully Supported DataFrame Operations
select,filter,wheregroupBy,agg(all aggregation functions)join(inner, left, right, outer, broadcast)orderBy,sortdistinct,dropDuplicates- Window functions (
row_number,rank,lag,lead, etc.) - Built-in functions (95%+ coverage)
cache,persist(creates temp tables in Snowflake)
⚠️ Limited Support
repartition(logical operation only)coalesce(similar to repartition)- Python UDFs (work but slow - avoid if possible)
- Pandas UDFs (work but slow - avoid if possible)
- MLlib (partial - transformers work, estimators limited)
❌ Not Supported
- RDD API completely
.rdd,.foreach(),.foreachPartition()- Structured Streaming
- GraphX
- Custom data sources
.checkpoint()
Data Types Support
✅ Supported:
- String, Integer, Long, Float, Double, Decimal
- Boolean, Date, Timestamp
- Array, Map, Struct
- Binary
❌ Not Supported:
- DayTimeIntervalType
- YearMonthIntervalType
- UserDefinedTypes
Supported File Formats
- ✅ Parquet, CSV, JSON, Avro, ORC
- ❌ Delta Lake, Hudi not supported
Step 6: Transformations
Apply business transformations to menu data.
# =============================================================================
# STEP 5: TRANSFORMATIONS
# =============================================================================

def transform_menu_data(
    df: DataFrame,
    metrics: PipelineMetrics
) -> DataFrame:
    """
    Apply business transformations to menu data.

    Stages:
    5A. Data Cleaning
    5B. Profit Calculations
    5C. Categorization
    5D. Aggregation by Brand
    """
    logger.info("STEP 5: Transformations")

    # -------------------------------------------------------------------------
    # STAGE 5A: Data Cleaning
    # -------------------------------------------------------------------------
    logger.info("  5A: Data Cleaning")

    df_clean = df \
        .withColumn("TRUCK_BRAND_NAME", trim(upper(col("TRUCK_BRAND_NAME")))) \
        .withColumn("ITEM_CATEGORY", trim(upper(col("ITEM_CATEGORY")))) \
        .withColumn("MENU_TYPE", trim(upper(col("MENU_TYPE")))) \
        .filter(col("COST_OF_GOODS_USD").isNotNull()) \
        .filter(col("SALE_PRICE_USD").isNotNull())

    # -------------------------------------------------------------------------
    # STAGE 5B: Profit Calculations
    # -------------------------------------------------------------------------
    logger.info("  5B: Profit Calculations")

    df_with_profit = df_clean \
        .withColumn(
            "PROFIT_USD",
            round(col("SALE_PRICE_USD") - col("COST_OF_GOODS_USD"), 2)
        ) \
        .withColumn(
            "PROFIT_MARGIN_PCT",
            round(
                (col("SALE_PRICE_USD") - col("COST_OF_GOODS_USD")) /
                col("SALE_PRICE_USD") * 100,
                2
            )
        )

    # -------------------------------------------------------------------------
    # STAGE 5C: Categorization
    # -------------------------------------------------------------------------
    logger.info("  5C: Profit Categorization")

    df_categorized = df_with_profit \
        .withColumn(
            "PROFIT_TIER",
            when(col("PROFIT_MARGIN_PCT") >= 70, "Premium")
            .when(col("PROFIT_MARGIN_PCT") >= 50, "High")
            .when(col("PROFIT_MARGIN_PCT") >= 30, "Medium")
            .otherwise("Low")
        ) \
        .withColumn(
            "PRICE_TIER",
            when(col("SALE_PRICE_USD") >= 10, "Premium")
            .when(col("SALE_PRICE_USD") >= 5, "Mid-Range")
            .otherwise("Value")
        )

    # -------------------------------------------------------------------------
    # STAGE 5D: Aggregation by Brand
    # -------------------------------------------------------------------------
    logger.info("  5D: Aggregation by Brand")

    df_brand_summary = df_categorized.groupBy(
        "TRUCK_BRAND_NAME",
        "MENU_TYPE"
    ).agg(
        count("*").alias("ITEM_COUNT"),
        round(avg("COST_OF_GOODS_USD"), 2).alias("AVG_COST_USD"),
        round(avg("SALE_PRICE_USD"), 2).alias("AVG_PRICE_USD"),
        round(avg("PROFIT_USD"), 2).alias("AVG_PROFIT_USD"),
        round(avg("PROFIT_MARGIN_PCT"), 2).alias("AVG_MARGIN_PCT"),
        round(min("PROFIT_USD"), 2).alias("MIN_PROFIT_USD"),
        round(max("PROFIT_USD"), 2).alias("MAX_PROFIT_USD"),
        round(sum("PROFIT_USD"), 2).alias("TOTAL_POTENTIAL_PROFIT_USD")
    ).orderBy(col("AVG_MARGIN_PCT").desc())

    # Add metadata
    df_final = df_brand_summary \
        .withColumn("PIPELINE_RUN_ID", lit(metrics.run_id)) \
        .withColumn("PROCESSED_AT", current_timestamp())

    # Update metrics
    metrics.rows_after_transform = df_final.count()
    metrics.total_brands = df_final.select("TRUCK_BRAND_NAME").distinct().count()
    metrics.total_menu_items = df_categorized.count()

    # Calculate overall average margin
    avg_margin = df_final.agg(avg("AVG_MARGIN_PCT")).collect()[0][0]
    metrics.avg_profit_margin = float(avg_margin) if avg_margin else 0.0

    logger.info(f"  ✓ Aggregated to {metrics.rows_after_transform:,} brand/menu-type combinations")
    logger.info(f"  ✓ {metrics.total_brands} unique brands analyzed")
    logger.info(f"  ✓ Average profit margin: {metrics.avg_profit_margin:.1f}%")

    return df_final

# Execute transformations
df_transformed = transform_menu_data(df_validated, metrics)
df_transformed.cache()

# Preview results
logger.info("\n📊 Brand Summary Preview:")
df_transformed.select(
    "TRUCK_BRAND_NAME", "MENU_TYPE", "ITEM_COUNT",
    "AVG_PRICE_USD", "AVG_PROFIT_USD", "AVG_MARGIN_PCT"
).show(10, truncate=False)
Transformation API Reference
All transformations push down to Snowflake SQL - no data leaves the warehouse until you explicitly collect results.
Required Imports
Import the functions you'll need for transformations.
from pyspark.sql.functions import (
    col, lit, when, coalesce,
    sum, avg, count, min, max, countDistinct, collect_list,
    year, month, dayofmonth, hour, minute, second, dayofweek, dayofyear, weekofyear, quarter,
    to_date, to_timestamp, date_add, date_sub, months_between, datediff, date_trunc,
    upper, lower, initcap, trim, ltrim, rtrim, lpad, rpad,
    concat, substring, regexp_replace, regexp_extract,
    row_number, rank, dense_rank, percent_rank, lag, lead, first, last,
    broadcast
)
from pyspark.sql.window import Window
1. Selecting and Filtering
Choose columns and filter rows to narrow down your dataset.
Select columns:
df.select("id", "name", "amount")
df.select(col("id"), col("name").alias("customer_name"))  # with rename
Filter rows:
df.filter(col("status") == "active")
df.where(col("amount") > 100)
df.filter((col("status") == "active") & (col("amount") > 100))  # AND
df.filter((col("status") == "active") | (col("amount") > 1000)) # OR
Remove duplicates:
df.distinct()                                    # all columns
df.dropDuplicates(["customer_id", "order_date"]) # specific columns
2. Adding and Modifying Columns
Create new columns, rename existing ones, and handle data type conversions.
Add calculated columns:
df.withColumn("total", col("price") * col("quantity"))
df.withColumn("discounted_price", col("price") * 0.9)
df.withColumn("status_flag", when(col("status") == "active", 1).otherwise(0))
Rename columns:
df.withColumnRenamed("old_name", "new_name")
df.toDF("col1", "col2", "col3")  # rename all at once
Cast data types:
df.withColumn("amount", col("amount").cast("double"))
df.withColumn("event_date", col("timestamp_col").cast("date"))
Handle null values:
df.fillna(0, subset=["amount"])                         # single column
df.fillna({"amount": 0, "name": "Unknown"})             # multiple columns
df.withColumn("value", coalesce(col("value"), lit(0)))  # using coalesce
3. Aggregations
Group data and compute summary statistics like counts, sums, and averages.
Group and aggregate:
df.groupBy("category").agg(
    count("*").alias("row_count"),
    countDistinct("customer_id").alias("unique_customers"),
    sum("amount").alias("total_amount"),
    avg("amount").alias("avg_amount"),
    min("amount").alias("min_amount"),
    max("amount").alias("max_amount"),
    collect_list("product_name").alias("products")
)
Multiple grouping columns:
df.groupBy("category", "region").agg(
    sum("amount").alias("total_sales"),
    avg("amount").alias("average_sale")
)
4. Joins
Combine DataFrames using various join types and optimize with broadcast hints.
| Join Type | Syntax |
|---|---|
| Inner | df1.join(df2, "id", "inner") |
| Left | df1.join(df2, "customer_id", "left") |
| Right | df1.join(df2, "customer_id", "right") |
| Outer | df1.join(df2, "customer_id", "outer") |
| Cross | df1.crossJoin(df2) |
Explicit join condition:
df1.join(df2, df1["id"] == df2["id"], "inner")
Broadcast small tables (performance optimization):
df_large.join(broadcast(df_small), "key_column", "left")
Handle column name conflicts:
df_joined = df1.alias("a").join(df2.alias("b"), col("a.id") == col("b.id"))
df_result = df_joined.select(col("a.id"), col("a.name"), col("b.value"))
5. Window Functions
Perform calculations across rows related to the current row without collapsing the data.
Define window specification:
window_spec = Window.partitionBy("customer_id").orderBy("order_date")

# With frame bounds
window_frame = Window.partitionBy("customer_id") \
    .orderBy("order_date") \
    .rowsBetween(-2, 0)
Ranking functions:
df.withColumn("row_num", row_number().over(window_spec))
df.withColumn("rank", rank().over(window_spec))              # gaps for ties
df.withColumn("dense_rank", dense_rank().over(window_spec))  # no gaps
df.withColumn("pct_rank", percent_rank().over(window_spec))
Analytic functions:
df.withColumn("prev_amount", lag("amount", 1).over(window_spec))
df.withColumn("next_amount", lead("amount", 1).over(window_spec))
df.withColumn("first_order", first("amount").over(window_spec))
df.withColumn("last_order", last("amount").over(window_spec))
Running calculations:
window_running = Window.partitionBy("customer_id") \
    .orderBy("order_date") \
    .rowsBetween(Window.unboundedPreceding, 0)

df.withColumn("running_total", sum("amount").over(window_running))
df.withColumn("running_avg", avg("amount").over(window_running))
6. Date and Time Operations
Extract date parts, parse strings, and perform date arithmetic.
Extract components:
| Function | Example |
|---|---|
year() | df.withColumn("year", year("ts")) |
month() | df.withColumn("month", month("ts")) |
dayofmonth() | df.withColumn("day", dayofmonth("ts")) |
hour() | df.withColumn("hour", hour("ts")) |
dayofweek() | df.withColumn("dow", dayofweek("ts")) |
quarter() | df.withColumn("qtr", quarter("ts")) |
Parse strings to dates:
df.withColumn("date_col", to_date("date_string", "yyyy-MM-dd"))
df.withColumn("ts_col", to_timestamp("ts_string", "yyyy-MM-dd HH:mm:ss"))
Date arithmetic:
df.withColumn("next_week", date_add("date_col", 7))
df.withColumn("last_week", date_sub("date_col", 7))
df.withColumn("days_diff", datediff("end_date", "start_date"))
df.withColumn("months_diff", months_between("end_date", "start_date"))
df.withColumn("month_start", date_trunc("month", "date_col"))
7. String Operations
Transform case, match patterns, and manipulate text data.
Case transformation:
df.withColumn("upper_name", upper("name"))
df.withColumn("lower_name", lower("name"))
df.withColumn("title_name", initcap("name"))
Pattern matching:
df.withColumn("has_email", col("text").contains("@"))
df.withColumn("cleaned", regexp_replace("text", "[^a-zA-Z0-9]", ""))
df.withColumn("domain", regexp_extract("email", "@(.+)$", 1))
Trim and pad:
df.withColumn("trimmed", trim("text"))
df.withColumn("padded_id", lpad("id", 10, "0"))    # "42" → "0000000042"
df.withColumn("padded_right", rpad("code", 5, "X")) # "AB" → "ABXXX"
8. Sorting and Limiting
Order results and restrict output to a subset of rows.
Sort results:
df.orderBy("name")                                            # ascending
df.orderBy(col("amount").desc())                              # descending
df.orderBy(col("category").asc(), col("amount").desc())       # multiple
df.orderBy(col("value").asc_nulls_first())                    # nulls first
df.orderBy(col("value").desc_nulls_last())                    # nulls last
Limit rows:
df.limit(10)                                    # first 10 rows
df.orderBy(col("amount").desc()).limit(10)     # top 10 by amount
Step 7: Data Quality Checks
Validate output data quality before writing.
# =============================================================================
# STEP 6: DATA QUALITY CHECKS
# =============================================================================

def quality_checks(
    df: DataFrame,
    config: PipelineConfig,
    metrics: PipelineMetrics
) -> float:
    """Validate output data quality before writing."""
    logger.info("STEP 6: Data Quality Checks")
    checks_passed = 0
    total_checks = 4

    row_count = metrics.rows_after_transform

    # Check 1: Non-zero output
    if row_count > 0:
        checks_passed += 1
        logger.info(f"  ✓ Output has {row_count:,} rows")
    else:
        logger.error("  ✗ Output is empty!")

    # Check 2: No duplicate keys
    key_cols = ["TRUCK_BRAND_NAME", "MENU_TYPE"]
    distinct_keys = df.select(key_cols).distinct().count()
    if distinct_keys == row_count:
        checks_passed += 1
        logger.info("  ✓ No duplicate brand/menu-type combinations")
    else:
        logger.error(f"  ✗ Found {row_count - distinct_keys:,} duplicate keys")

    # Check 3: All margins are reasonable (not negative)
    negative_margins = df.filter(col("AVG_MARGIN_PCT") < config.min_profit_margin).count()
    if negative_margins == 0:
        checks_passed += 1
        logger.info("  ✓ All profit margins are positive")
    else:
        metrics.add_warning(f"Found {negative_margins:,} brands with negative margins")

    # Check 4: Data completeness
    null_brands = df.filter(col("TRUCK_BRAND_NAME").isNull()).count()
    if null_brands == 0:
        checks_passed += 1
        logger.info("  ✓ All records have brand names")
    else:
        logger.error(f"  ✗ Found {null_brands:,} records without brand names")

    quality_score = checks_passed / total_checks
    logger.info(f"\n  📈 Quality Score: {quality_score:.0%} ({checks_passed}/{total_checks} checks)")

    return quality_score

# Execute quality checks
metrics.quality_score = quality_checks(df_transformed, config, metrics)

print(f"✅ Quality checks complete: {metrics.quality_score:.0%} score")
Step 8: Write Output
Write transformed data to Snowflake tables.
# =============================================================================
# STEP 7: WRITE OUTPUT
# =============================================================================

def write_output(
    df: DataFrame,
    config: PipelineConfig,
    metrics: PipelineMetrics
) -> int:
    """Write transformed data to Snowflake table."""
    logger.info("STEP 7: Write Output")
    logger.info(f"  Destination: {config.output_table}")
    logger.info(f"  Mode: {config.output_mode}")

    # Write to Snowflake
    df.write.mode(config.output_mode).saveAsTable(config.output_table)

    # Verify
    written_count = spark.read.table(config.output_table).count()
    logger.info(f"  ✓ Rows written: {written_count:,}")

    return written_count

# Execute write
metrics.rows_written = write_output(df_transformed, config, metrics)

print(f"✅ Write complete: {metrics.rows_written:,} rows written to {config.output_table}")
Writing Data Reference
Write transformed data back to Snowflake tables, stages, or cloud storage.
Write to Snowflake Tables
Save DataFrames as managed tables with different write modes.
# Overwrite replaces all existing data
df.write.mode("overwrite").saveAsTable("MY_TABLE")

# Append adds new rows to existing data (use for incremental loads)
df.write.mode("append").saveAsTable("MY_TABLE")

# Ignore skips write if destination exists (use for idempotent operations)
df.write.mode("ignore").saveAsTable("MY_TABLE")

# Error fails if destination exists
df.write.mode("error").saveAsTable("MY_TABLE")
Write to Snowflake Stages
Export data to stages in Parquet, CSV, or JSON format.
# Parquet (recommended)
df.write.mode("overwrite").parquet("@MY_STAGE/output/data.parquet")

# CSV
df.write.mode("overwrite") \
    .option("header", True) \
    .option("compression", "gzip") \
    .option("delimiter", ",") \
    .option("quote", '"') \
    .csv("@MY_STAGE/output/data.csv")

# JSON
df.write.mode("overwrite") \
    .option("compression", "gzip") \
    .json("@MY_STAGE/output/data.json")
Write to Cloud Storage
Write directly to S3, GCS, or Azure Blob Storage.
# S3
df.write.mode("overwrite").parquet("s3://my-bucket/output/data/")
# GCP
df.write.mode("overwrite").parquet("gs://my-bucket/output/data/")
# Azure
df.write.mode("overwrite").parquet("wasbs://[email protected]/output/data/")
Performance and Compression
Optimize storage and query performance with partitioning and compression strategies.
Partitioning for Performance
Organize data by key columns to enable faster filtered queries.
# Multi-column partitioning
df.write.mode("overwrite") \
    .partitionBy("year", "month") \
    .parquet("@MY_STAGE/partitioned_data/")


# Single column partitioning
df.write.mode("overwrite") \
    .partitionBy("event_date") \
    .parquet("@MY_STAGE/daily_data/")
Benefits:
- Faster queries that filter on partition columns
- Enables parallel reads of different partitions
- Easier data management (delete old partitions)
Considerations:
- Too many partitions = too many small files
- Choose columns with moderate cardinality
- Date-based partitioning is very common
Compression Options
Choose a compression codec based on your access patterns and storage requirements.
| Compression | Speed | Ratio | Use Case |
|---|---|---|---|
| Snappy | Fast | Moderate | Default for Parquet, frequently accessed data |
| Gzip | Slow | High | Archival, infrequent access |
| LZ4 | Very Fast | Moderate | High-throughput workloads |
| Zstd | Medium | High | Good balance of speed and compression |
| None | N/A | None | Rarely recommended |
# Snappy (default)
df.write.option("compression", "snappy").parquet("@MY_STAGE/data/")

# Gzip
df.write.option("compression", "gzip").parquet("@MY_STAGE/data/")

# LZ4
df.write.option("compression", "lz4").parquet("@MY_STAGE/data/")

# Zstd
df.write.option("compression", "zstd").parquet("@MY_STAGE/data/")

# None
df.write.option("compression", "none").parquet("@MY_STAGE/data/")
Step 9: Cleanup and Summary
Release resources and log final summary.
# =============================================================================
# STEP 8: CLEANUP & SUMMARY
# =============================================================================

def cleanup_and_summarize(df_cached: DataFrame, metrics: PipelineMetrics):
    """Release resources and log final summary."""
    logger.info("STEP 8: Cleanup & Summary")

    # Release cache
    try:
        df_cached.unpersist()
        logger.info("  ✓ Cache released")
    except Exception as e:
        logger.warning(f"  Could not unpersist: {e}")

    # Finalize metrics
    metrics.end_time = datetime.now()
    metrics.status = "SUCCESS" if metrics.quality_score >= 0.75 else "COMPLETED_WITH_WARNINGS"

    # Print summary
    print(f"\n{'='*60}")
    print("🎉 PIPELINE SUMMARY")
    print(f"{'='*60}")
    print(f"  Run ID:            {metrics.run_id}")
    print(f"  Status:            {metrics.status}")
    print(f"  Duration:          {metrics.duration_seconds():.1f} seconds")
    print(f"  {'─'*56}")
    print(f"  Menu Items:        {metrics.total_menu_items:,}")
    print(f"  Brands Analyzed:   {metrics.total_brands}")
    print(f"  Avg Profit Margin: {metrics.avg_profit_margin:.1f}%")
    print(f"  {'─'*56}")
    print(f"  Rows In:           {metrics.rows_ingested:,}")
    print(f"  Rows Out:          {metrics.rows_written:,}")
    print(f"  Quality Score:     {metrics.quality_score:.0%}")

    if metrics.warnings:
        print(f"  {'─'*56}")
        print(f"  ⚠️  Warnings ({len(metrics.warnings)}):")
        for w in metrics.warnings:
            print(f"      • {w}")

    print(f"{'='*60}\n")

# Execute cleanup
cleanup_and_summarize(df_transformed, metrics)
Best Practices
Follow these best practices to get optimal performance from Snowpark Connect.
-
Use SQL functions over UDFs: Python UDFs require data to be transferred to the client, processed, and sent back - this is 10-100x slower than native operations!
-
Broadcast joins for small tables: When joining a large table with a small dimension table, use
broadcast()to optimize the join. -
Cache frequently accessed DataFrames: Caching creates temporary tables in Snowflake for faster repeated access. Remember to
unpersist()when done! -
Minimize data movement: Process data in Snowflake and only transfer final results. Avoid
collect()on large datasets! -
Partition awareness: Filter on partitioned columns to enable partition pruning and reduce data scanned.
Performance Checklist
✅ Use COPY INTO for bulk loading (faster than spark.read for CSV)
✅ Cache DataFrame for multiple operations
✅ Avoid UDFs - use built-in SQL functions
✅ Quality gates before writing output
✅ Type-safe configuration with dataclasses
✅ Proper error handling with custom exceptions
✅ Structured logging at each stage
✅ Unique run ID for tracing
✅ Row counts and business metrics tracked
Conclusion And Resources
Congratulations! You have successfully completed this comprehensive guide to Snowpark Connect for Apache Spark.
What You Learned
- How Snowpark Connect translates PySpark code into Snowflake SQL
- How to initialize Spark sessions connected to Snowflake
- Multiple data ingestion patterns (tables, stages, cloud storage)
- Data validation and quality check strategies
- Transformation techniques including joins, aggregations, and window functions
- Writing data with partitioning and compression options
- Telemetry and metrics tracking for production pipelines
- Best practices for optimal performance
Related Resources
Official Documentation:
Snowpark Submit CLI:
Run Spark workloads as batch jobs using Snowpark Submit CLI.
To install:
pip install snowpark-submit
To submit a job:
snowpark-submit \
  --snowflake-workload-name MY_JOB \
  --snowflake-connection-name MY_CONNECTION \
  --compute-pool MY_COMPUTE_POOL \
  app.py
Additional Resources:
This content is provided as is, and is not maintained on an ongoing basis. It may be out of date with current Snowflake instances