Getting Started with Snowflake Trail for Observability
Overview
Snowflake Trail is Snowflake's suite of observability capabilities that enable its users to better monitor, troubleshoot, debug and take actions on pipelines, apps, user code and compute utilizations.

As you can see above, Snowflake Trail utilizes core observability data — logs, metrics, traces, events, alerts, and notifications — to provide comprehensive workload monitoring across AI, applications, pipelines, and infrastructure.
This quickstart is intended to help tie together all the components of Snowflake Trail, and in turn, help you get started with Observability in Snowflake. While this quickstart will walk you through the basics of enabling and viewing telemetry, you will need to dive deeper into each area in order to fully understand Snowflake Trail. So wherever possible, links will be provided to additional quickstarts, documentation, and resources.
What You'll Learn:
- How to enable telemetry collection in your Snowflake account
- The difference between system views and telemetry data in Snowflake
- How to use the Snowsight monitoring interfaces for traces, logs, and query history
- How to access and understand observability data in Snowflake
What You'll Need:
- A Snowflake account. If you do not have a Snowflake account, you can register for a free trial account.
- A Snowflake account login with the
ACCOUNTADMINrole, or a custom role with privileges to:- Set account-level parameters (
ALTER ACCOUNT) - View and query event tables (
SELECTonSNOWFLAKE.TELEMETRY.*) - Access monitoring features in Snowsight
- Set account-level parameters (
- Basic familiarity with SQL and Snowflake concepts
- About 45 minutes to complete this quickstart
What You'll Build:
- A Snowflake account with telemetry collection enabled at the account level
- Understanding of how to navigate and use Snowflake's built-in monitoring tools
- Foundation for implementing comprehensive observability across your Snowflake workloads
Data Source Overview
Observability in Snowflake comes in two main categories: System Views and Telemetry.
System Views provide historical data about your Snowflake account through views and table functions in the following schemas:
- The Snowflake Information Schema (
INFORMATION_SCHEMA) in every Snowflake database - The Account Usage (
ACCOUNT_USAGEandREADER_ACCOUNT_USAGE) in the Snowflake database - The Organization Usage (
ORGANIZATION_USAGE) in the Snowflake database
Telemetry data, on the other hand, is delivered exclusively through event tables. An event table is a special kind of database table with a predefined set of columns that follows the data model for OpenTelemetry - a leading the industry standard for collecting and structuring observability data across systems.
This distinction is important because of the default behavior of each:
- System Views are always available and automatically populated with data about your Snowflake usage
- Telemetry data requires you to explicitly enable collection by setting levels for logging, metrics, and tracing
Enabling Telemetry
By default, Snowflake includes a predefined event table (SNOWFLAKE.TELEMETRY.EVENTS) that is used if you don't specify an active event table. You can also create your own event tables for specific uses.
Most telemetry levels can be set at the account, object, or session level. And while many of the telemetry levels can be set via Snowsight, some require using SQL commands for full flexibility.
For this quickstart, we will focus on enabling telemetry at the account level. We will show you both the SQL and Snowsight methods, and use the default table.
Complete one of the following:
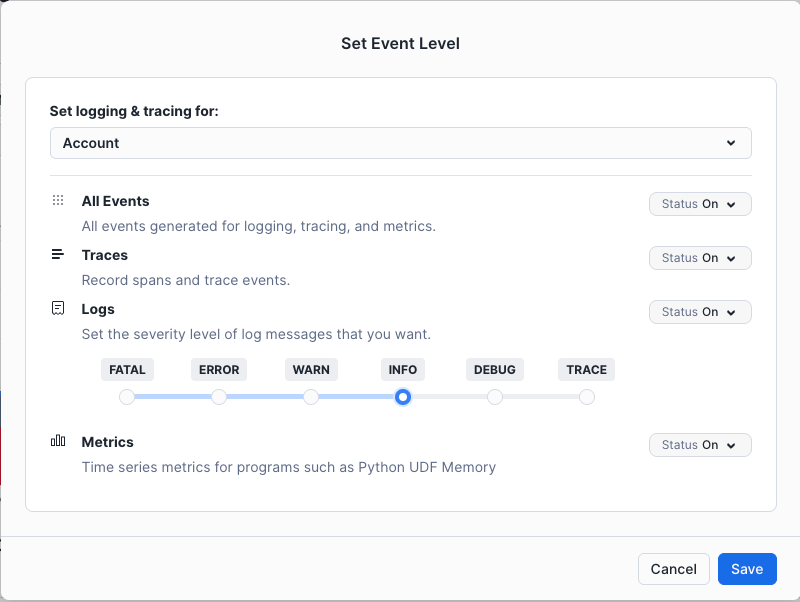
(Option 1): Setting Telemetry Levels via Snowsight
You can use Snowsight to set telemetry levels at the account level.
- Sign in to Snowsight.
- In the navigation menu, select Monitoring » Traces and Logs.
- On the Traces & Logs page, select Set Event Level.
- For Set logging & tracing for, ensure Account is selected.
- Set your desired levels:
- For All Events, select On
- For Logs, select INFO
- Ensure all other fields show as On.
- Click Save.
You can see the Set Event Level dialog box below.
(Option 2): Setting Telemetry Levels via SQL
- Open a new SQL worksheet or a workspace.
- Run the following:
-- Switch to ACCOUNTADMIN
USE ROLE ACCOUNTADMIN;

-- Set account level values
ALTER ACCOUNT SET LOG_LEVEL = 'INFO';
ALTER ACCOUNT SET METRIC_LEVEL = 'ALL';
ALTER ACCOUNT SET TRACE_LEVEL = 'ALWAYS';
Note that valid and default values are as follows:
| Level | Valid Values | Default Value |
|---|---|---|
LOG_LEVEL | TRACE, DEBUG, INFO, WARN, ERROR, FATAL, OFF | OFF |
METRIC_LEVEL | ALL, NONE | NONE |
TRACE_LEVEL | ALWAYS, ON_EVENT, OFF | OFF |
Additional Resources
Traces
A trace represents the complete execution path of a request through your Snowflake workloads. It provides a detailed view of how operations flow through different components, helping you understand performance bottlenecks, dependencies, and execution patterns. Each trace is made up of one or more spans, where each span represents a single operation within the trace (like a SQL query, UDF execution, or procedure call).
Why Traces Are Useful
Traces help you:
- Understand the end-to-end execution flow of complex operations
- Identify performance bottlenecks and slow operations
- Debug issues by seeing the exact sequence of operations
- Optimize query and procedure performance
- Monitor dependencies between different components
Accessing Traces in Snowsight
The easiest way to get started with traces is through the Trace Explorer UI in Snowsight:
- Navigate to Monitoring » Traces and Logs
- (Optional) Use filters to narrow down the returned results.
You'll now have a list of all the traces for your event table. The Trace Explorer interface shows a list of traces with key information such as Date, Duration, Trace Name, Status, and number of Spans in the trace.
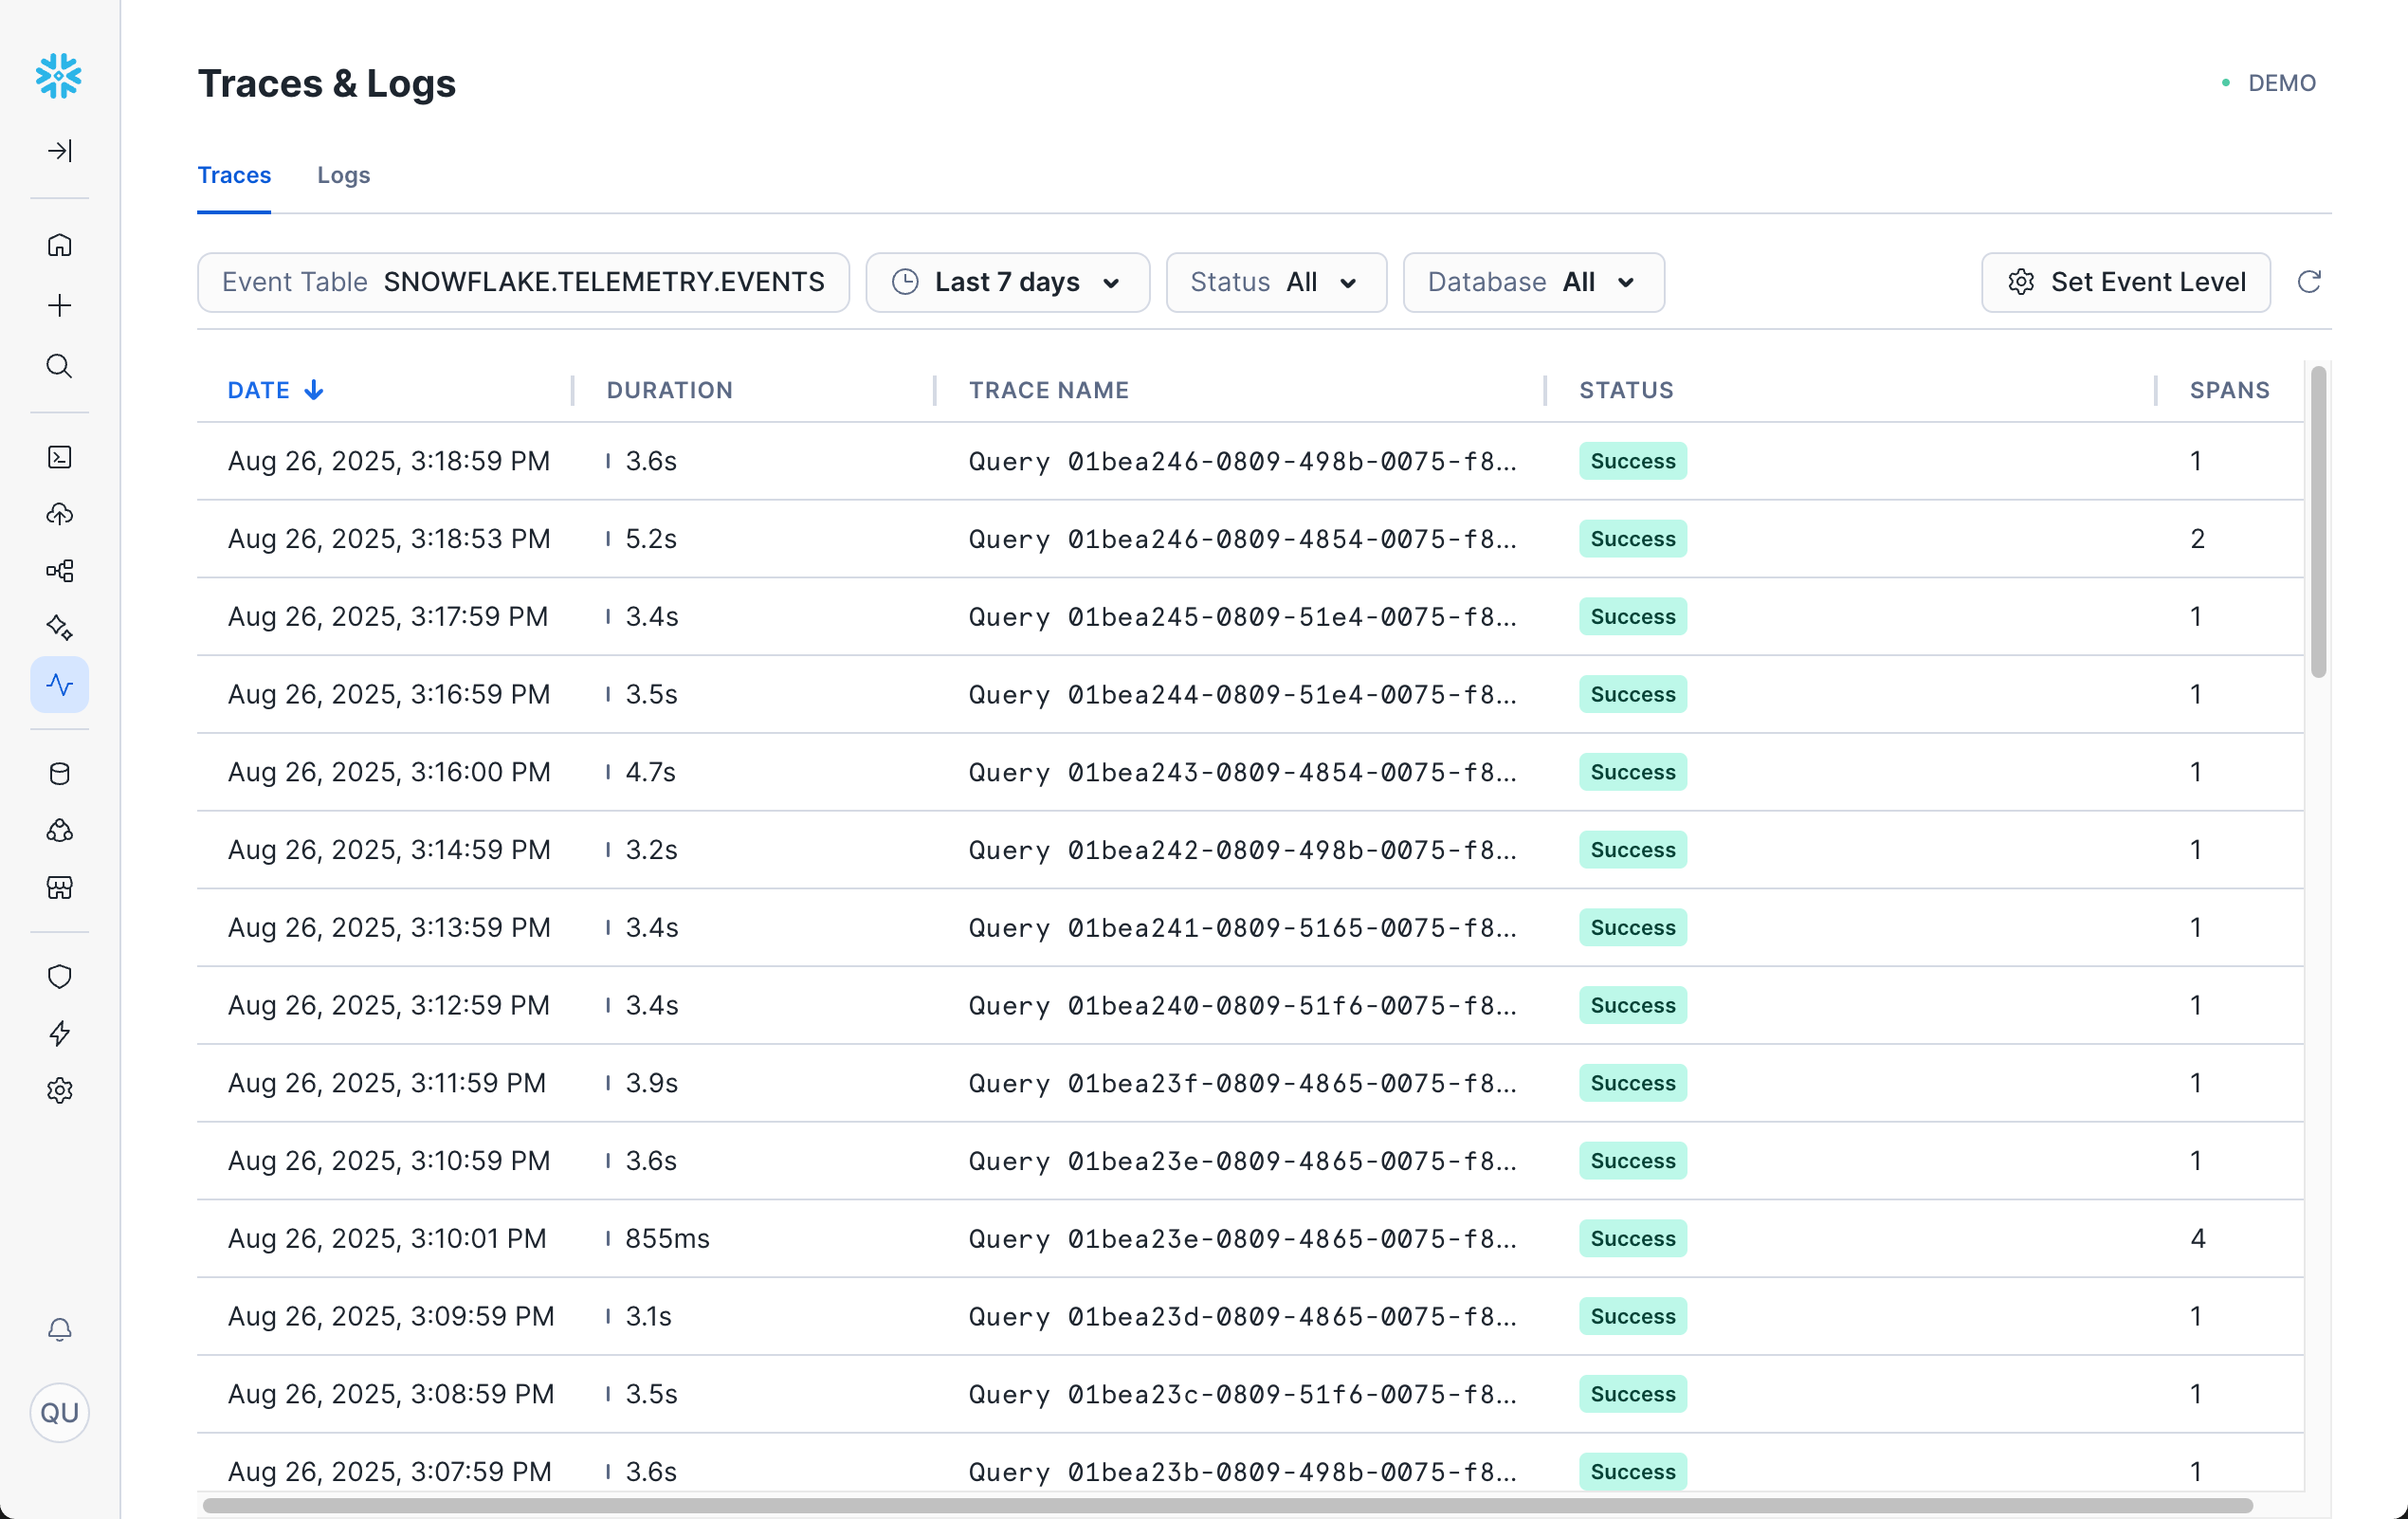
You can now click on any trace to view its spans in detail.
If you don't see any traces after enabling tracing, you'll need to execute operations that generate traces, such as stored procedures or UDFs.
Note that simple DML/DQL SQL commands executed directly in a worksheet or workspace do not generate traces. Traces are only generated when SQL is executed within supported handler code.
For a complete walkthrough with examples, see: Getting Started with Traces.
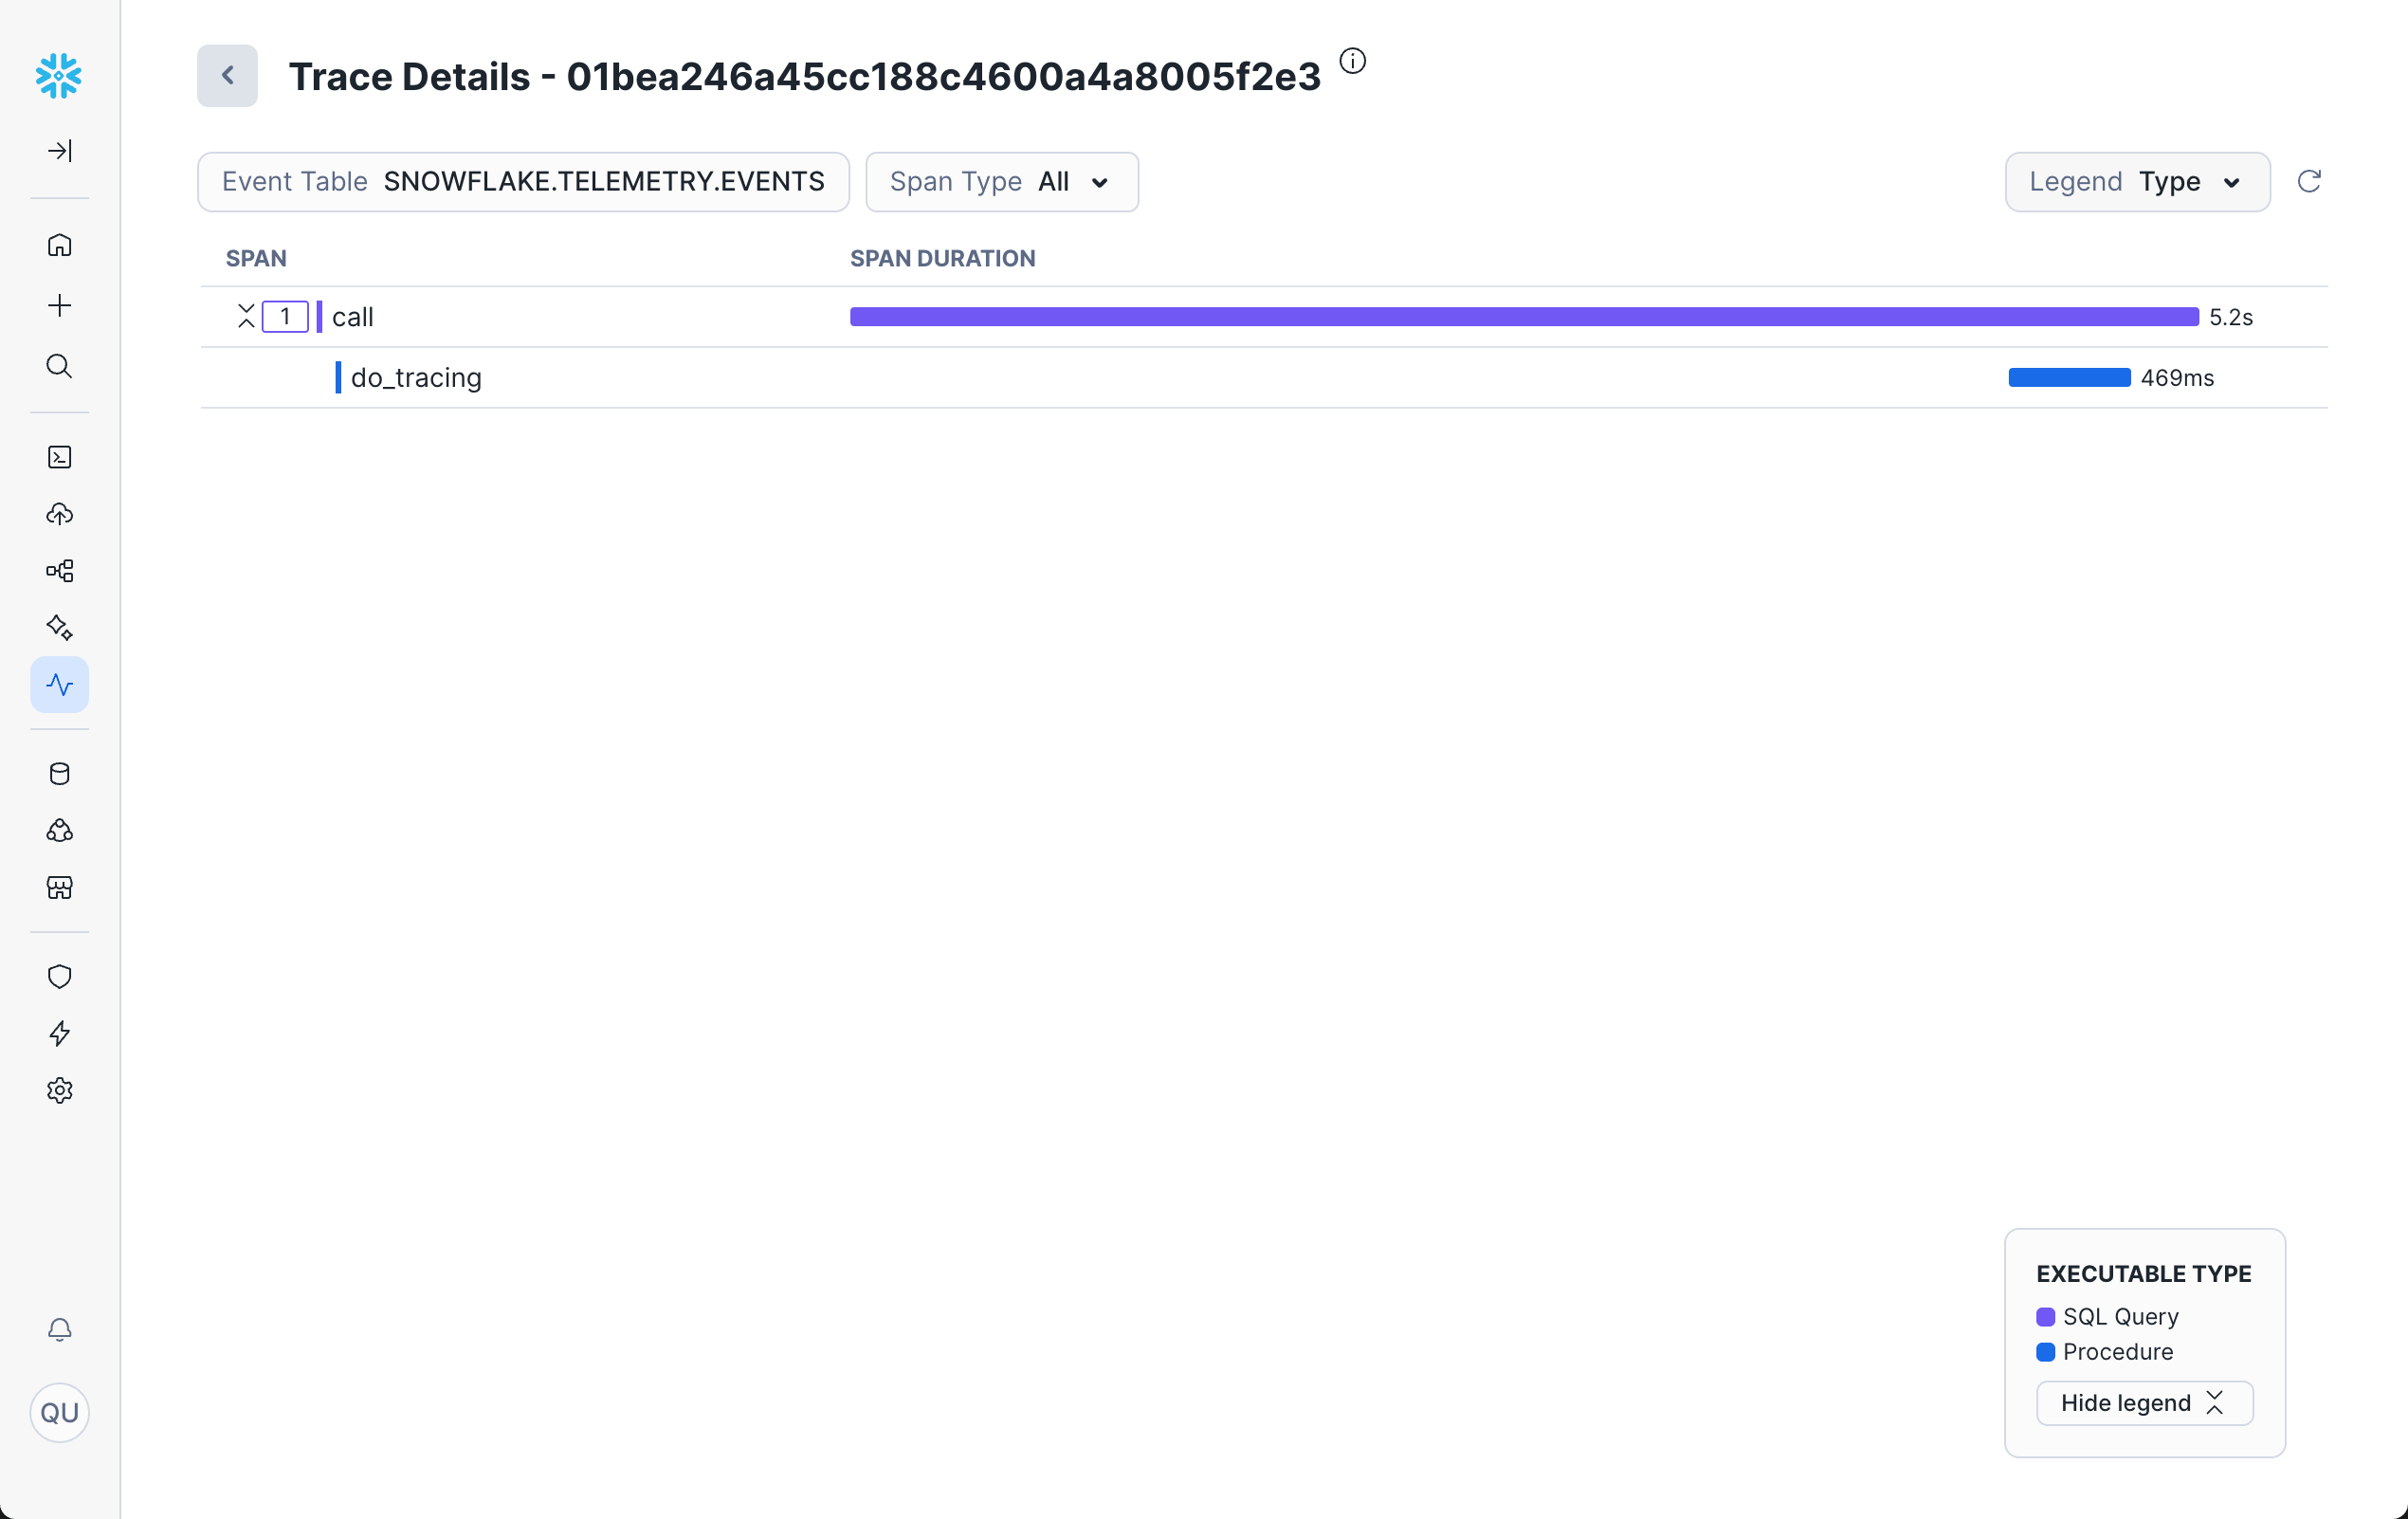
Viewing Trace Details
When you click on a trace, you'll see a detailed view showing the timeline of all spans within that trace. This view allows you to:
- Filter by Span Type: Use the Span Type drop-down to show or hide spans by type (All, UDF, Procedures, Streamlit, and/or Query).
- Change the Legend: Use the Legend drop-down to switch how spans are colored - either by Type (operation type) or by Query (Query ID).
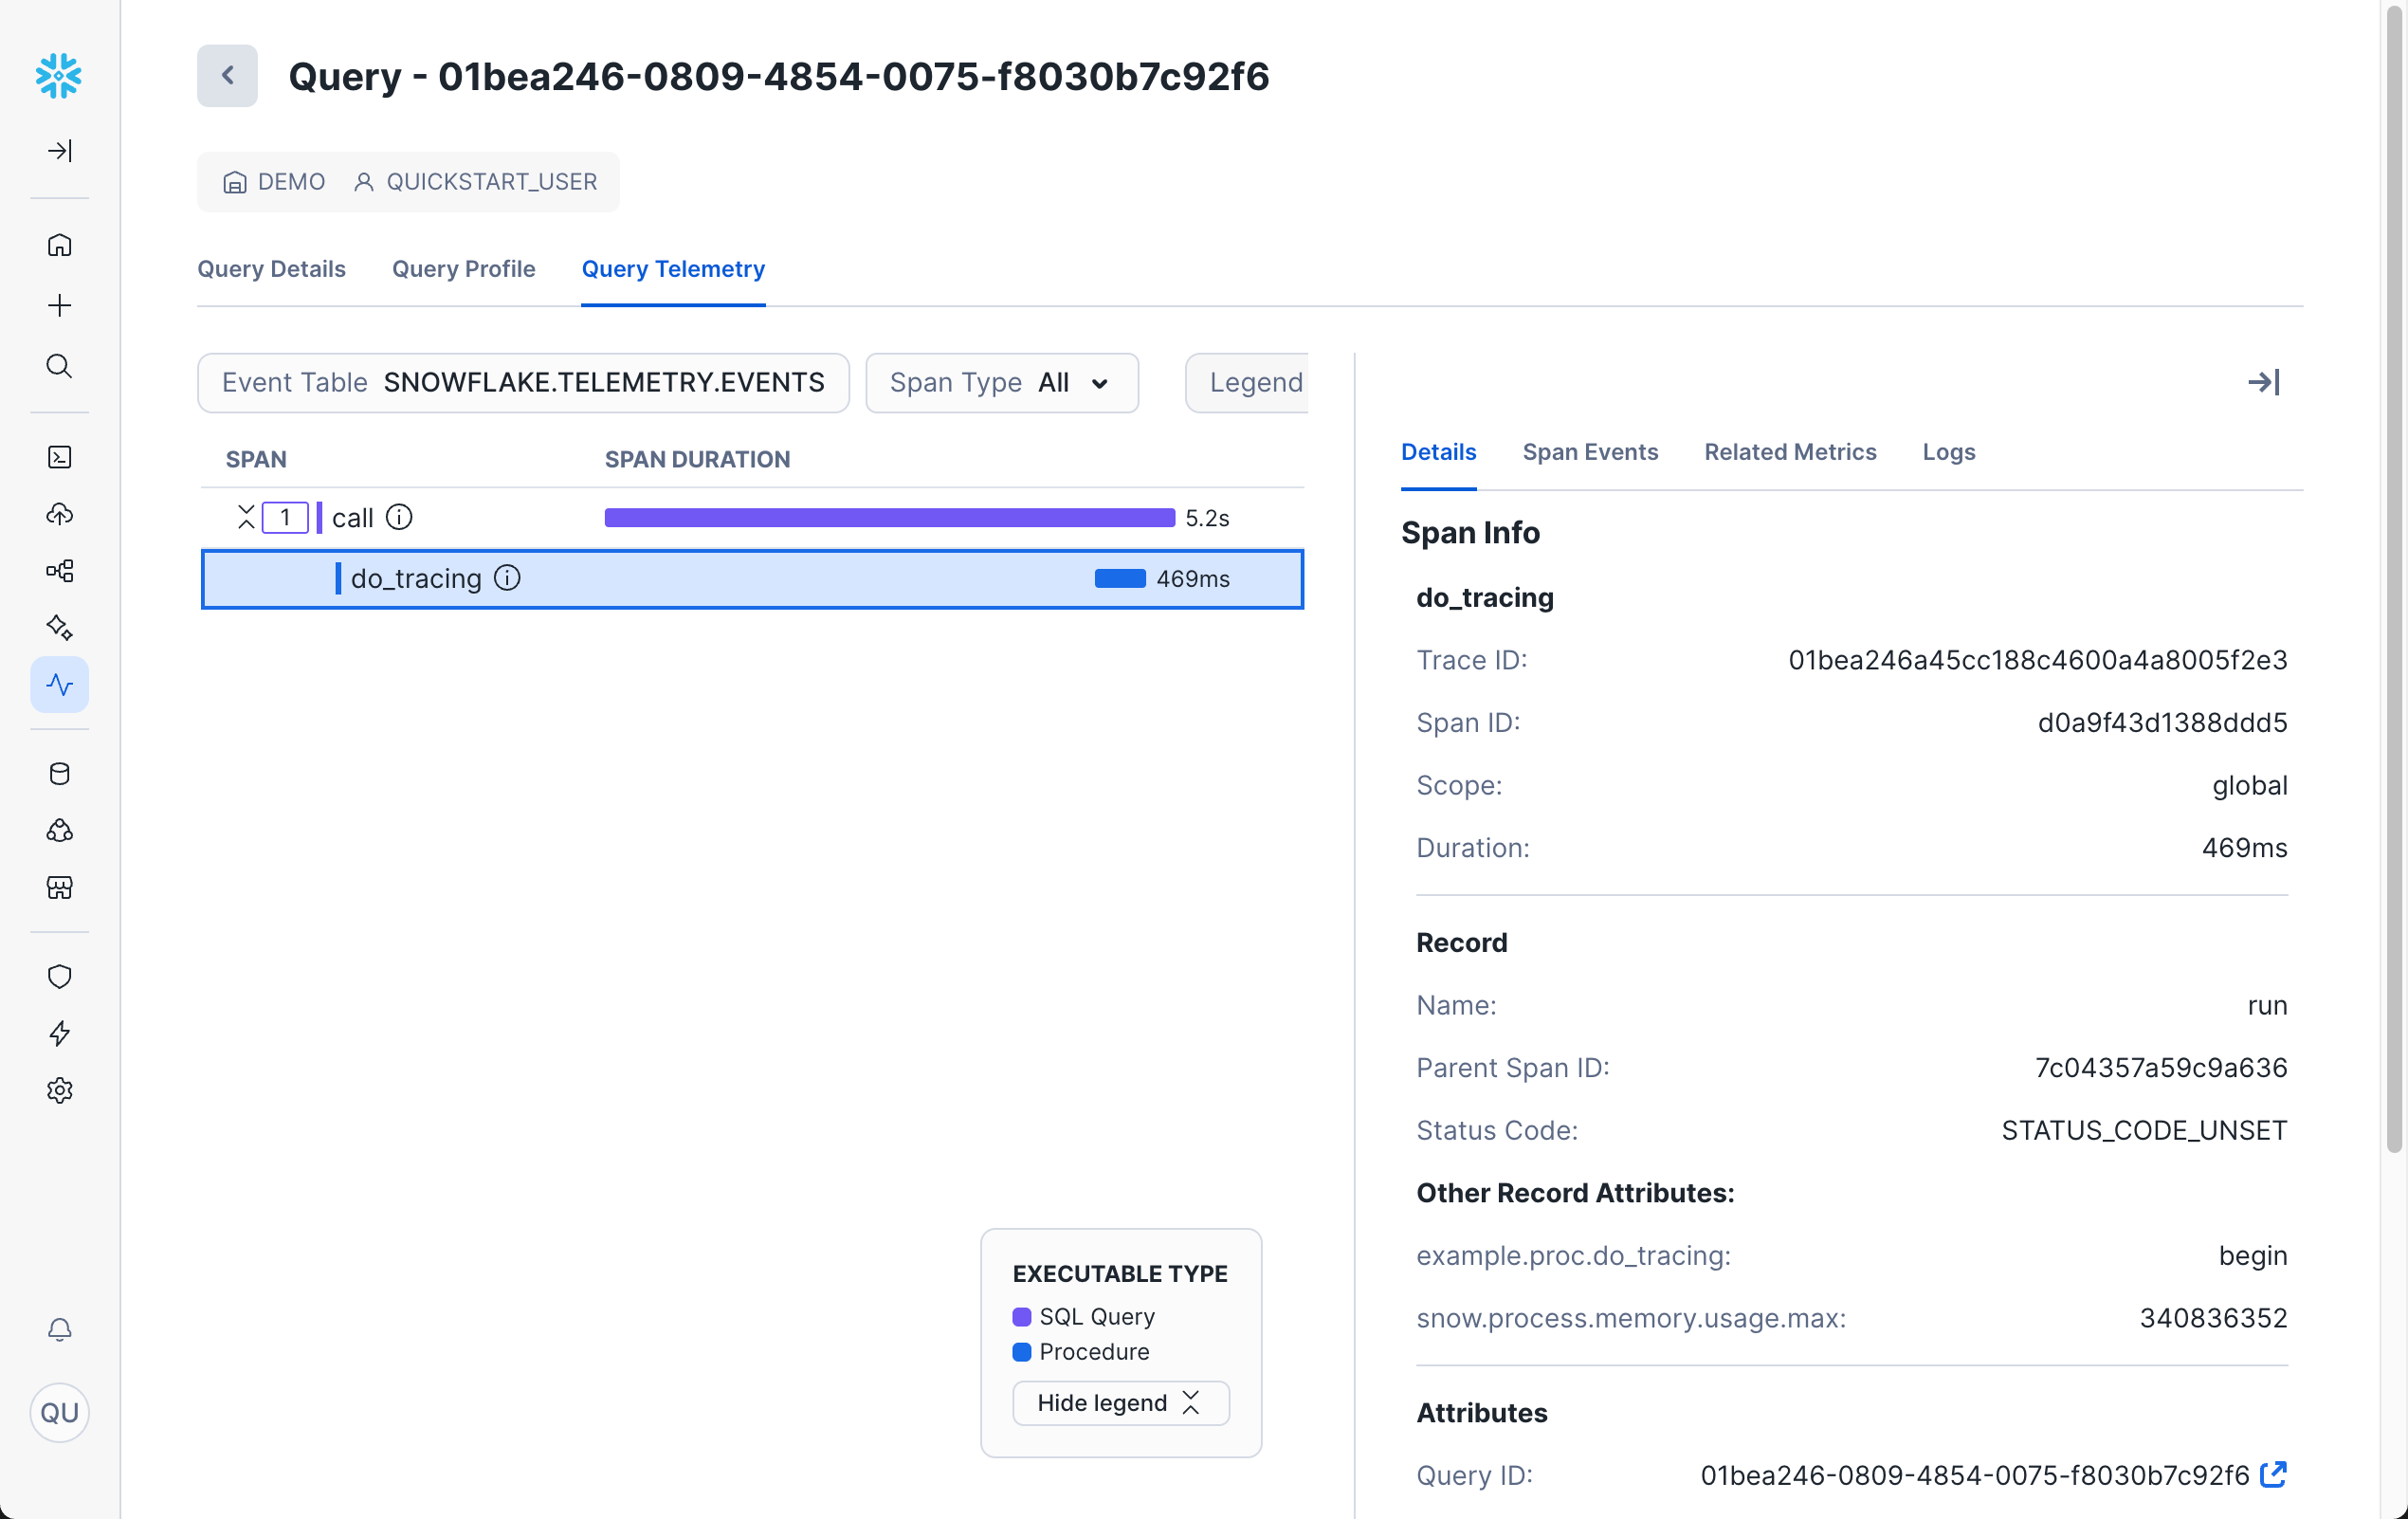
Viewing Span Details
Clicking on any individual span in the trace opens a sidebar with four tabs: Details, Span Events, Related Metrics, and Logs.
Details
The Details tab shows info and attributes about the selected span, including Trace ID, Span ID, Duration, Type, Warehouse, and more.
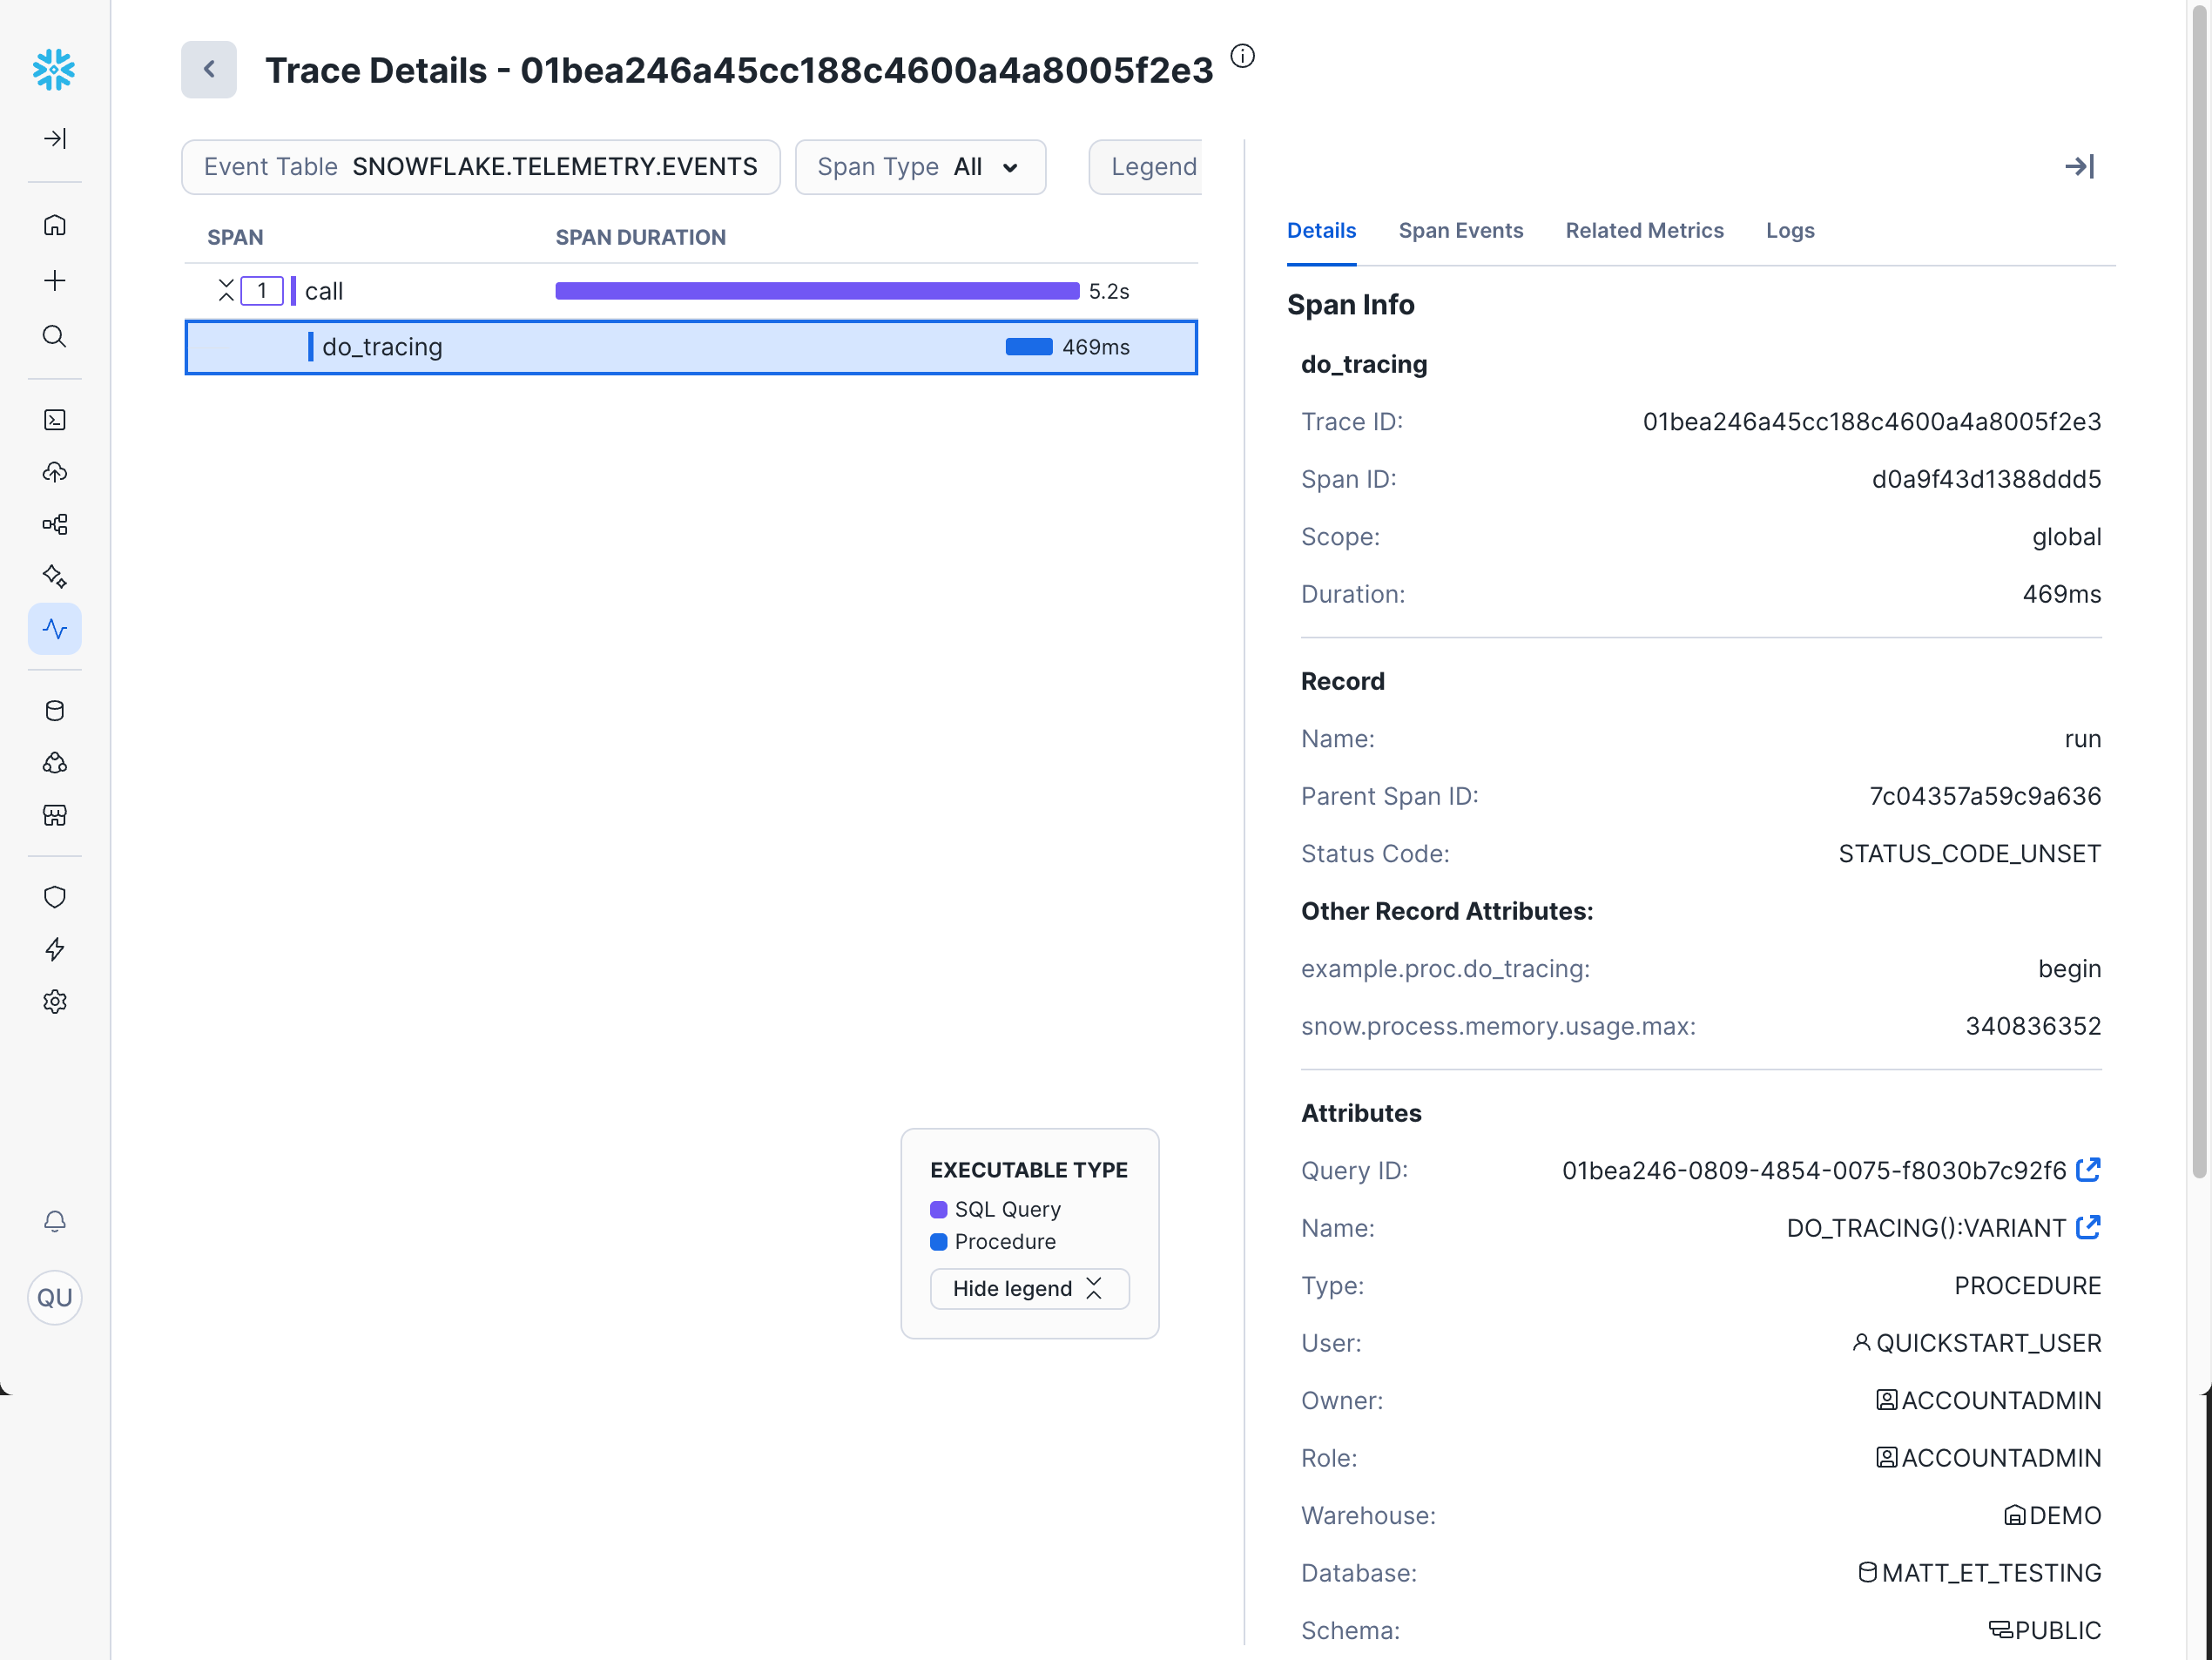
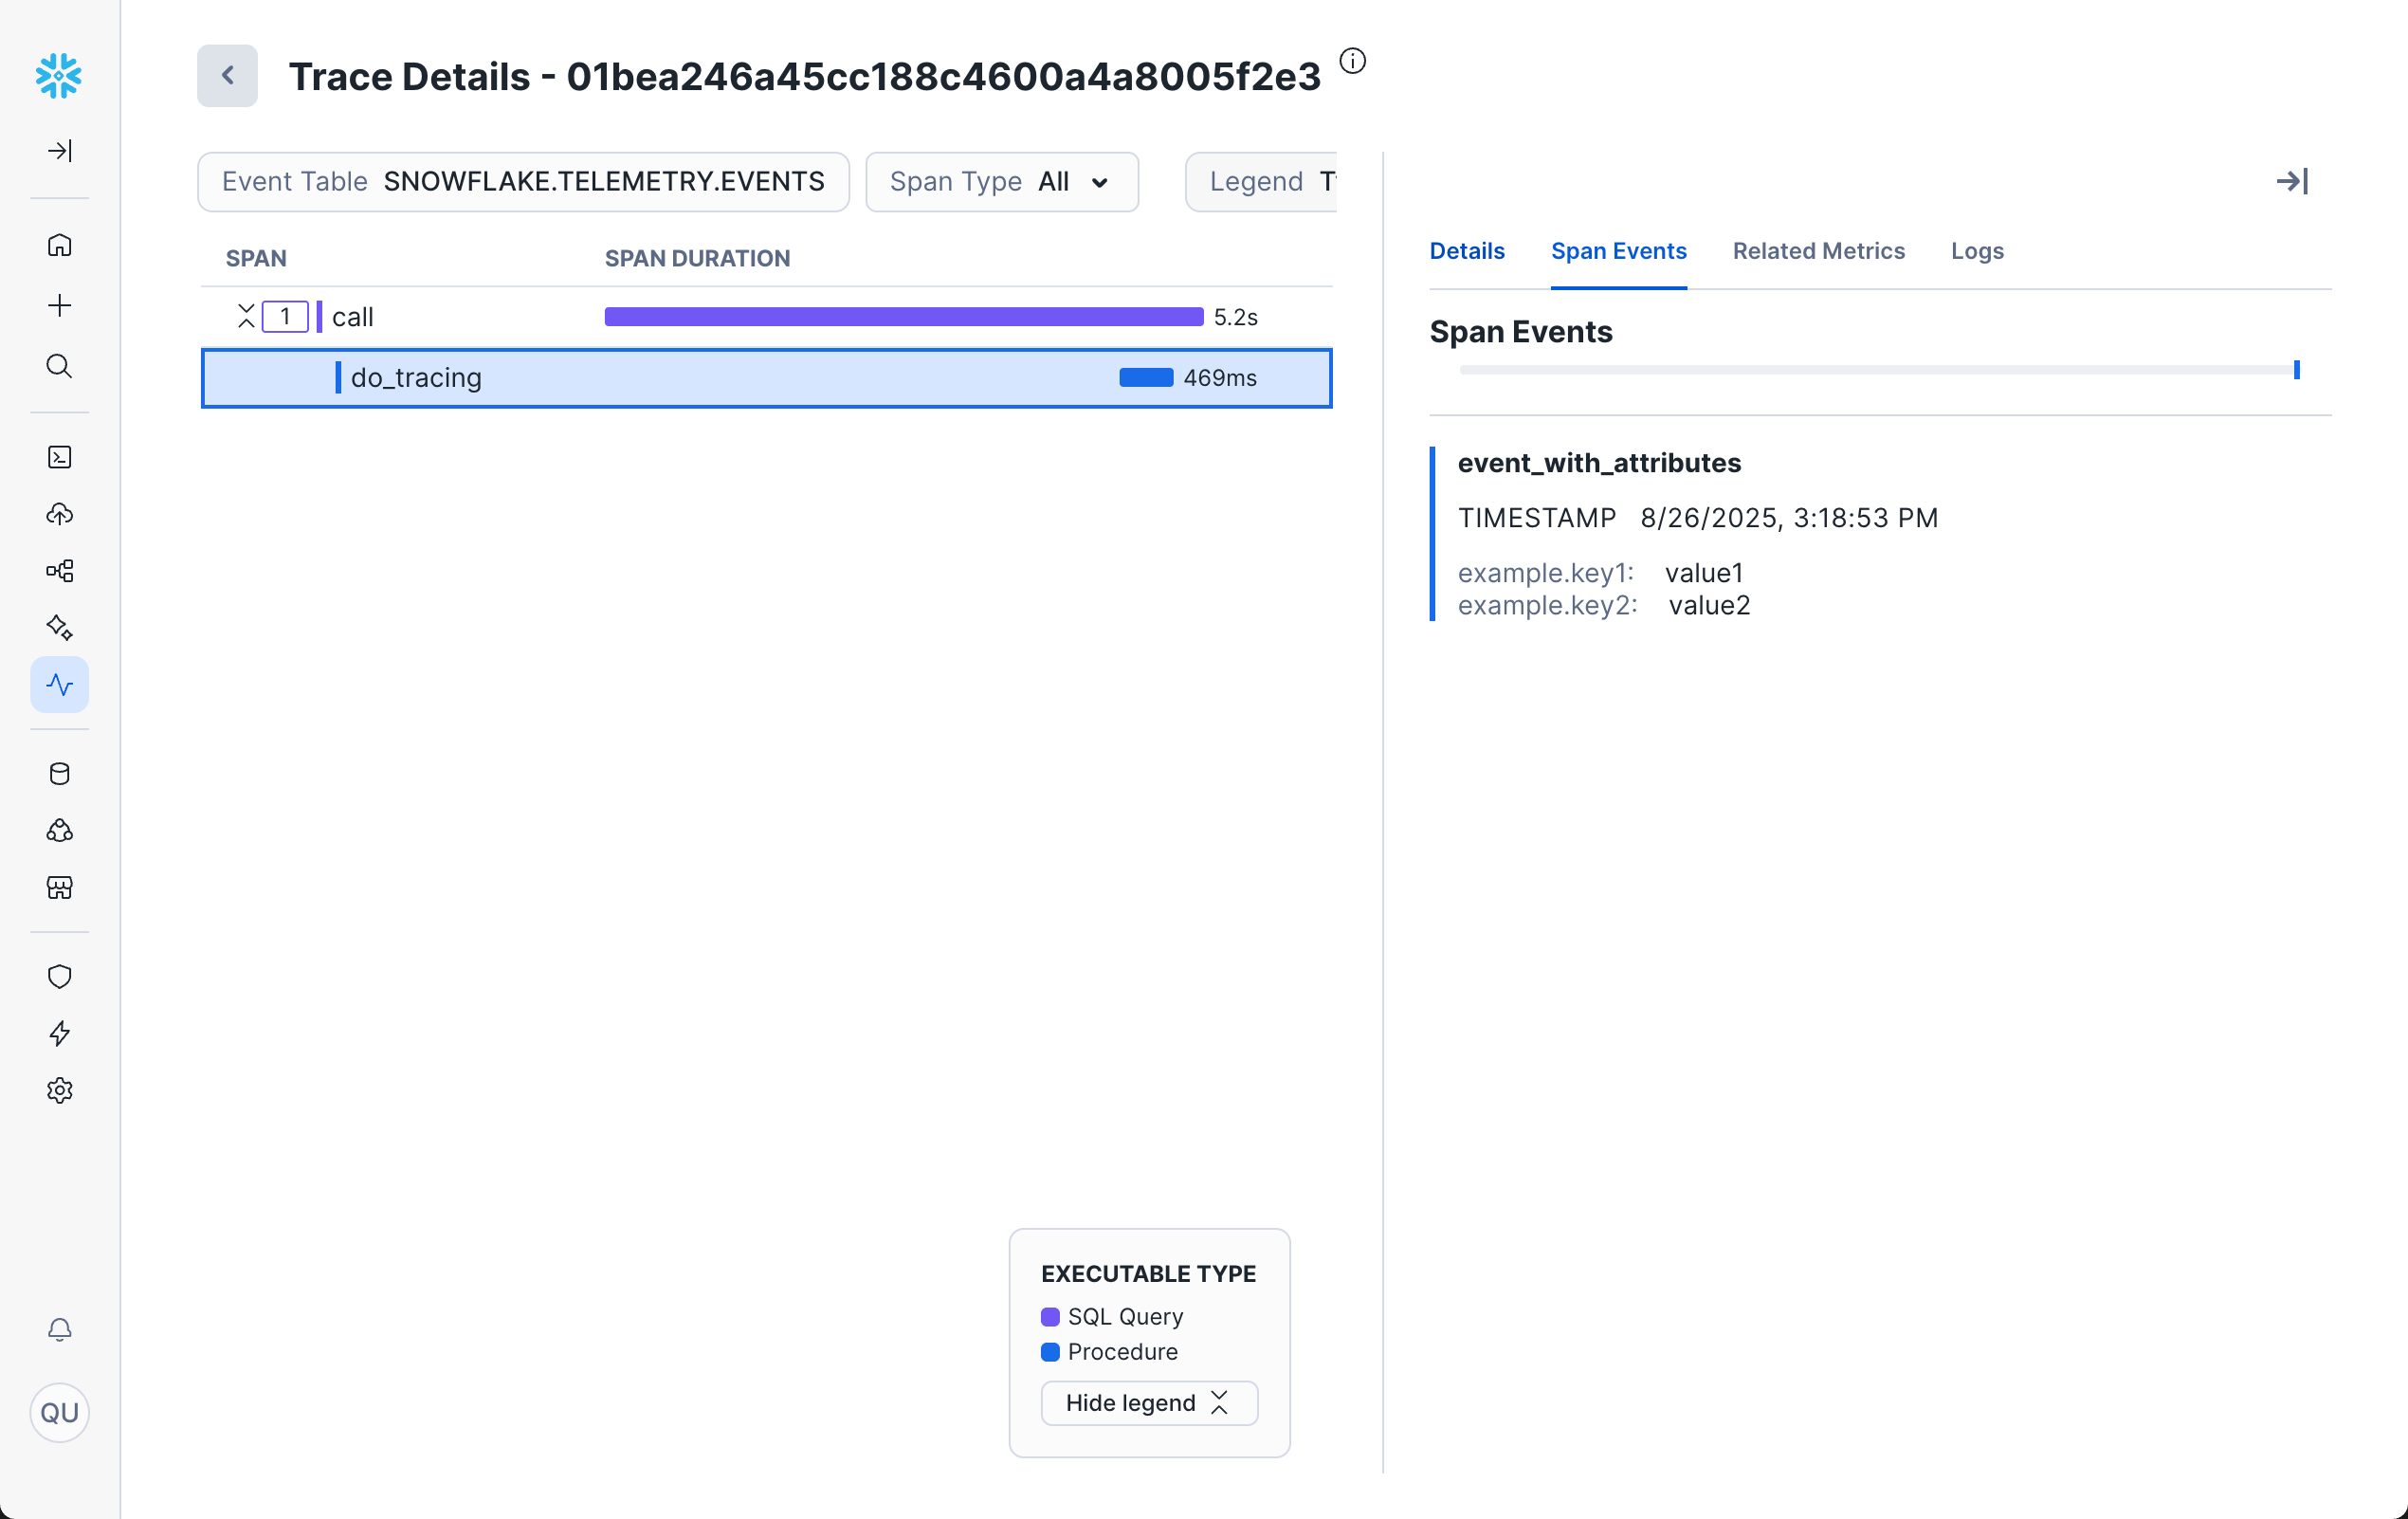
Span Events
The Span Events tab shows details of events recorded within the span.
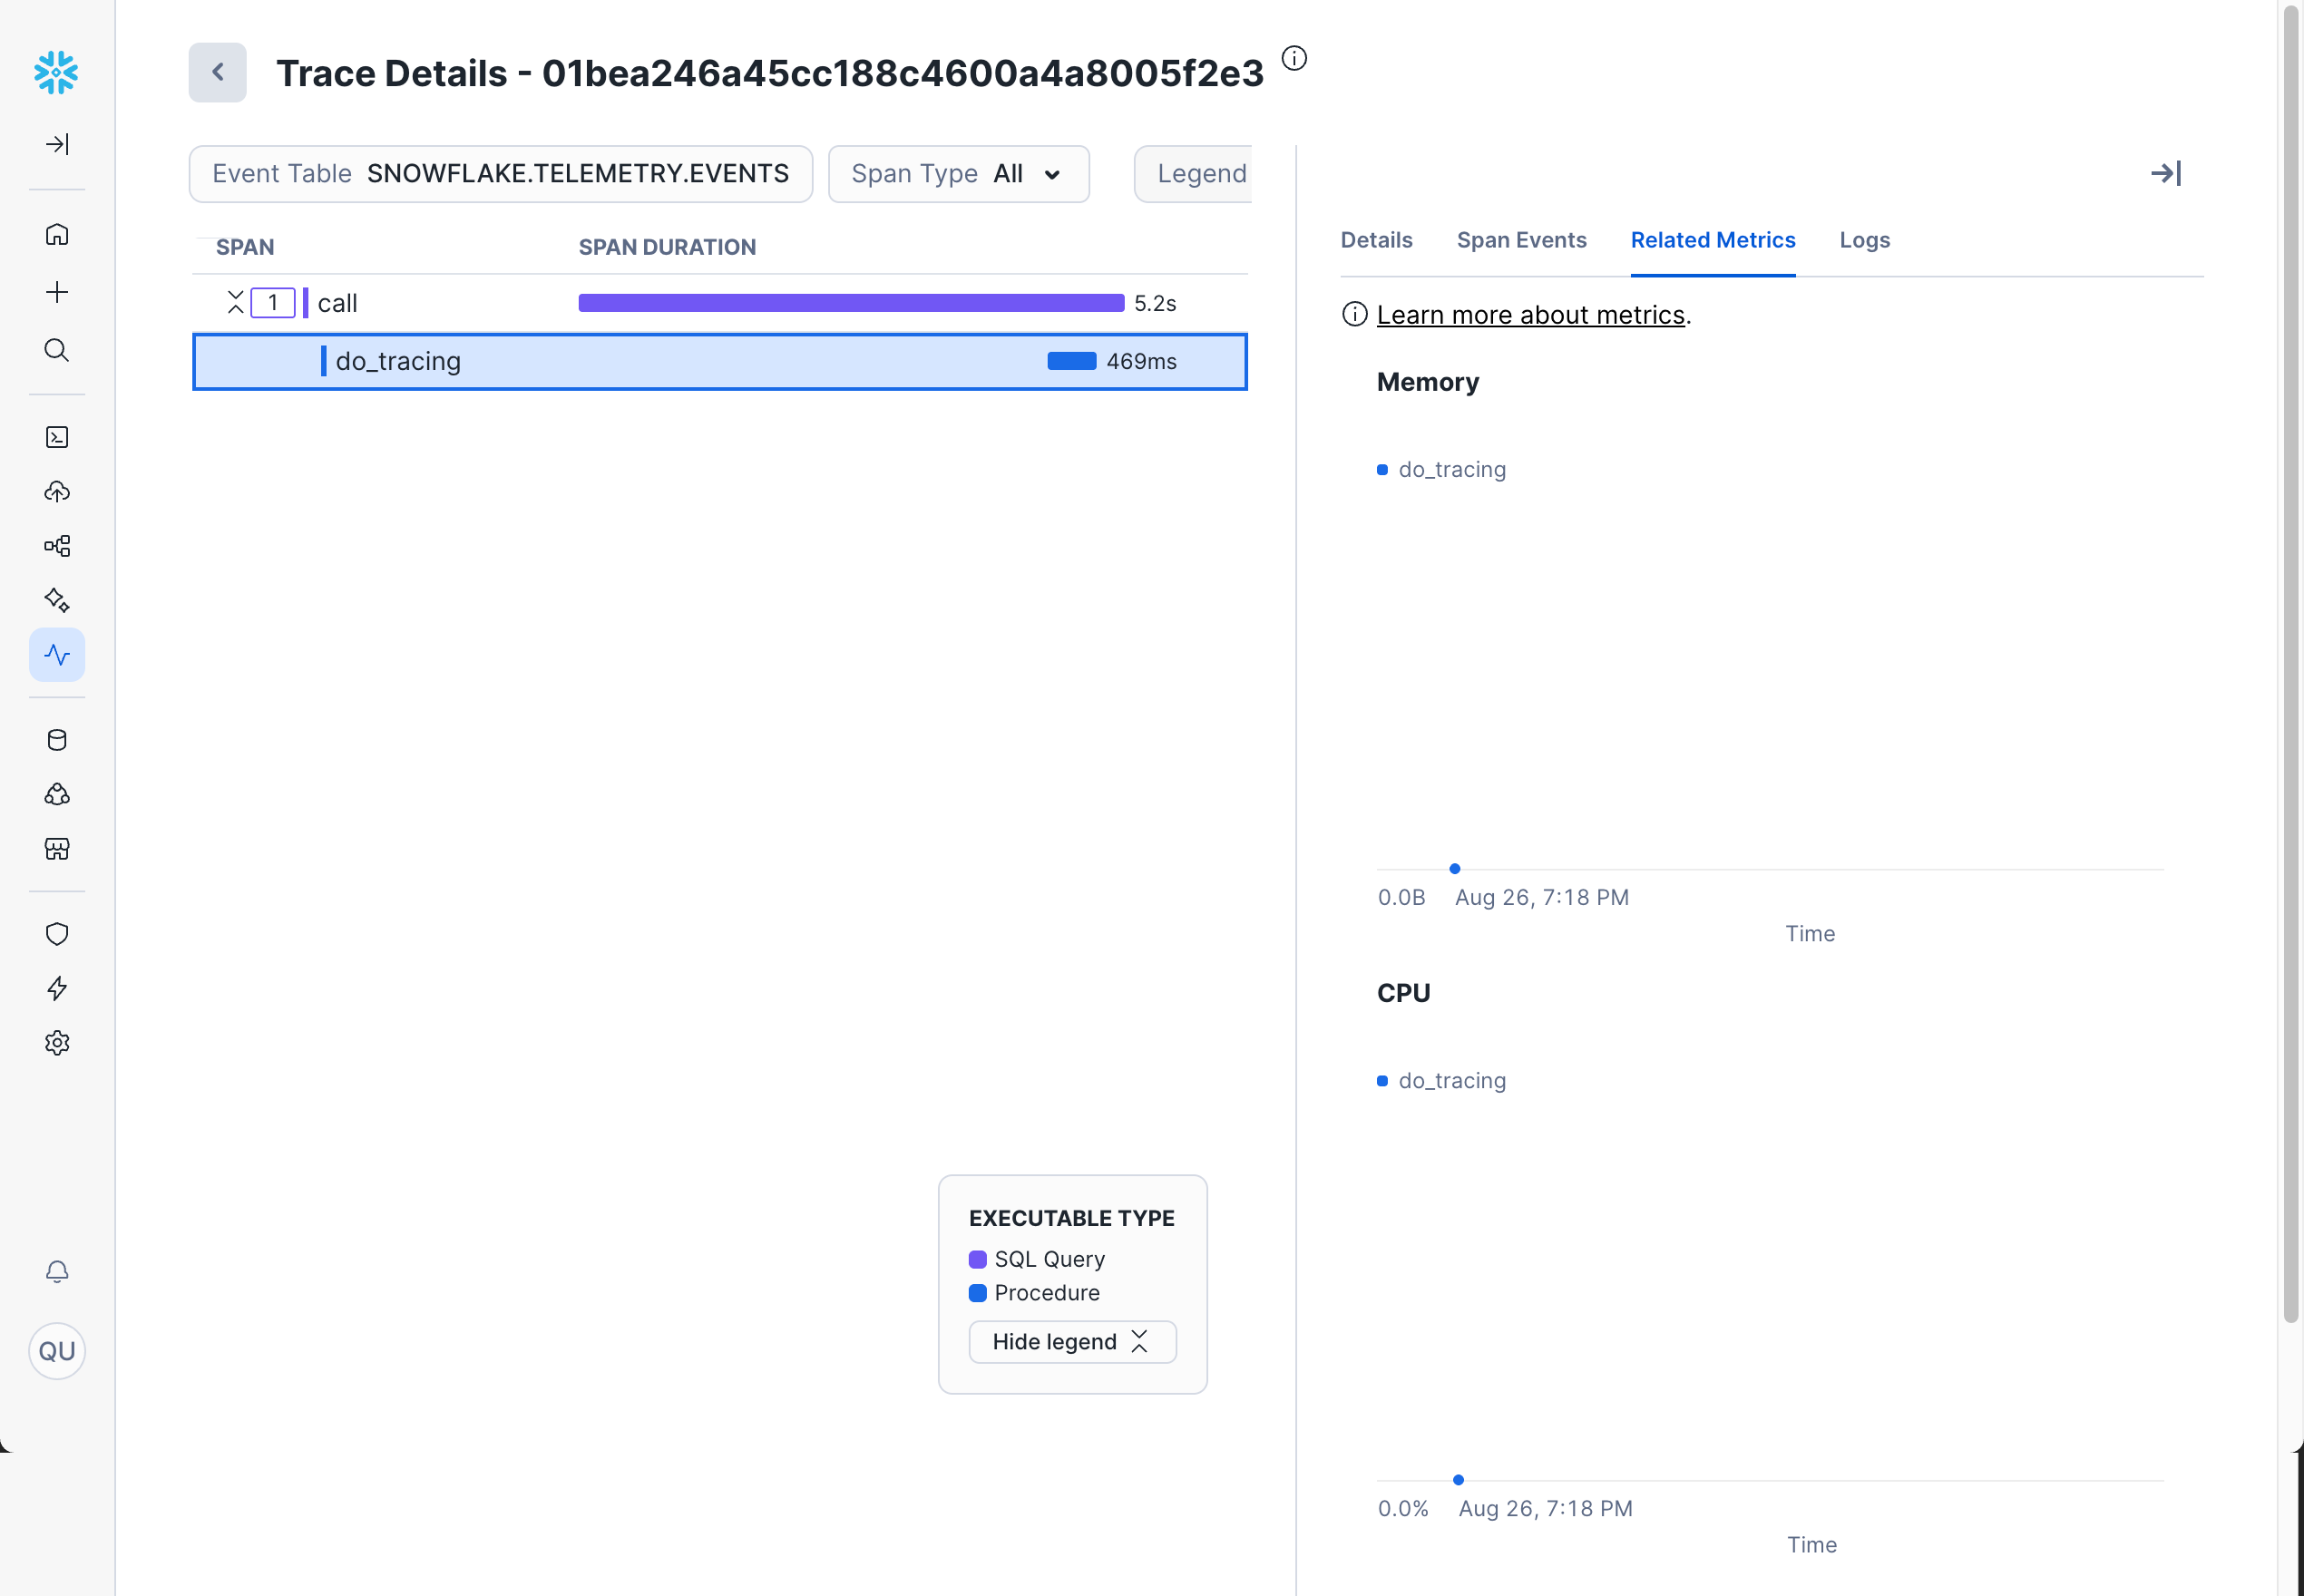
Related Metrics
The Related Metrics tab shows CPU and memory metrics related to the span.
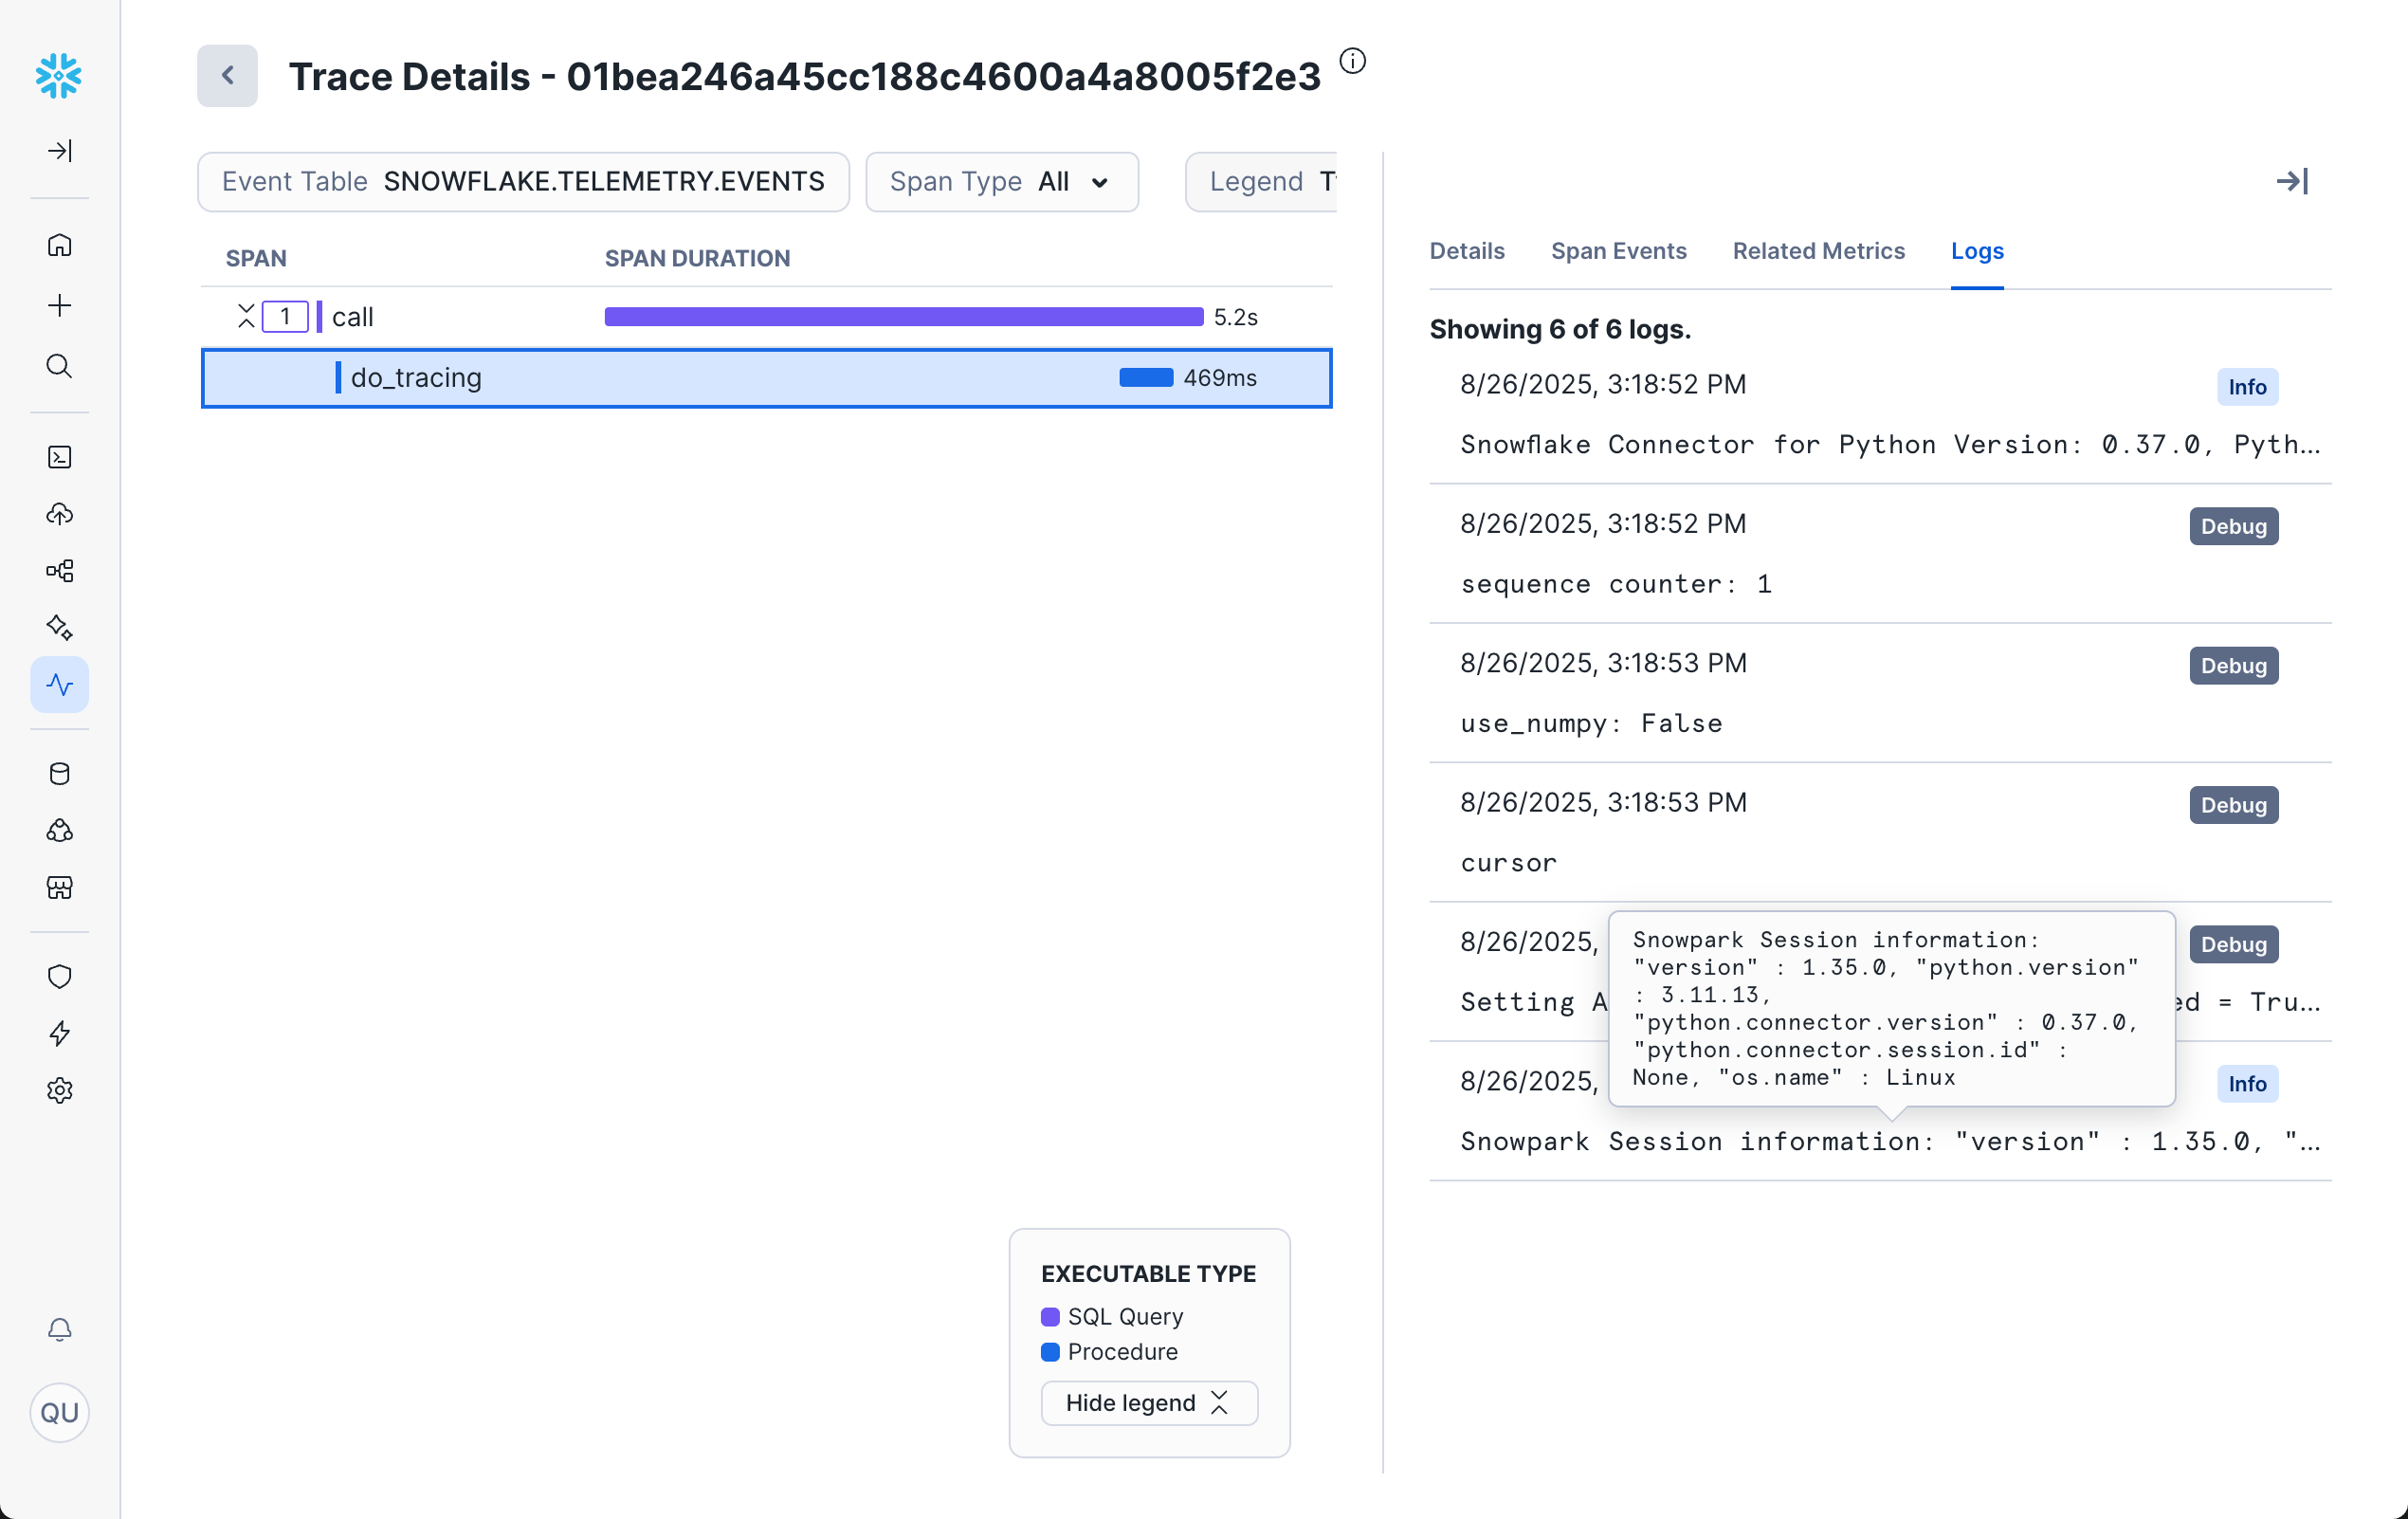
Logs
The Logs tab shows logs directly related to the trace.
This detailed information helps you understand exactly what happened during each operation and identify optimization opportunities.
For full details on each of the above fields, see the documentation here.
Additional Resources
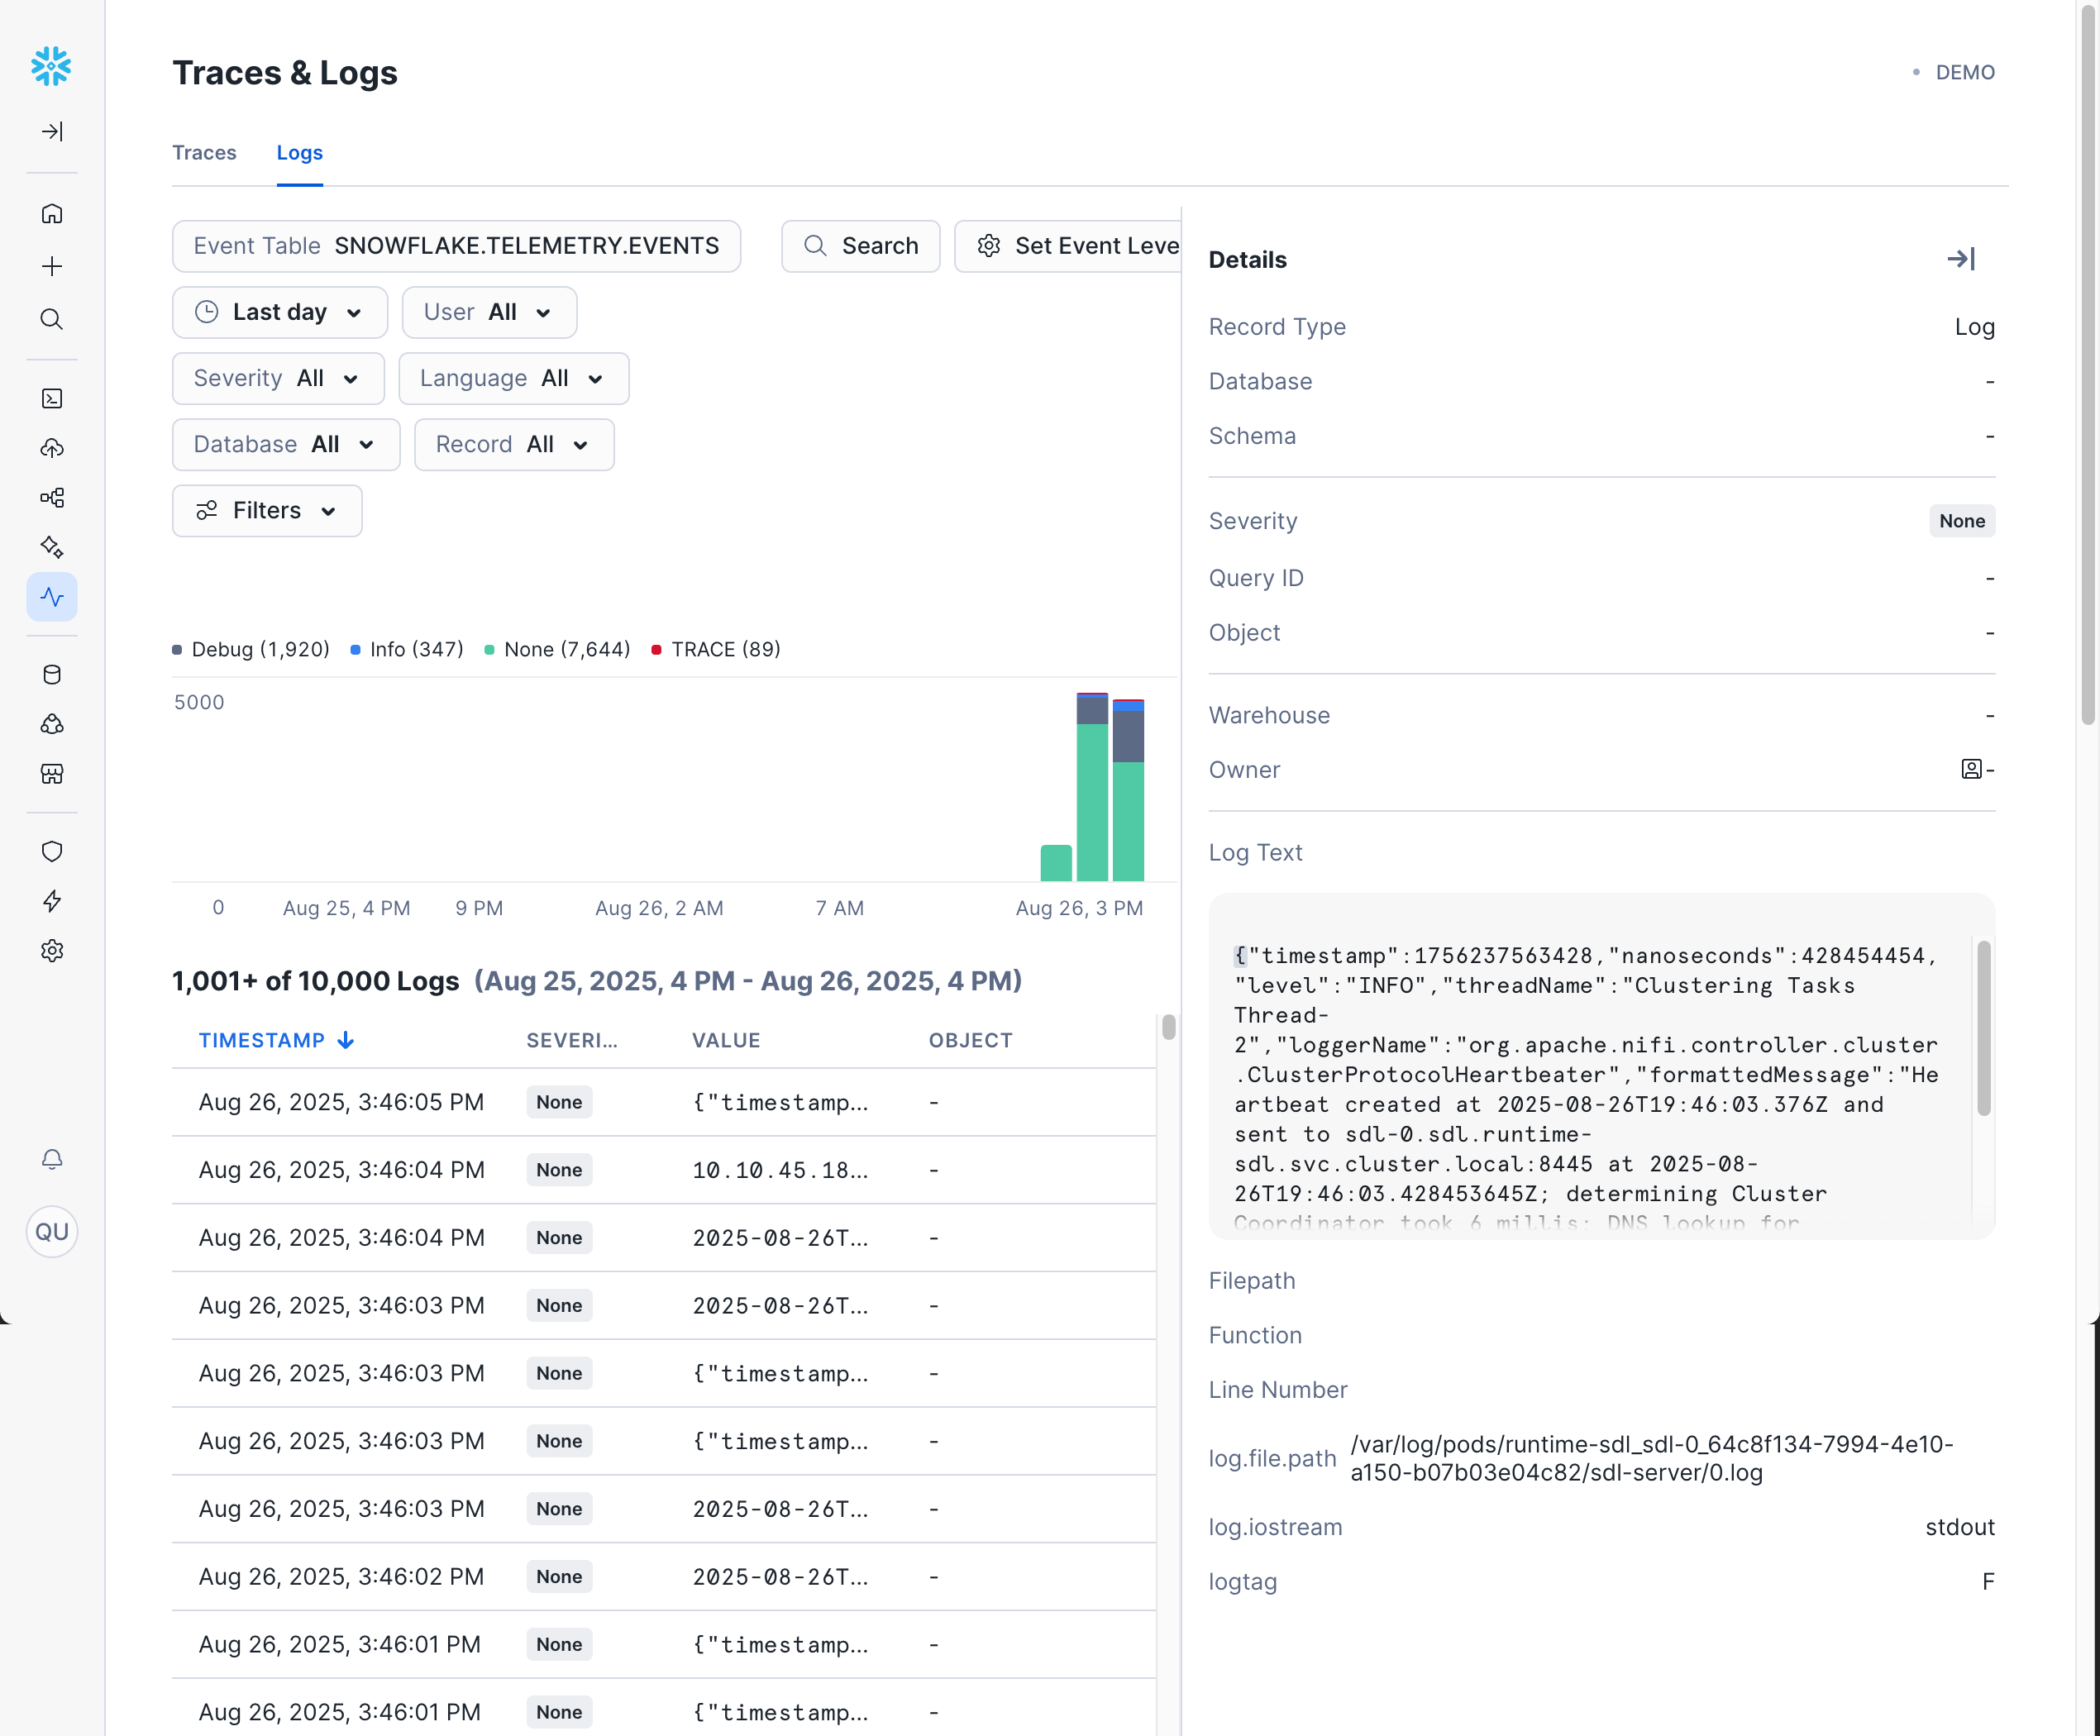
Logs
Logs are structured records of events that occur during the execution of your Snowflake workloads. They provide detailed information about what happened during code execution, including informational messages, warnings, errors, and debug information. Logs are essential for troubleshooting issues, understanding application behavior, and monitoring the health of your systems.
Why Logs Are Useful
Logs help you:
- Debug issues by providing detailed error messages and stack traces
- Monitor application behavior and performance
- Audit operations and track important events
- Understand the flow of execution in complex procedures
- Identify patterns in application usage or errors
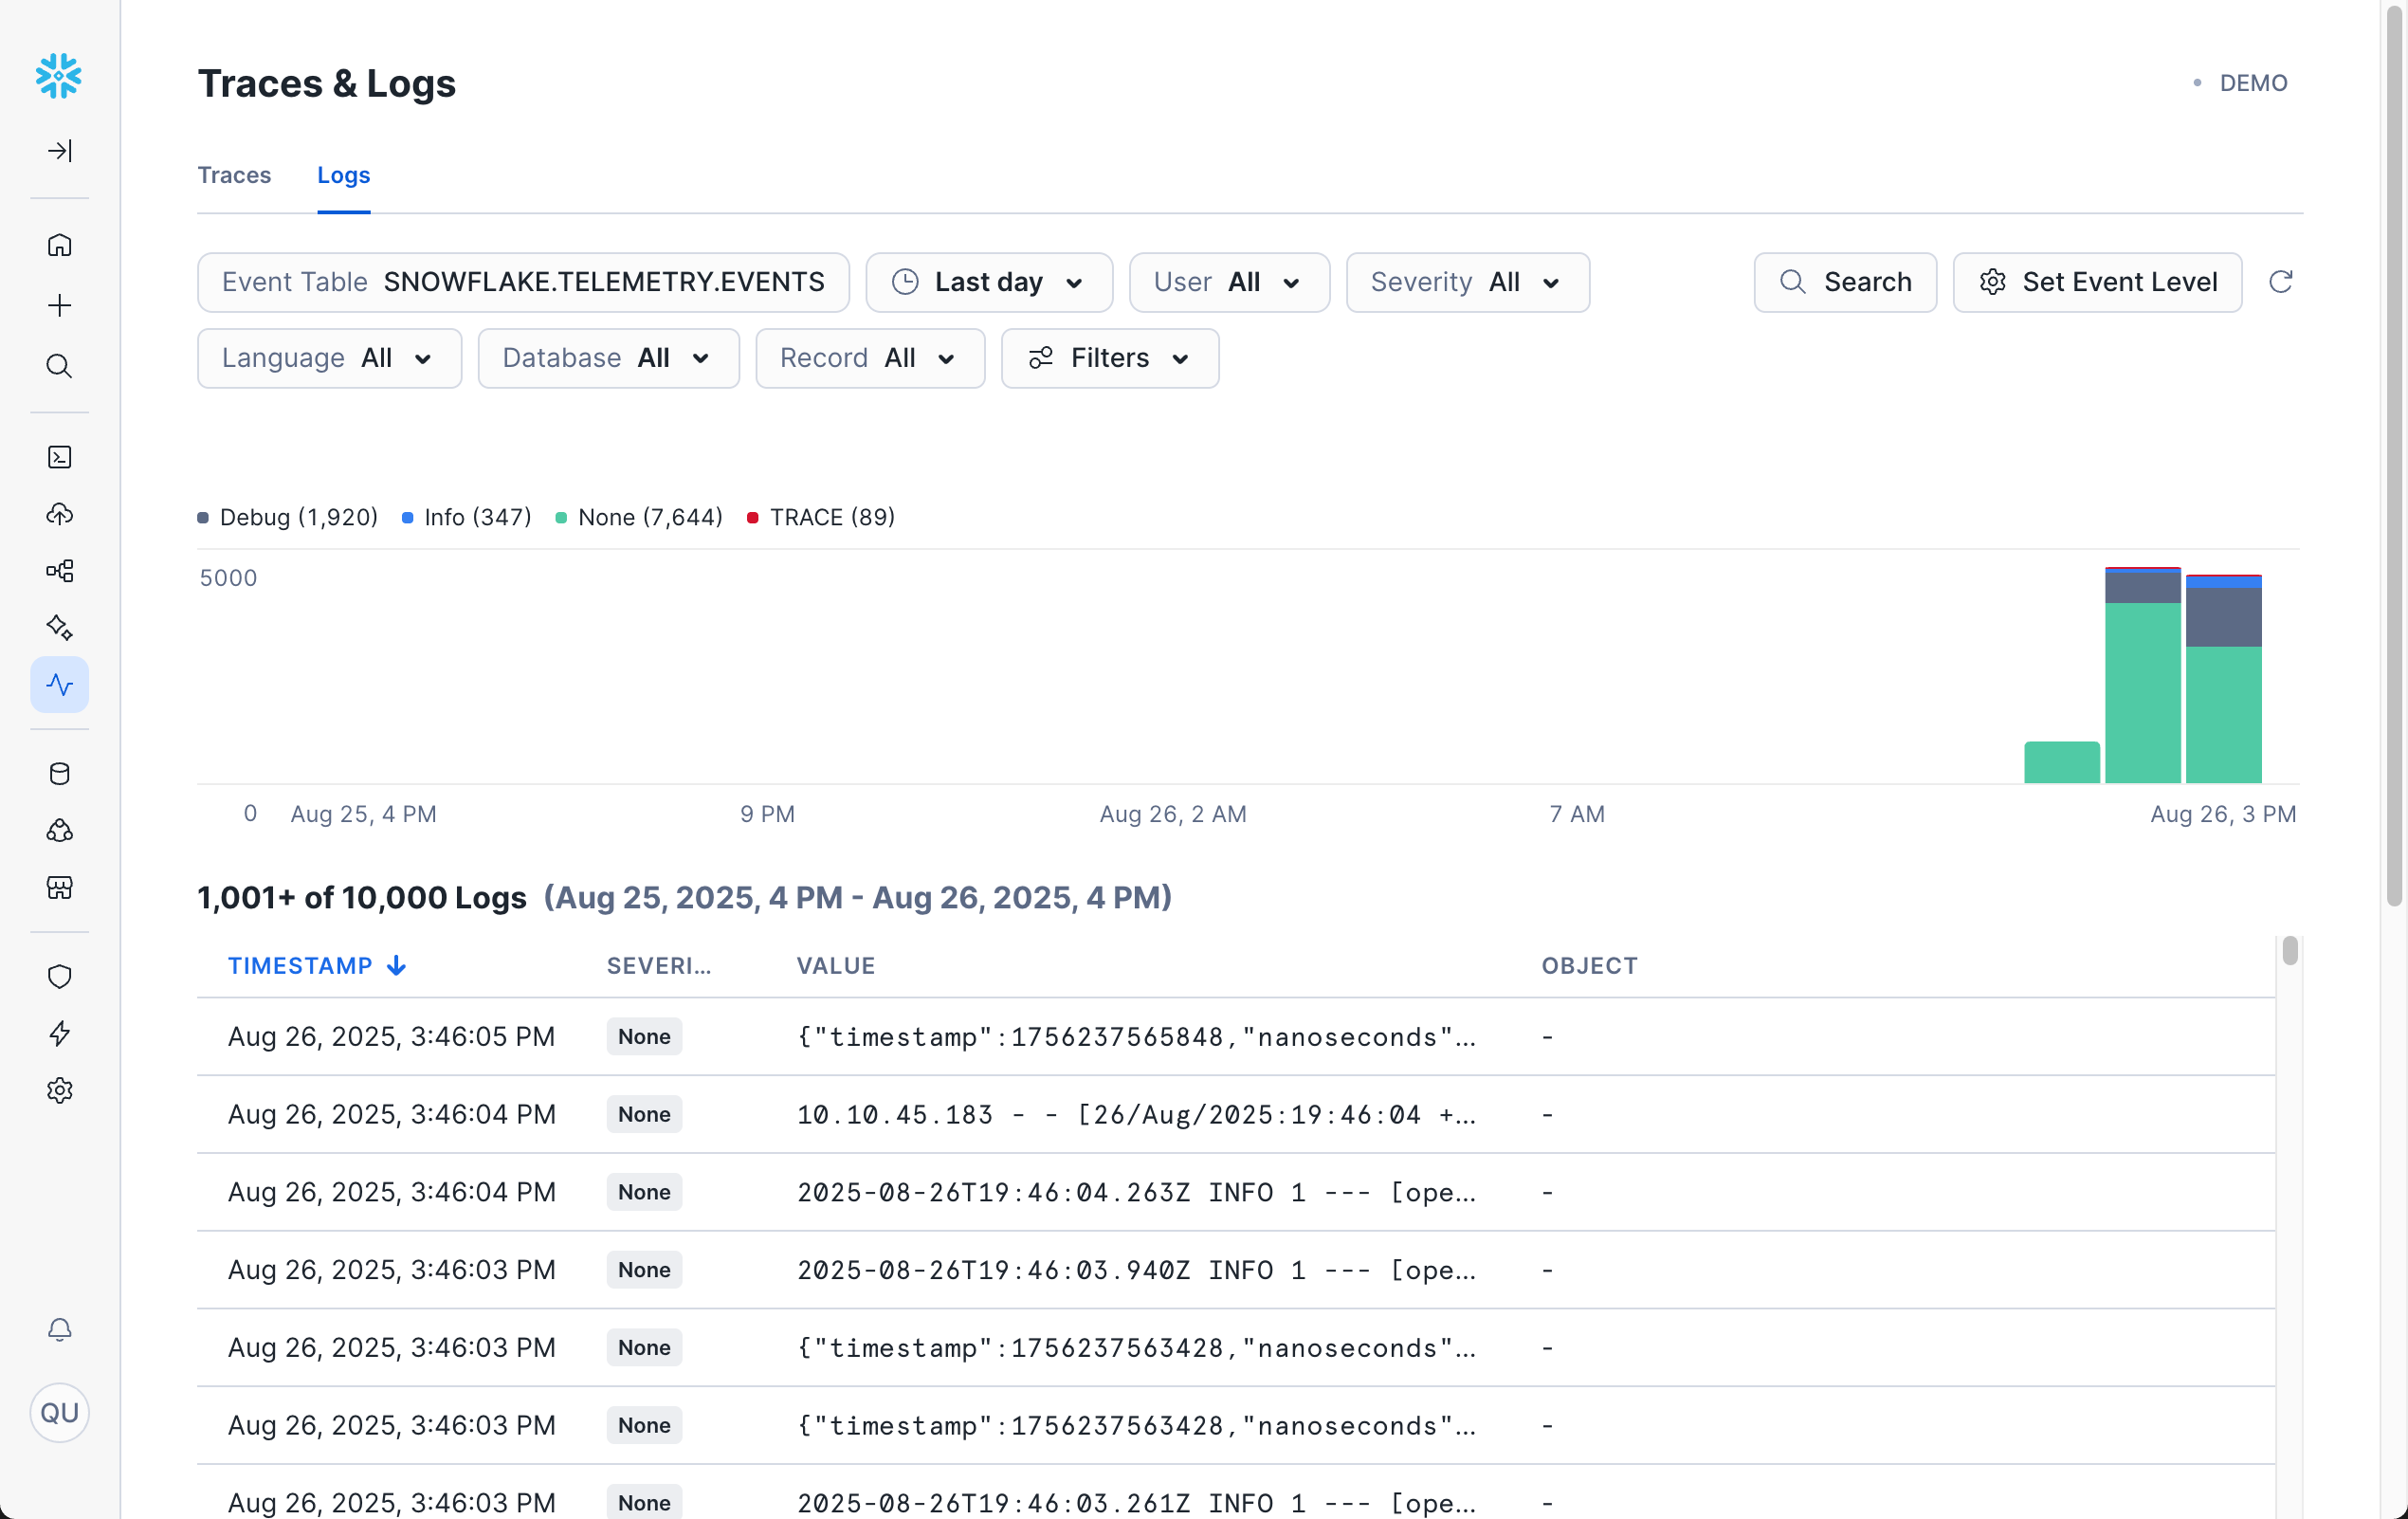
Accessing Logs in Snowsight
To view logs in Snowsight:
- Navigate to Monitoring » Traces & Logs
- Click on the Logs tab to switch from the default traces view.
- (Optional) Use the filters to find specific logs. For example:
- Time Range can be set either by using the drop-down or by clicking on the graph.
- Severity can be used to select specific log levels (DEBUG, WARN, etc).
- Languages allows filtering by handler code language (Python, Java, etc).
- Database allows filtering by specific procedures, functions, or applications.
- Record allows selecting Logs, Events, or All.
Log Details
By default, you will be shown a list of logs sorted by timestamp.
You can also click on any log entry to bring up a sidebar with more details, including the full log text.
If you don't see any logs after enabling logging, you'll need to execute operations that generate logs. such as UDFs or stored procedures with logging statements.
For a complete walkthrough with examples, see: Getting Started with Logging.
Additional Resources
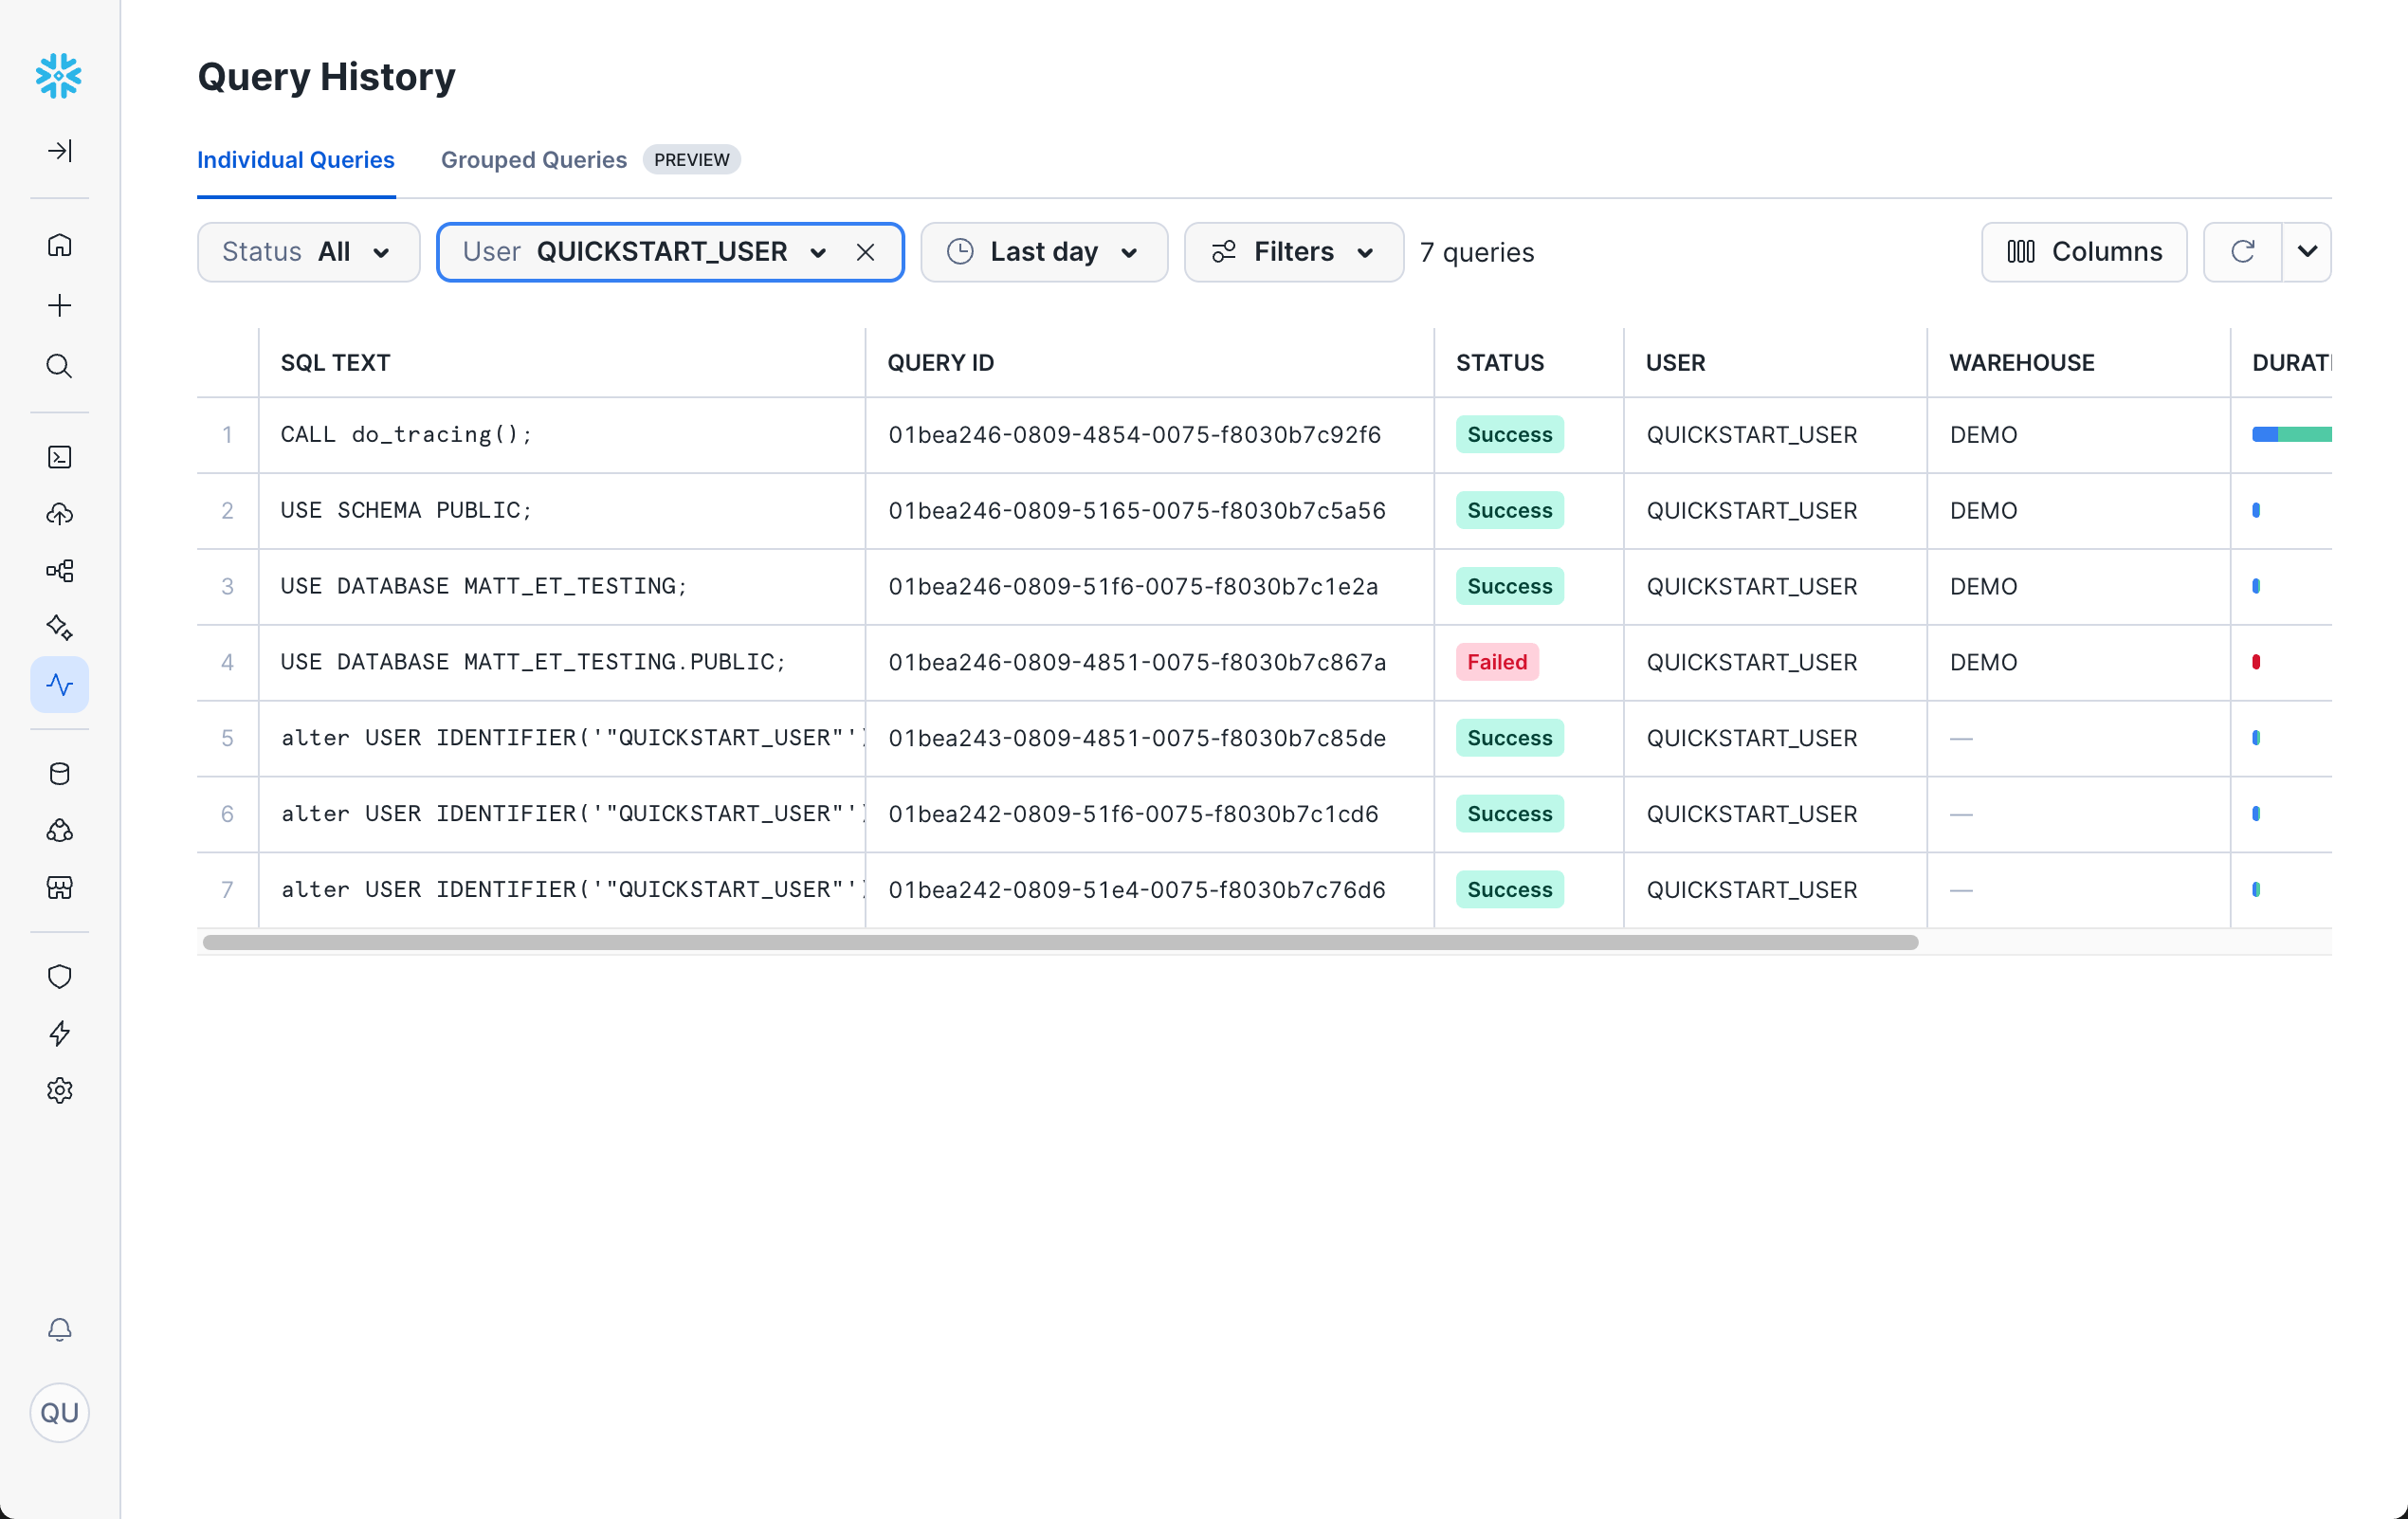
Query History
Query History provides a comprehensive view of all SQL queries executed in your Snowflake account. It's one of the most important tools for monitoring, troubleshooting, and optimizing database performance. Query History shows detailed information about query execution, performance metrics, and resource usage patterns.
Why Query History Is Useful
Query History helps you:
- Monitor query performance and identify slow-running queries
- Analyze resource usage and warehouse utilization
- Troubleshoot failed queries and understand error patterns
- Track query execution trends over time
- Optimize queries by understanding execution patterns
- Audit database activity and user behavior
Query history can be viewed as Individual Queries or Grouped Queries.
Accessing Query History in Snowsight (Individual Queries)
To view Query History in Snowsight:
- Navigate to Monitoring » Query History
- (Optional) Use the filters to find specific queries:
- Status: Filter by execution status (Success, Failed, etc.)
- User: Filter by specific users
- Time Range: Filter by execution time
- Filters: Various other filters to help you find a specific query.
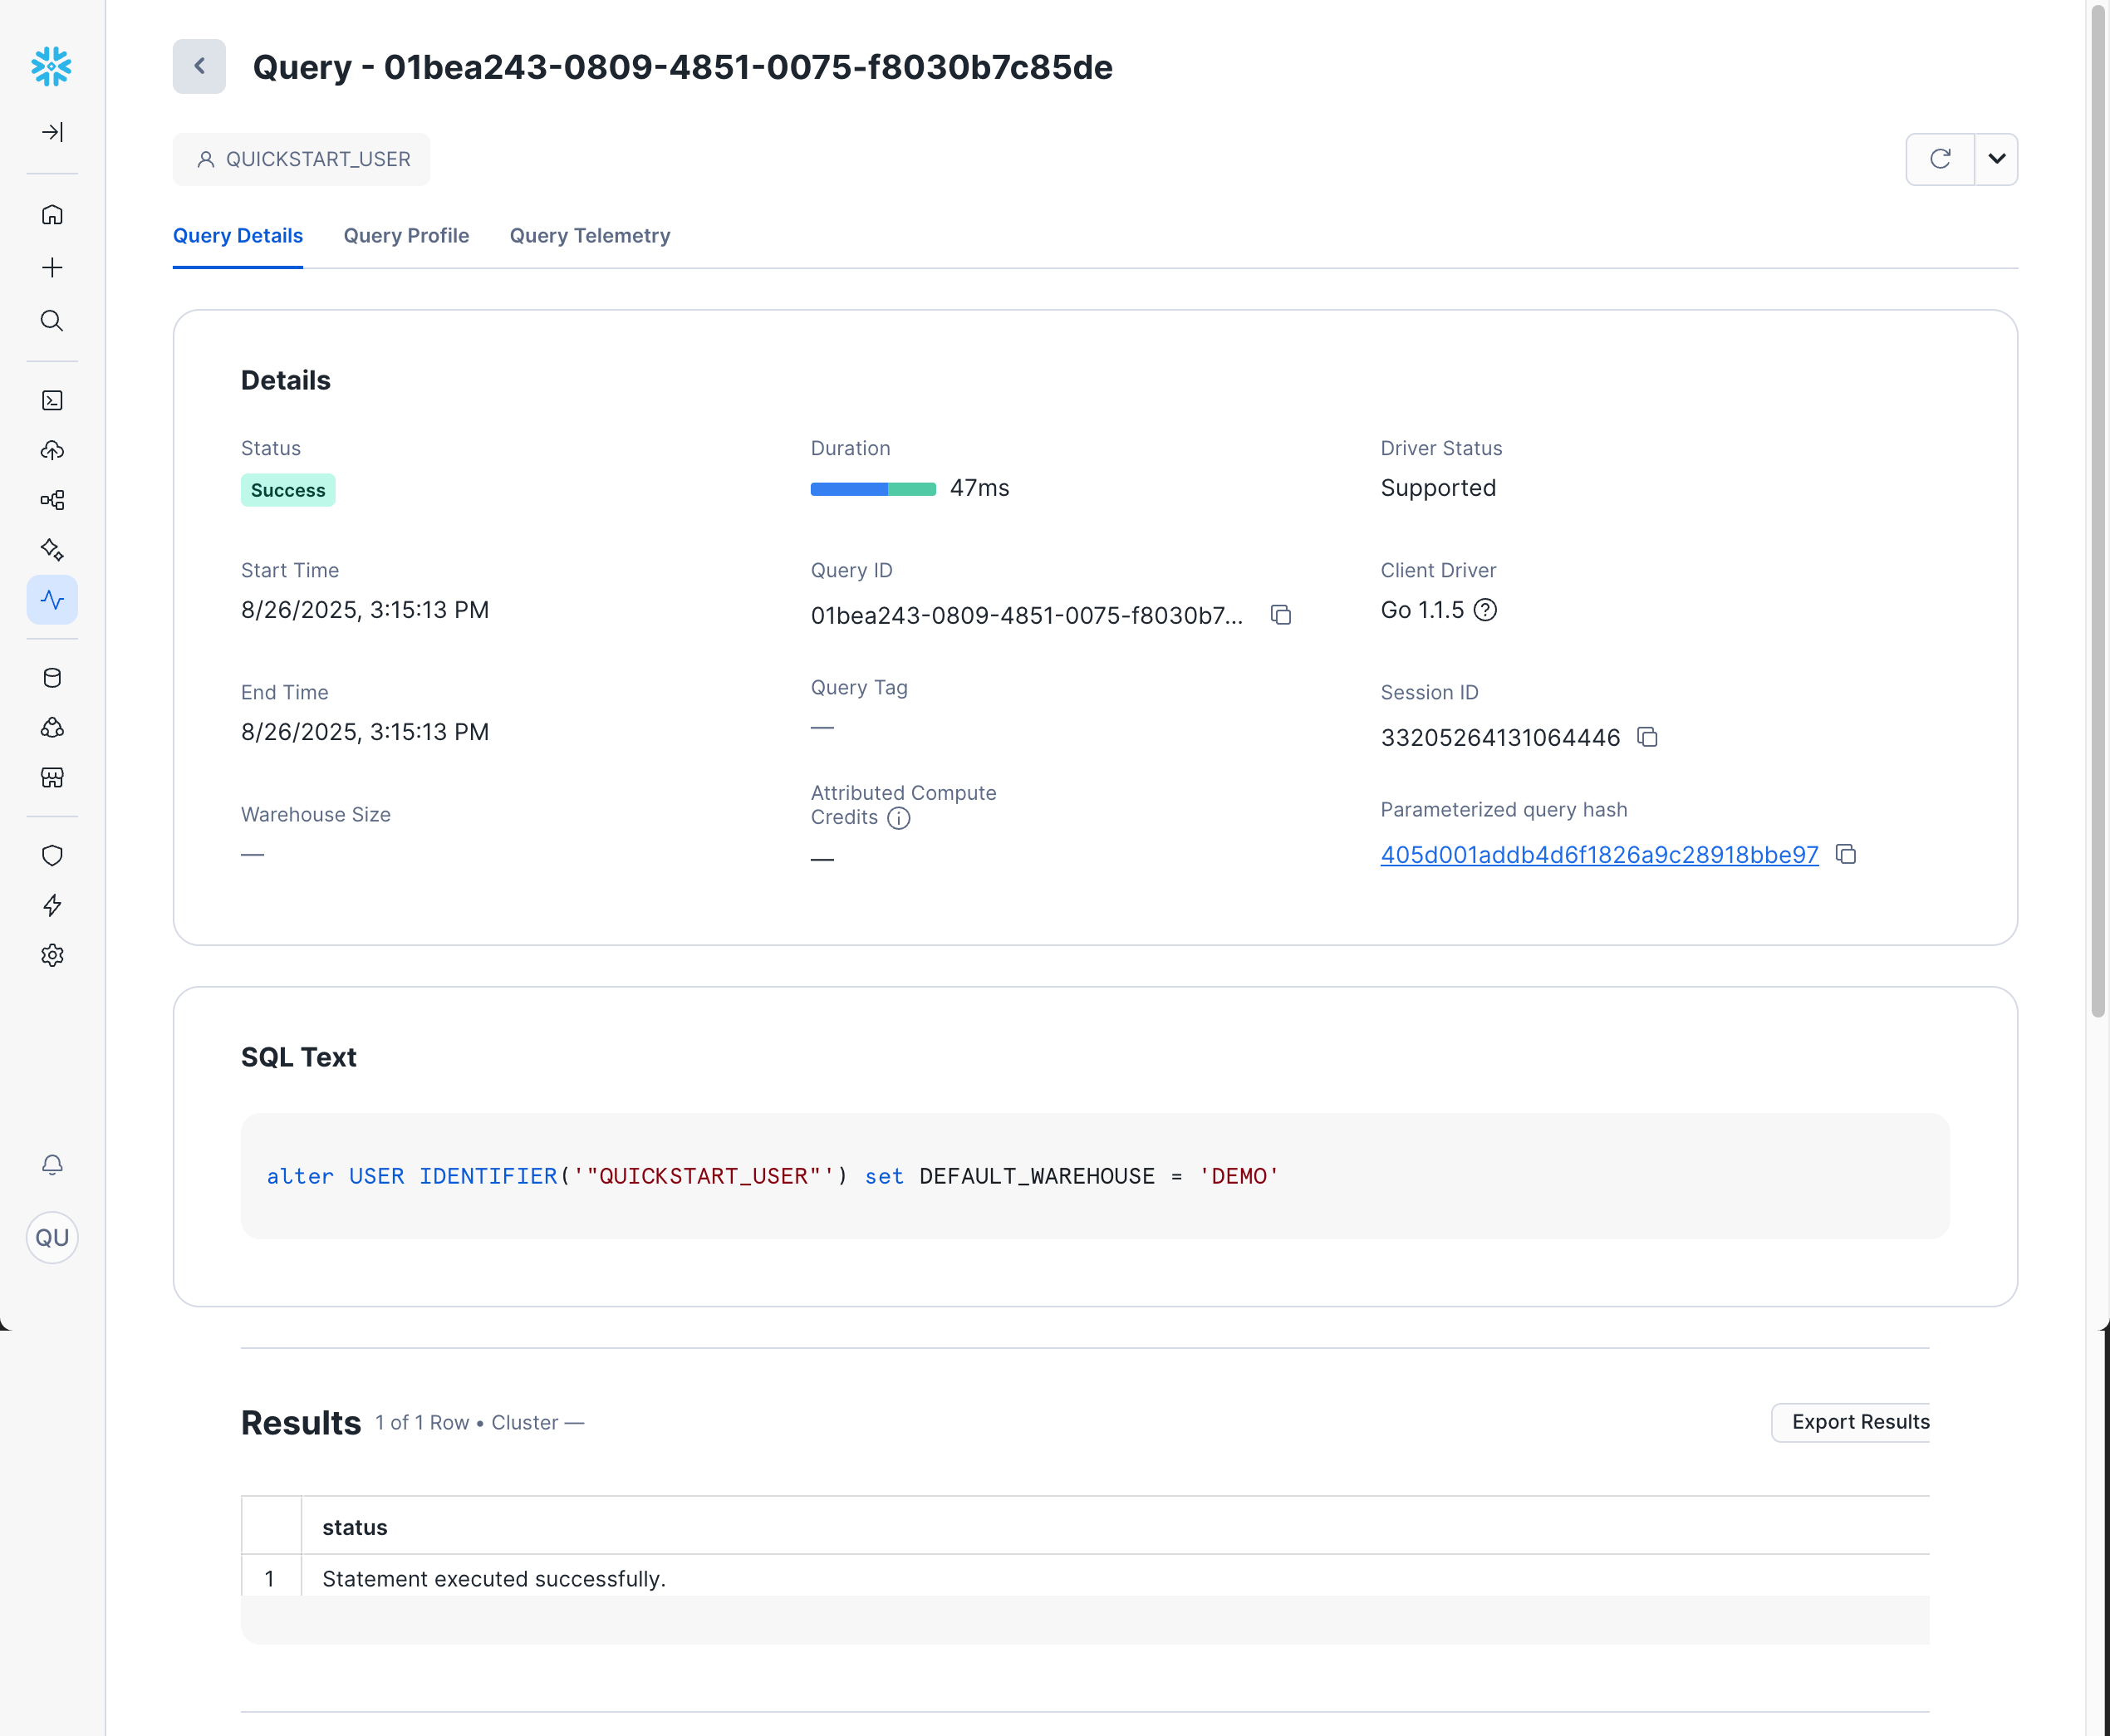
When you click on any query in the history, you'll see three main tabs with detailed information:
Query Details
The Query Details tab shows details about the query run (status, duration, ID, etc), the SQL text of the query run, and the query results.
By default, the query text for failed queries is redacted. You can change this behavior by following the following KB article: SQL text is showing redacted for failed queries.
Query Profile
The Query Profile tab provides a visual representation of query execution, which provides critical details for debugging and optimizing complex queries.
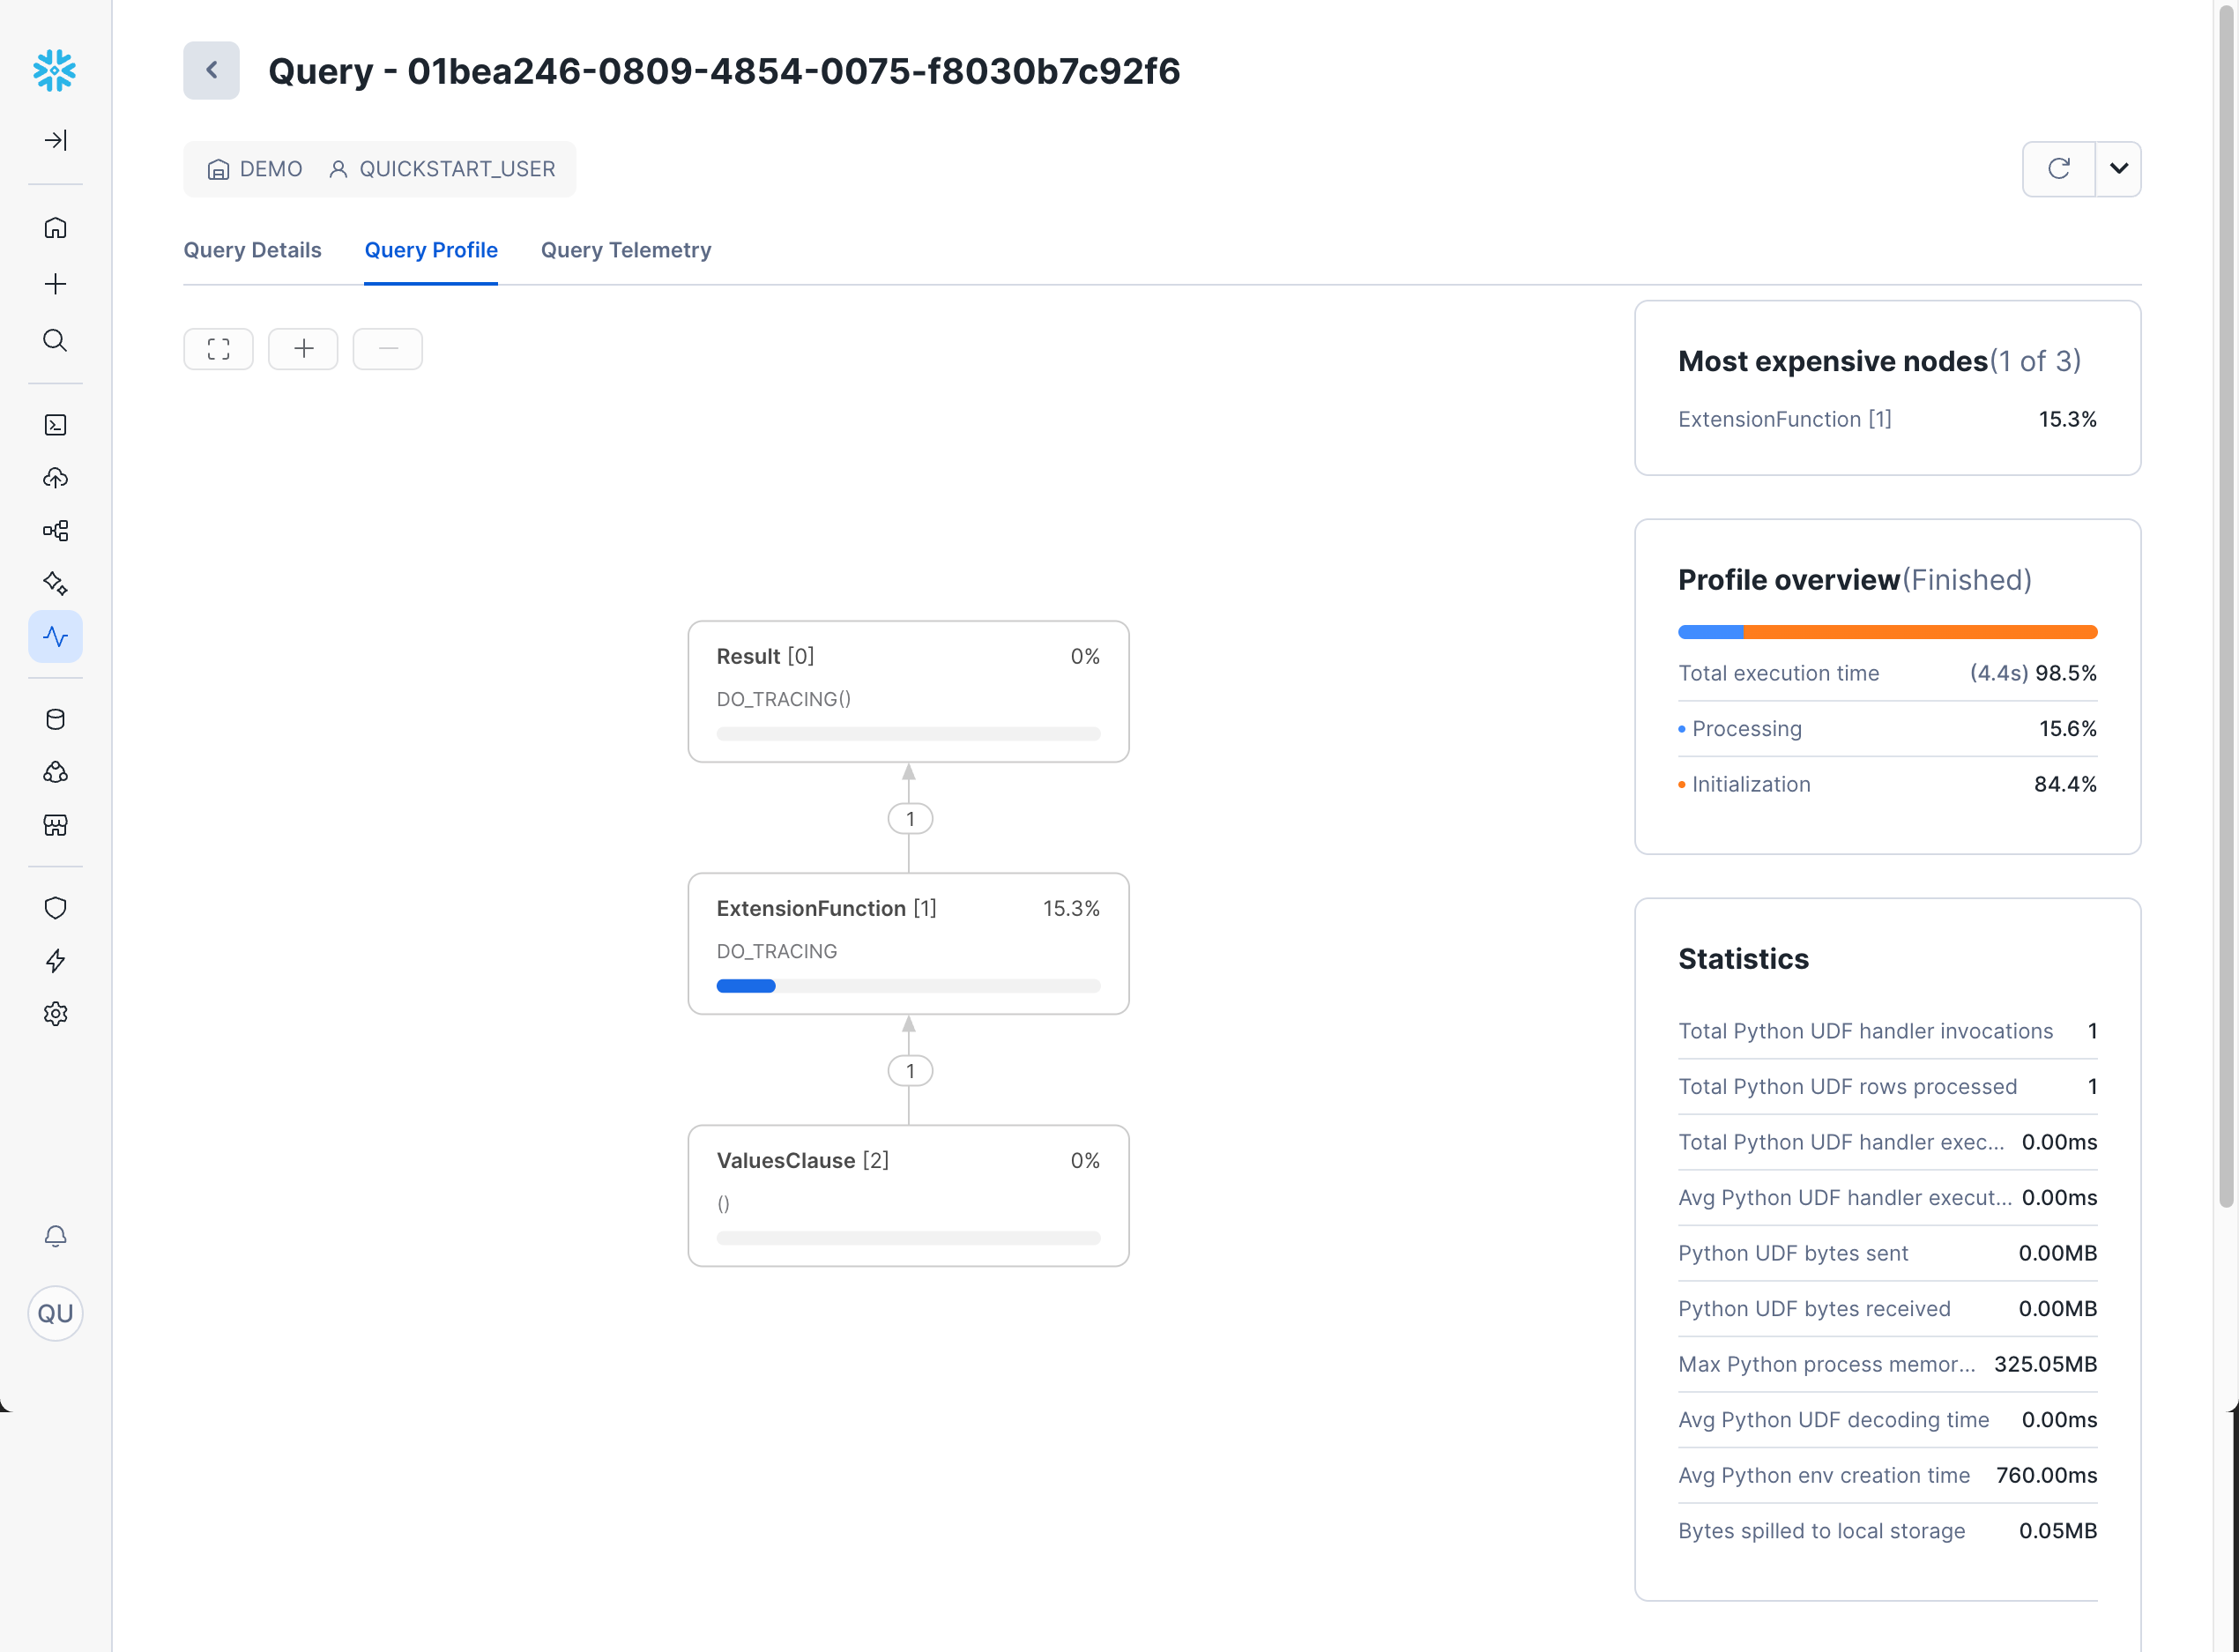
For a list of all possible fields, see the documentation here.
The Query Profile is essential for query optimization. Look for:
- Steps with the highest percentage of total time
- Large data movements between nodes
- Inefficient join strategies
- Missing or unused indexes
Query Telemetry
The Query Telemetry tab shows the same telemetry data as the Trace Explorer.
Accessing Grouped Query History in Snowsight
Snowsight also provides Grouped Query History, which aggregates similar queries together:
- Navigate to Monitoring » Query History
- Click on the Grouped Queries tab
This feature helps you:
- Identify the most frequently executed query patterns
- See aggregate performance metrics across similar queries
- Spot trends in query execution patterns
- Focus optimization efforts on the most impactful queries
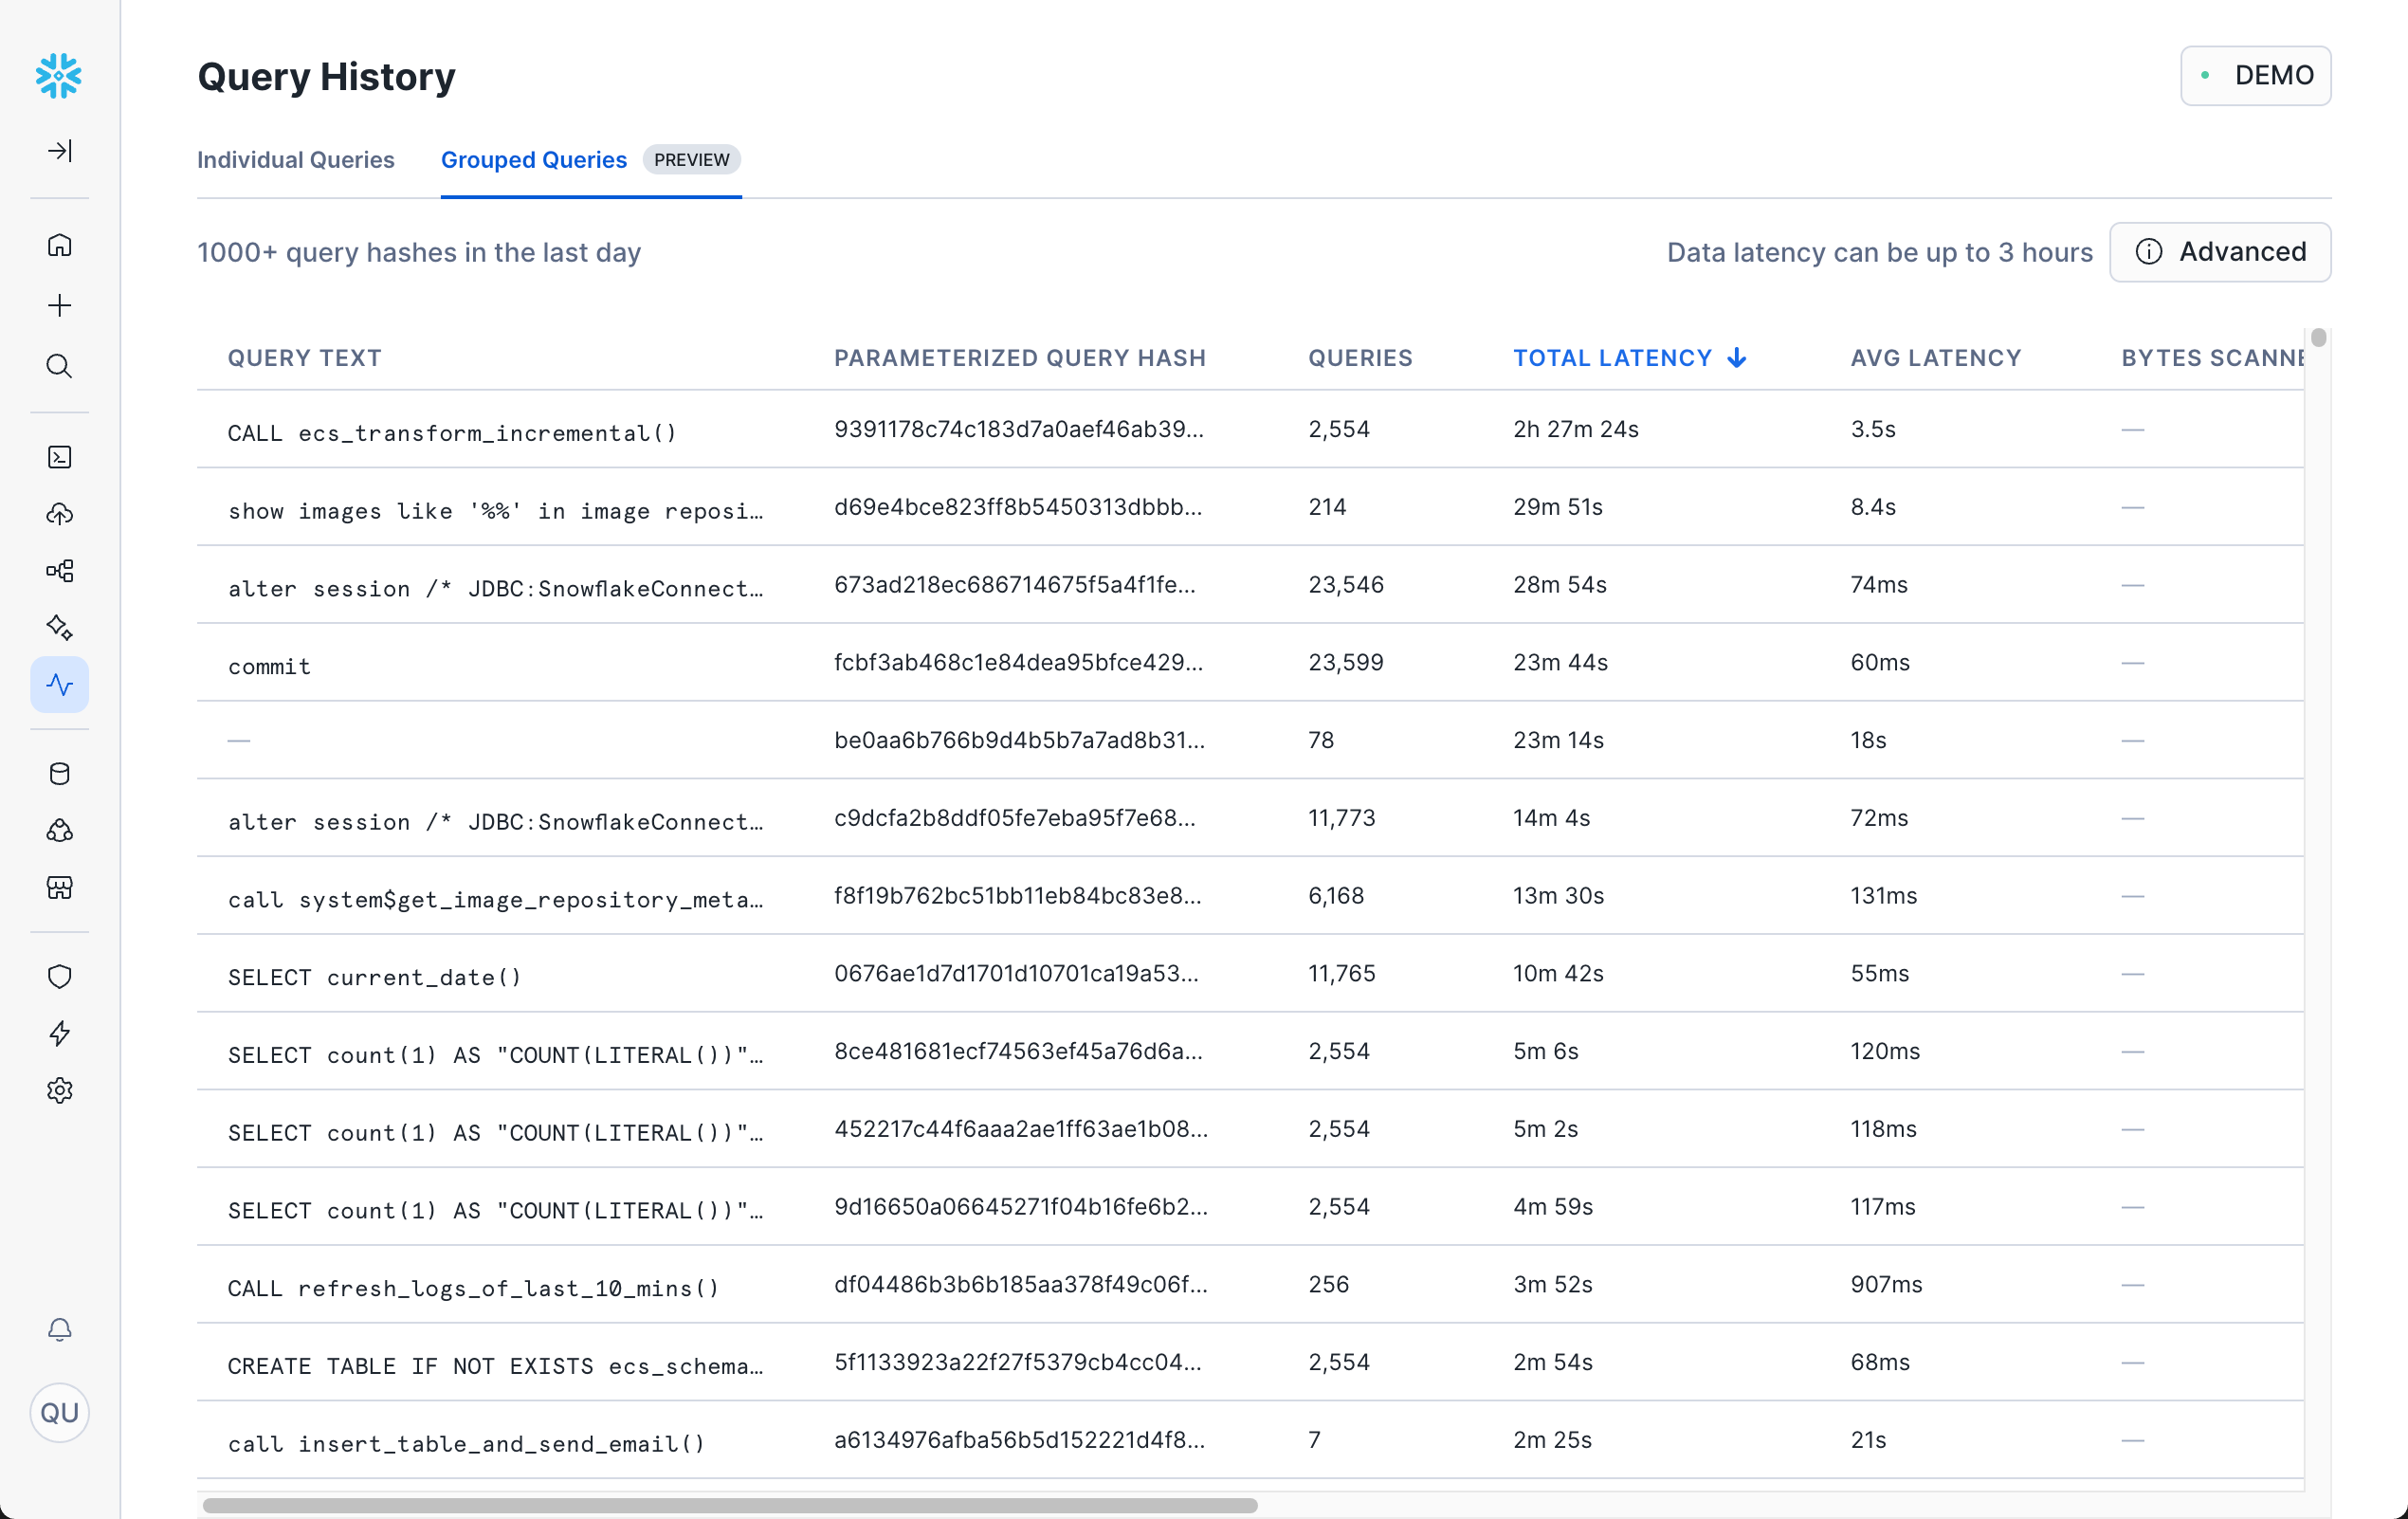
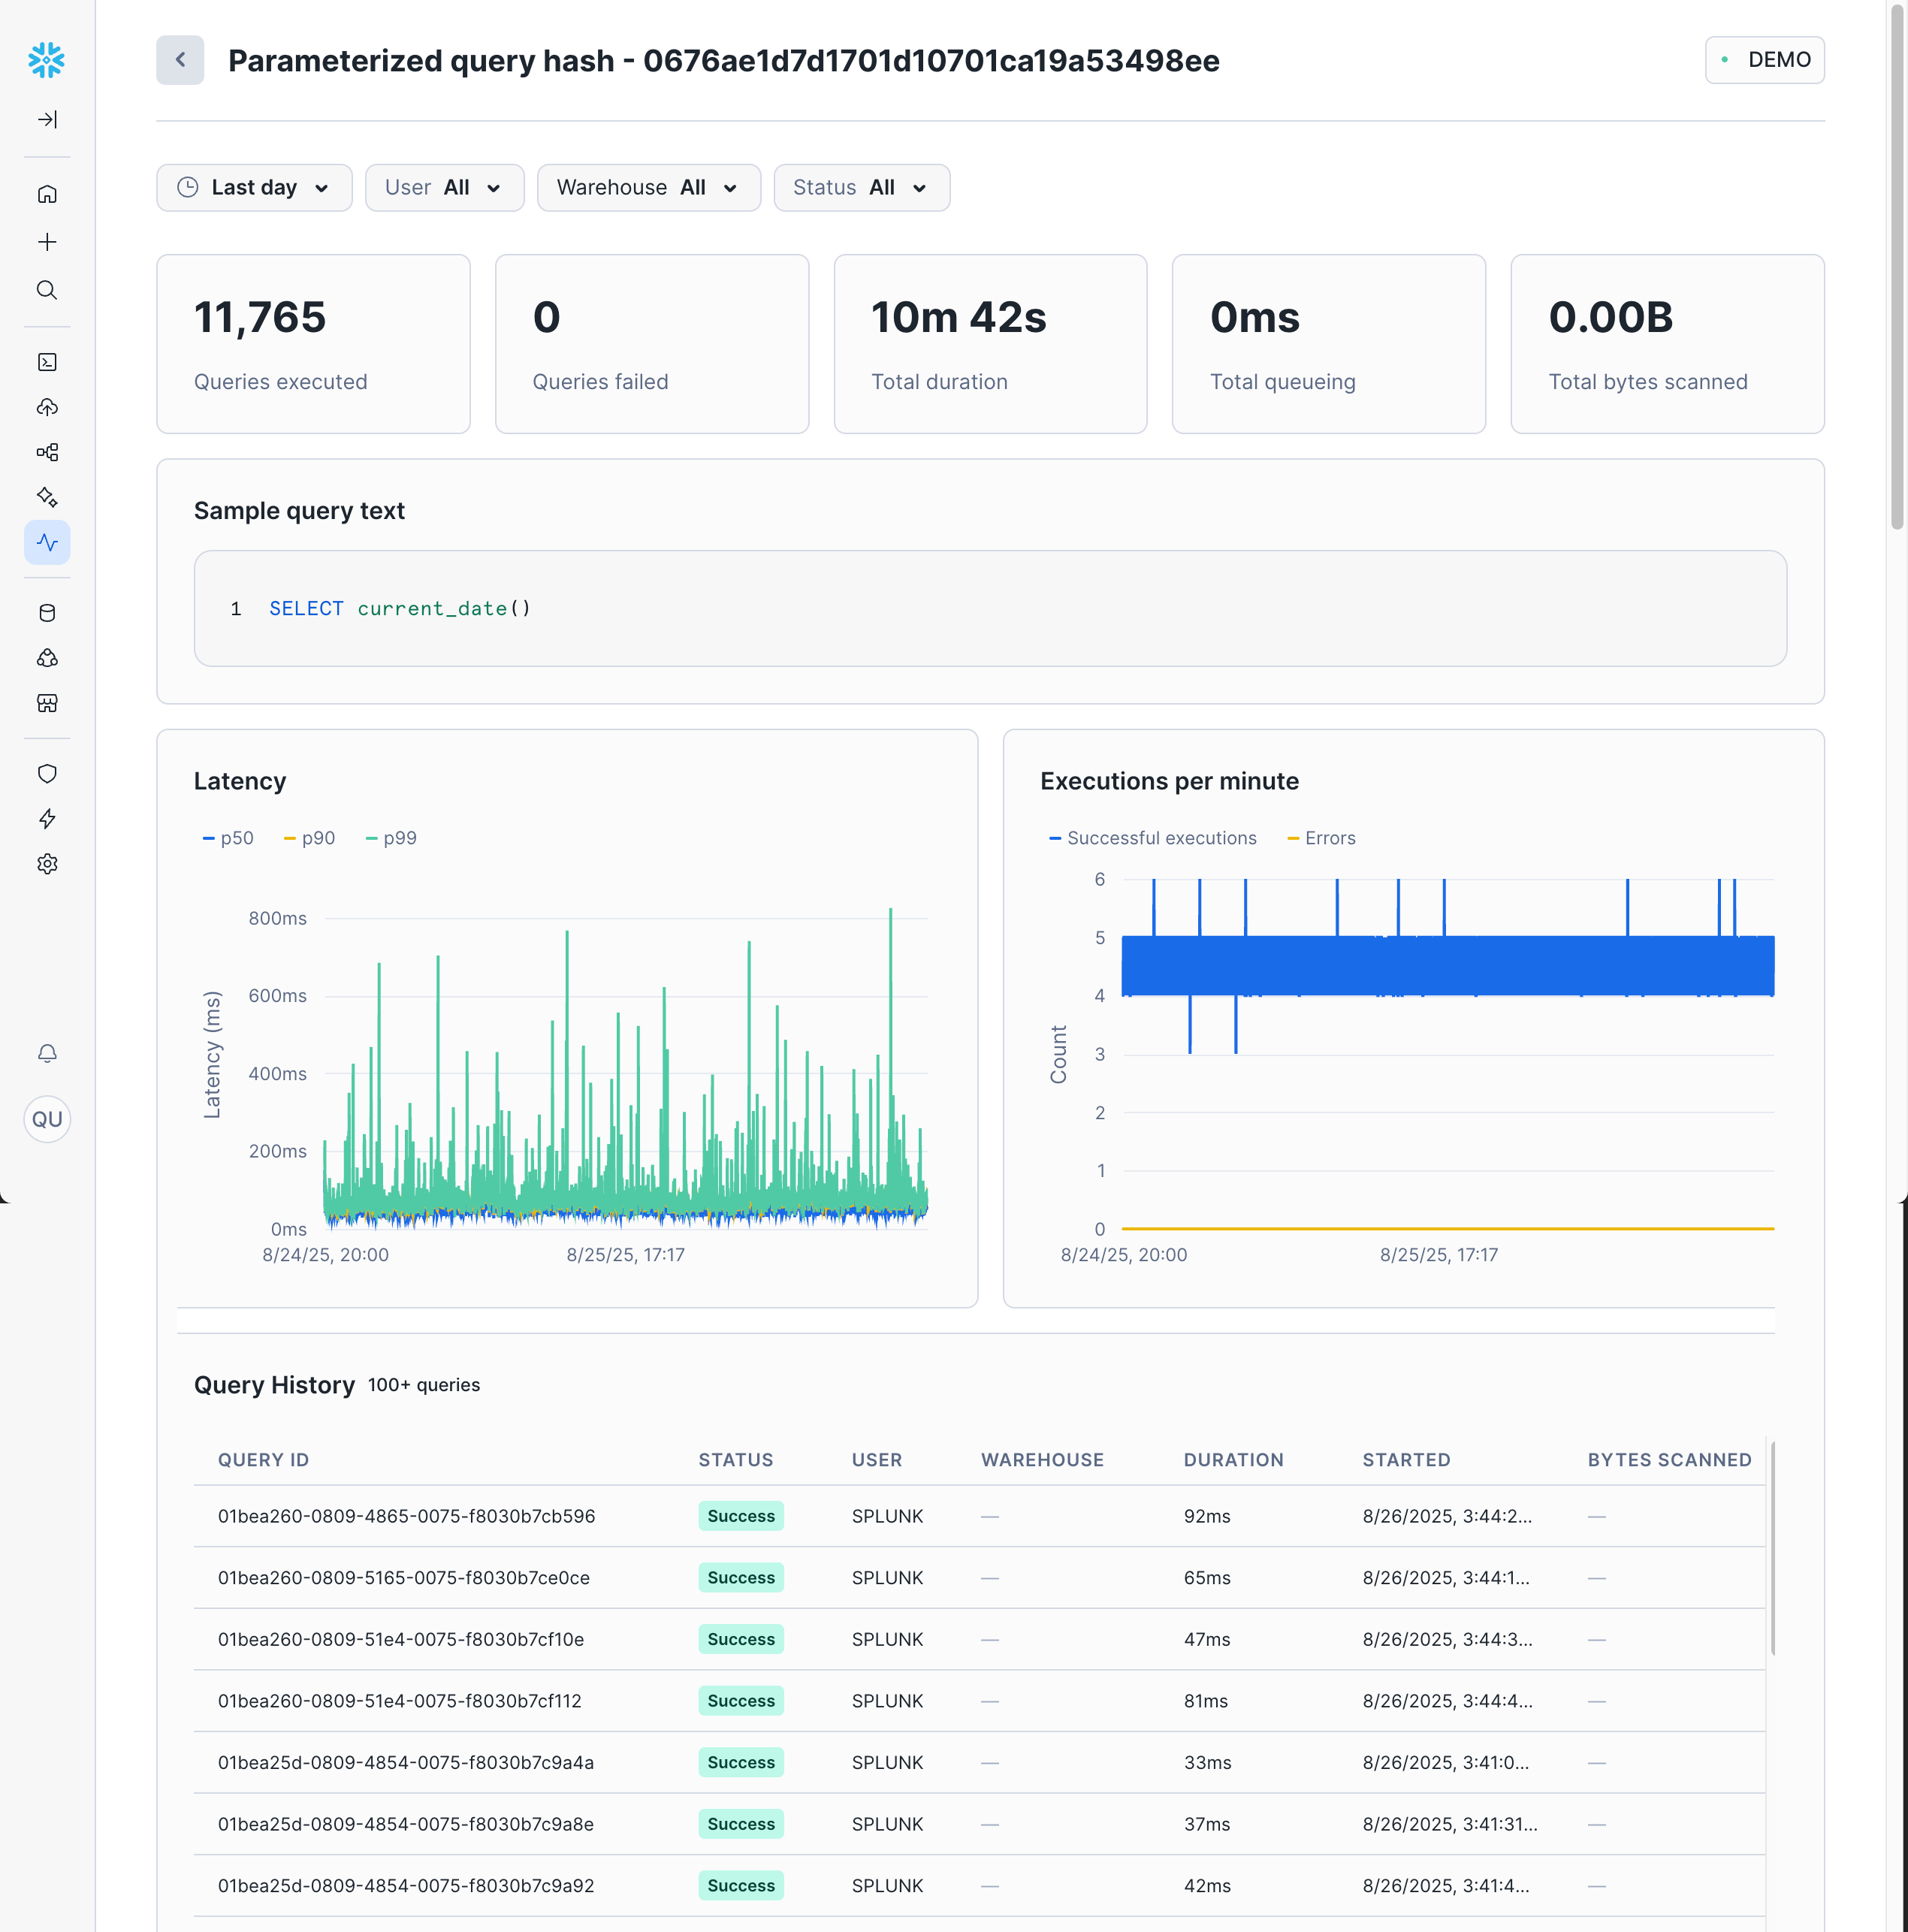
By clicking into a single grouped query, you can see detailed information about execution count, duration, and more.
Additional Resources
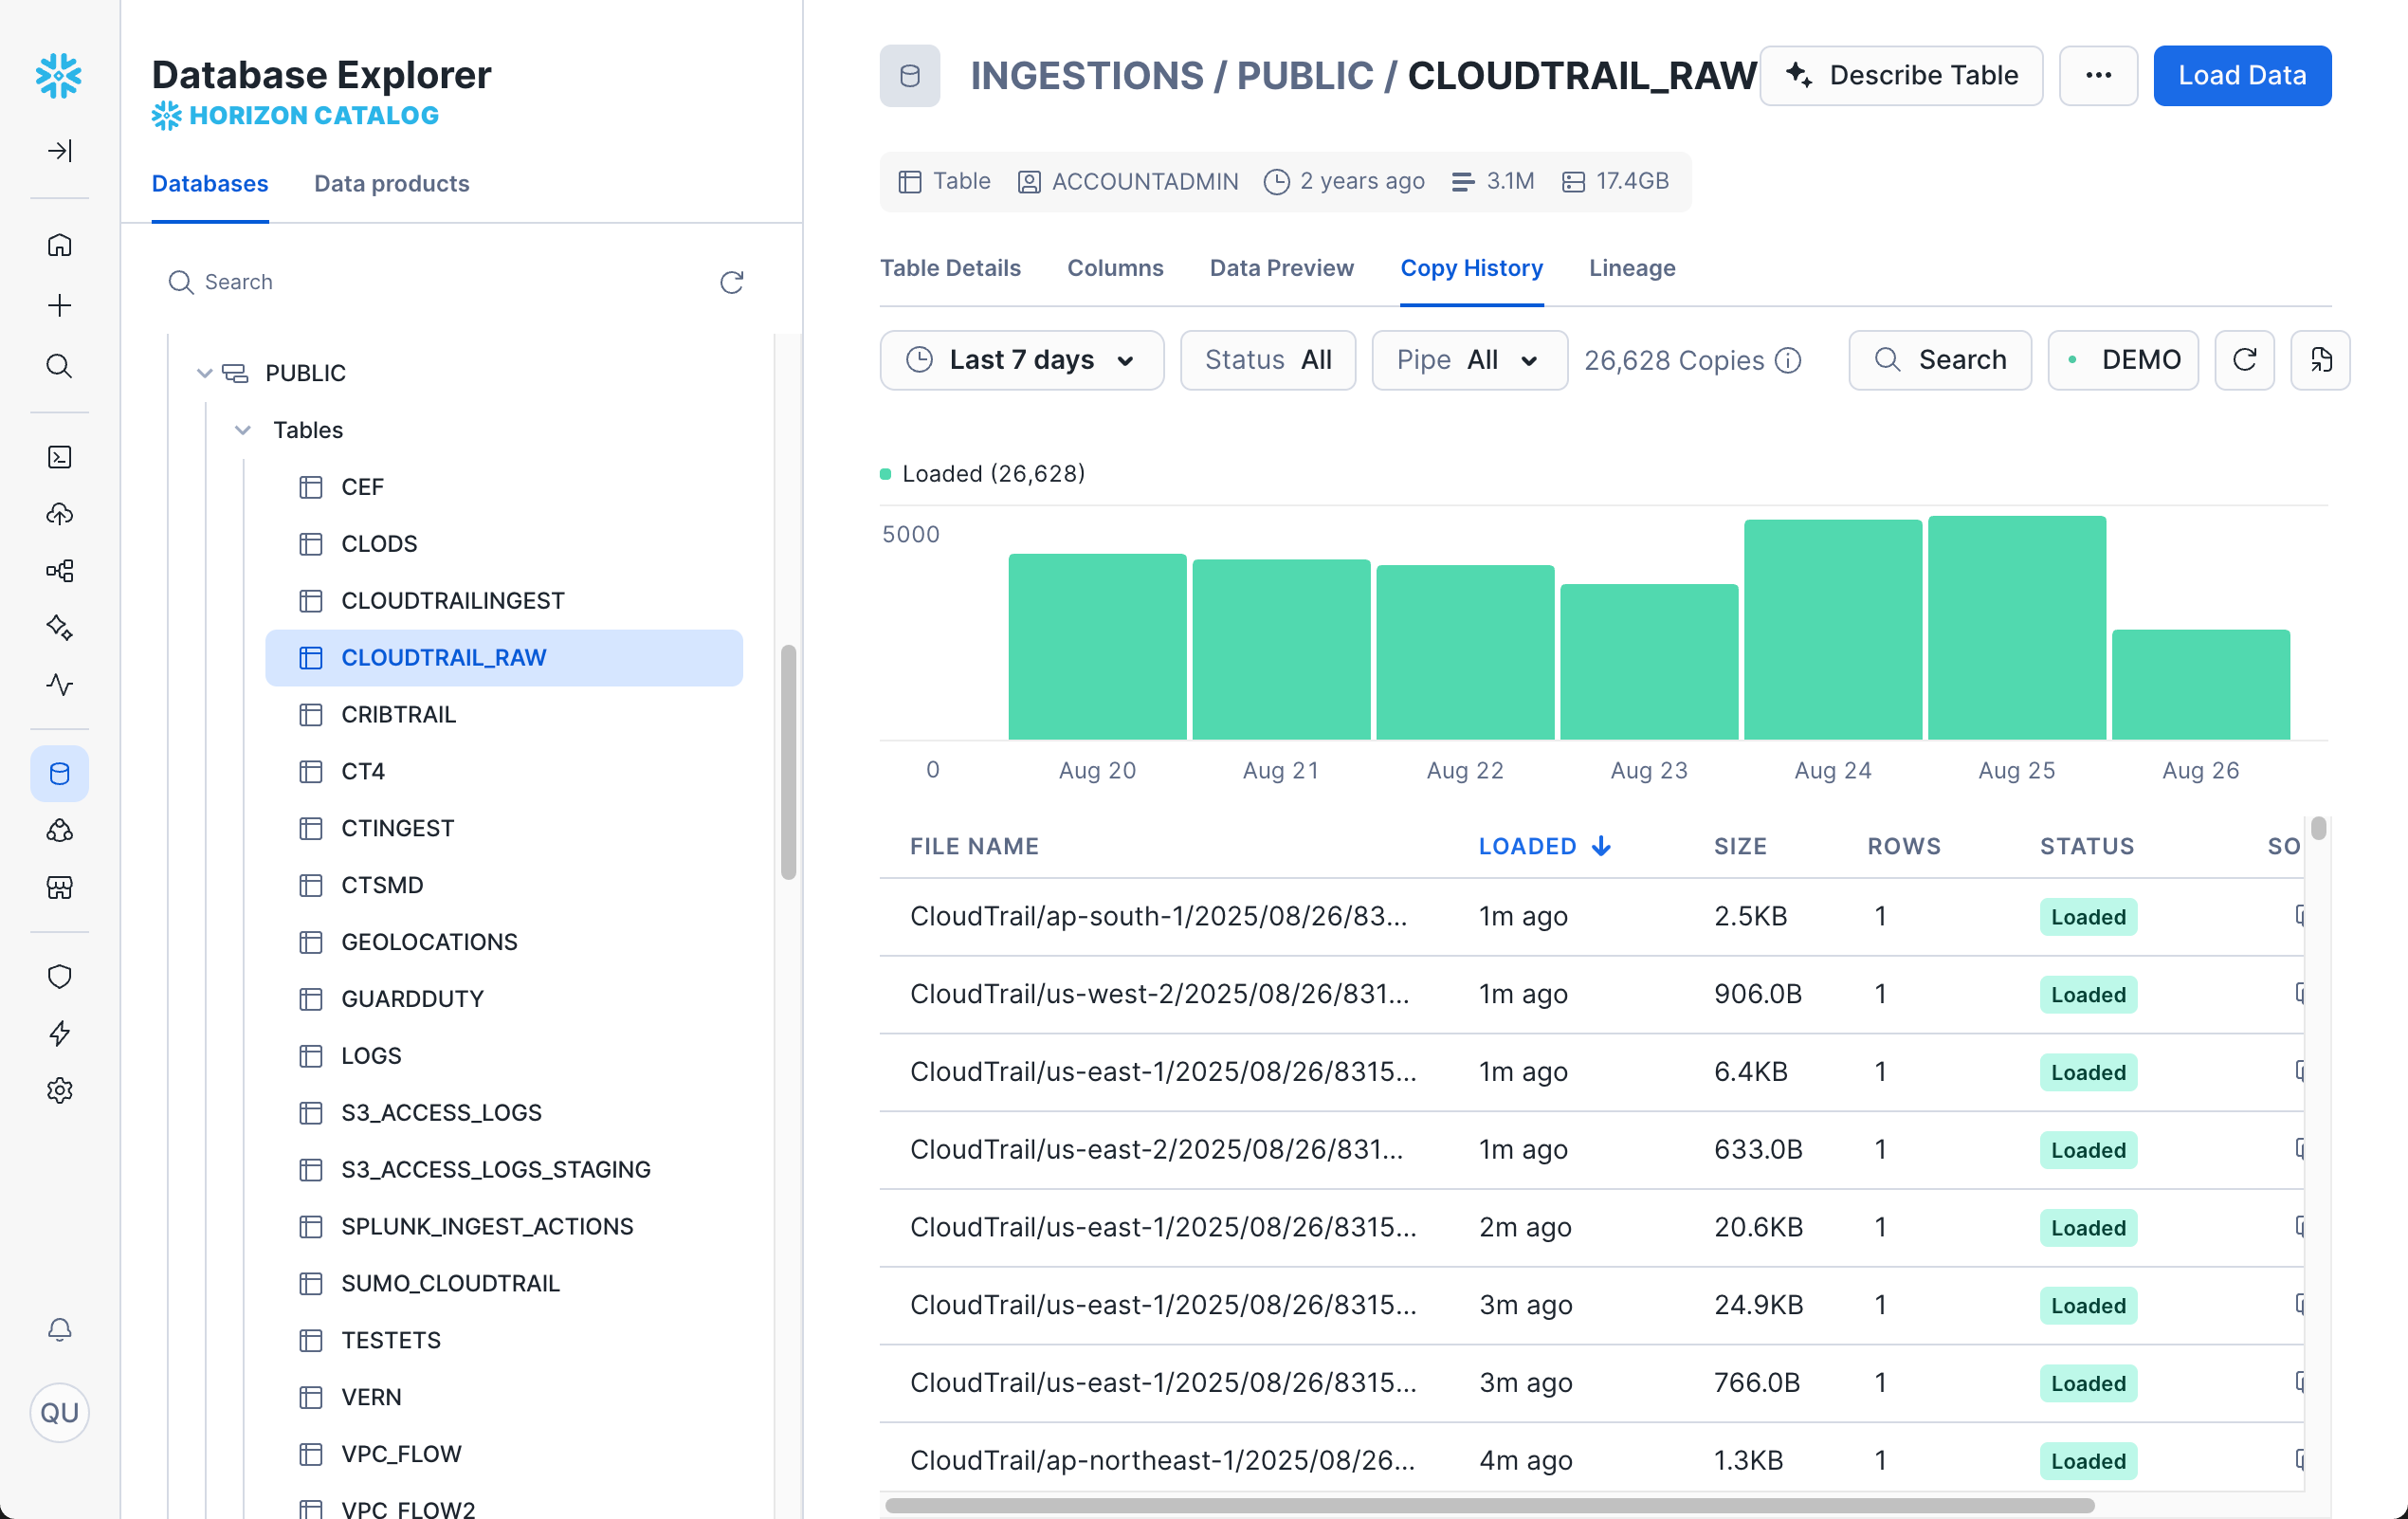
Copy History
Copy History provides comprehensive monitoring for all data loading activities in your Snowflake account. It tracks operations from COPY INTO commands, Snowpipe, and Snowpipe Streaming, giving you visibility into data ingestion performance, errors, and throughput patterns.
Why Copy History Is Useful
Copy History helps you:
- Monitor data loading performance and identify bottlenecks
- Track successful and failed data loading operations
- Analyze data ingestion patterns and volume trends
- Troubleshoot data loading errors and validation issues
- Optimize data loading strategies and warehouse sizing
- Audit data ingestion activities across your organization
Accessing Copy History in Snowsight
To view Copy History in Snowsight:
- Navigate to Ingestion » Copy History
- (Optional) Use the filters to narrow down activity by status, database, pipe, and more.
Copy Operations
Each copy operation entry shows details such as status, target table, pipe, data size, and number of rows loaded.
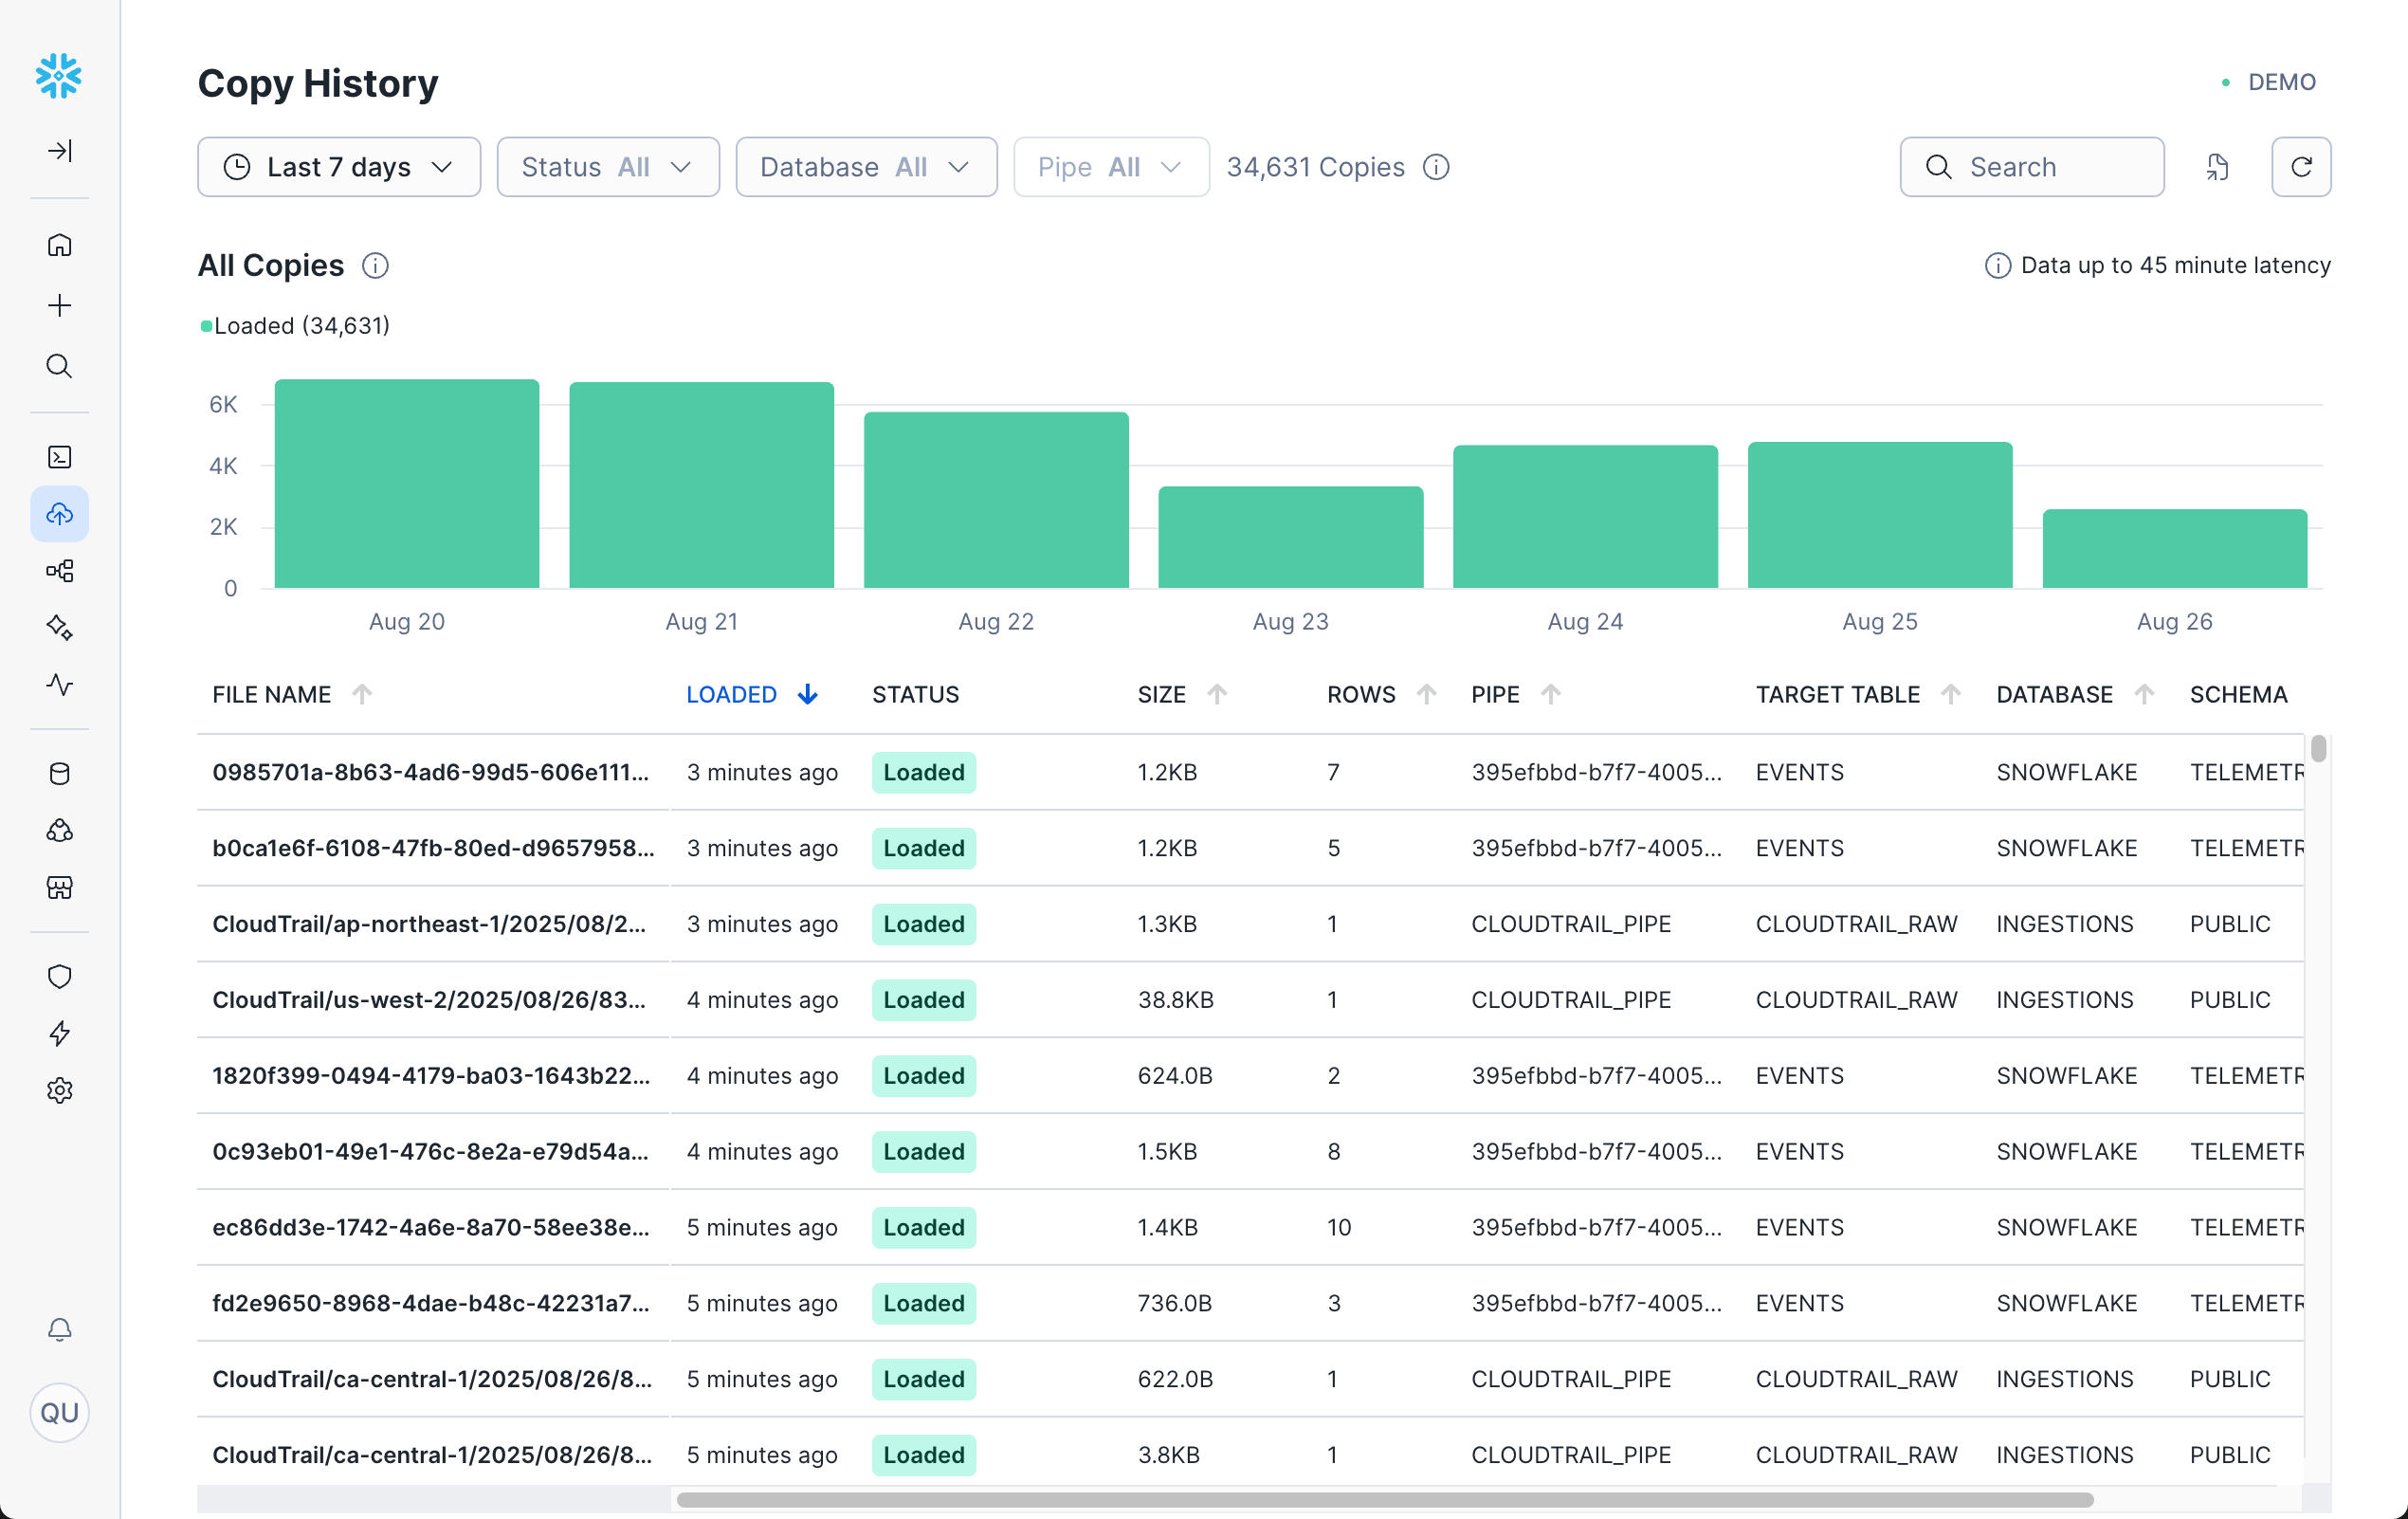
Click on any operation to see detailed information about that operation/target table, such as individual file details and status.
If you don't see any copy history, you'll need to perform data loading operations (
COPY INTO, Snowpipe, or Snowpipe Streaming).For a complete walkthrough with examples, see ONE of the following:
Additional Resources
Task History
Task History provides monitoring and observability for Snowflake Tasks, which are scheduled SQL statements or procedures that run automatically. Tasks are essential for building data pipelines, ETL processes, and automated maintenance operations. Task History helps you monitor task execution, troubleshoot failures, and optimize task performance.
Why Task History Is Useful
Task History helps you:
- Monitor task execution success and failure rates
- Track task performance and execution duration trends
- Troubleshoot failed tasks and identify error patterns
- Analyze task scheduling and dependency execution
- Optimize task graphs and pipeline performance
- Audit automated operations across your data pipelines
Accessing Task History in Snowsight
To view Task History in Snowsight:
- Navigate to Transformation » Tasks
- (Optional) Use the filters to narrow down activity by status, database, and more.
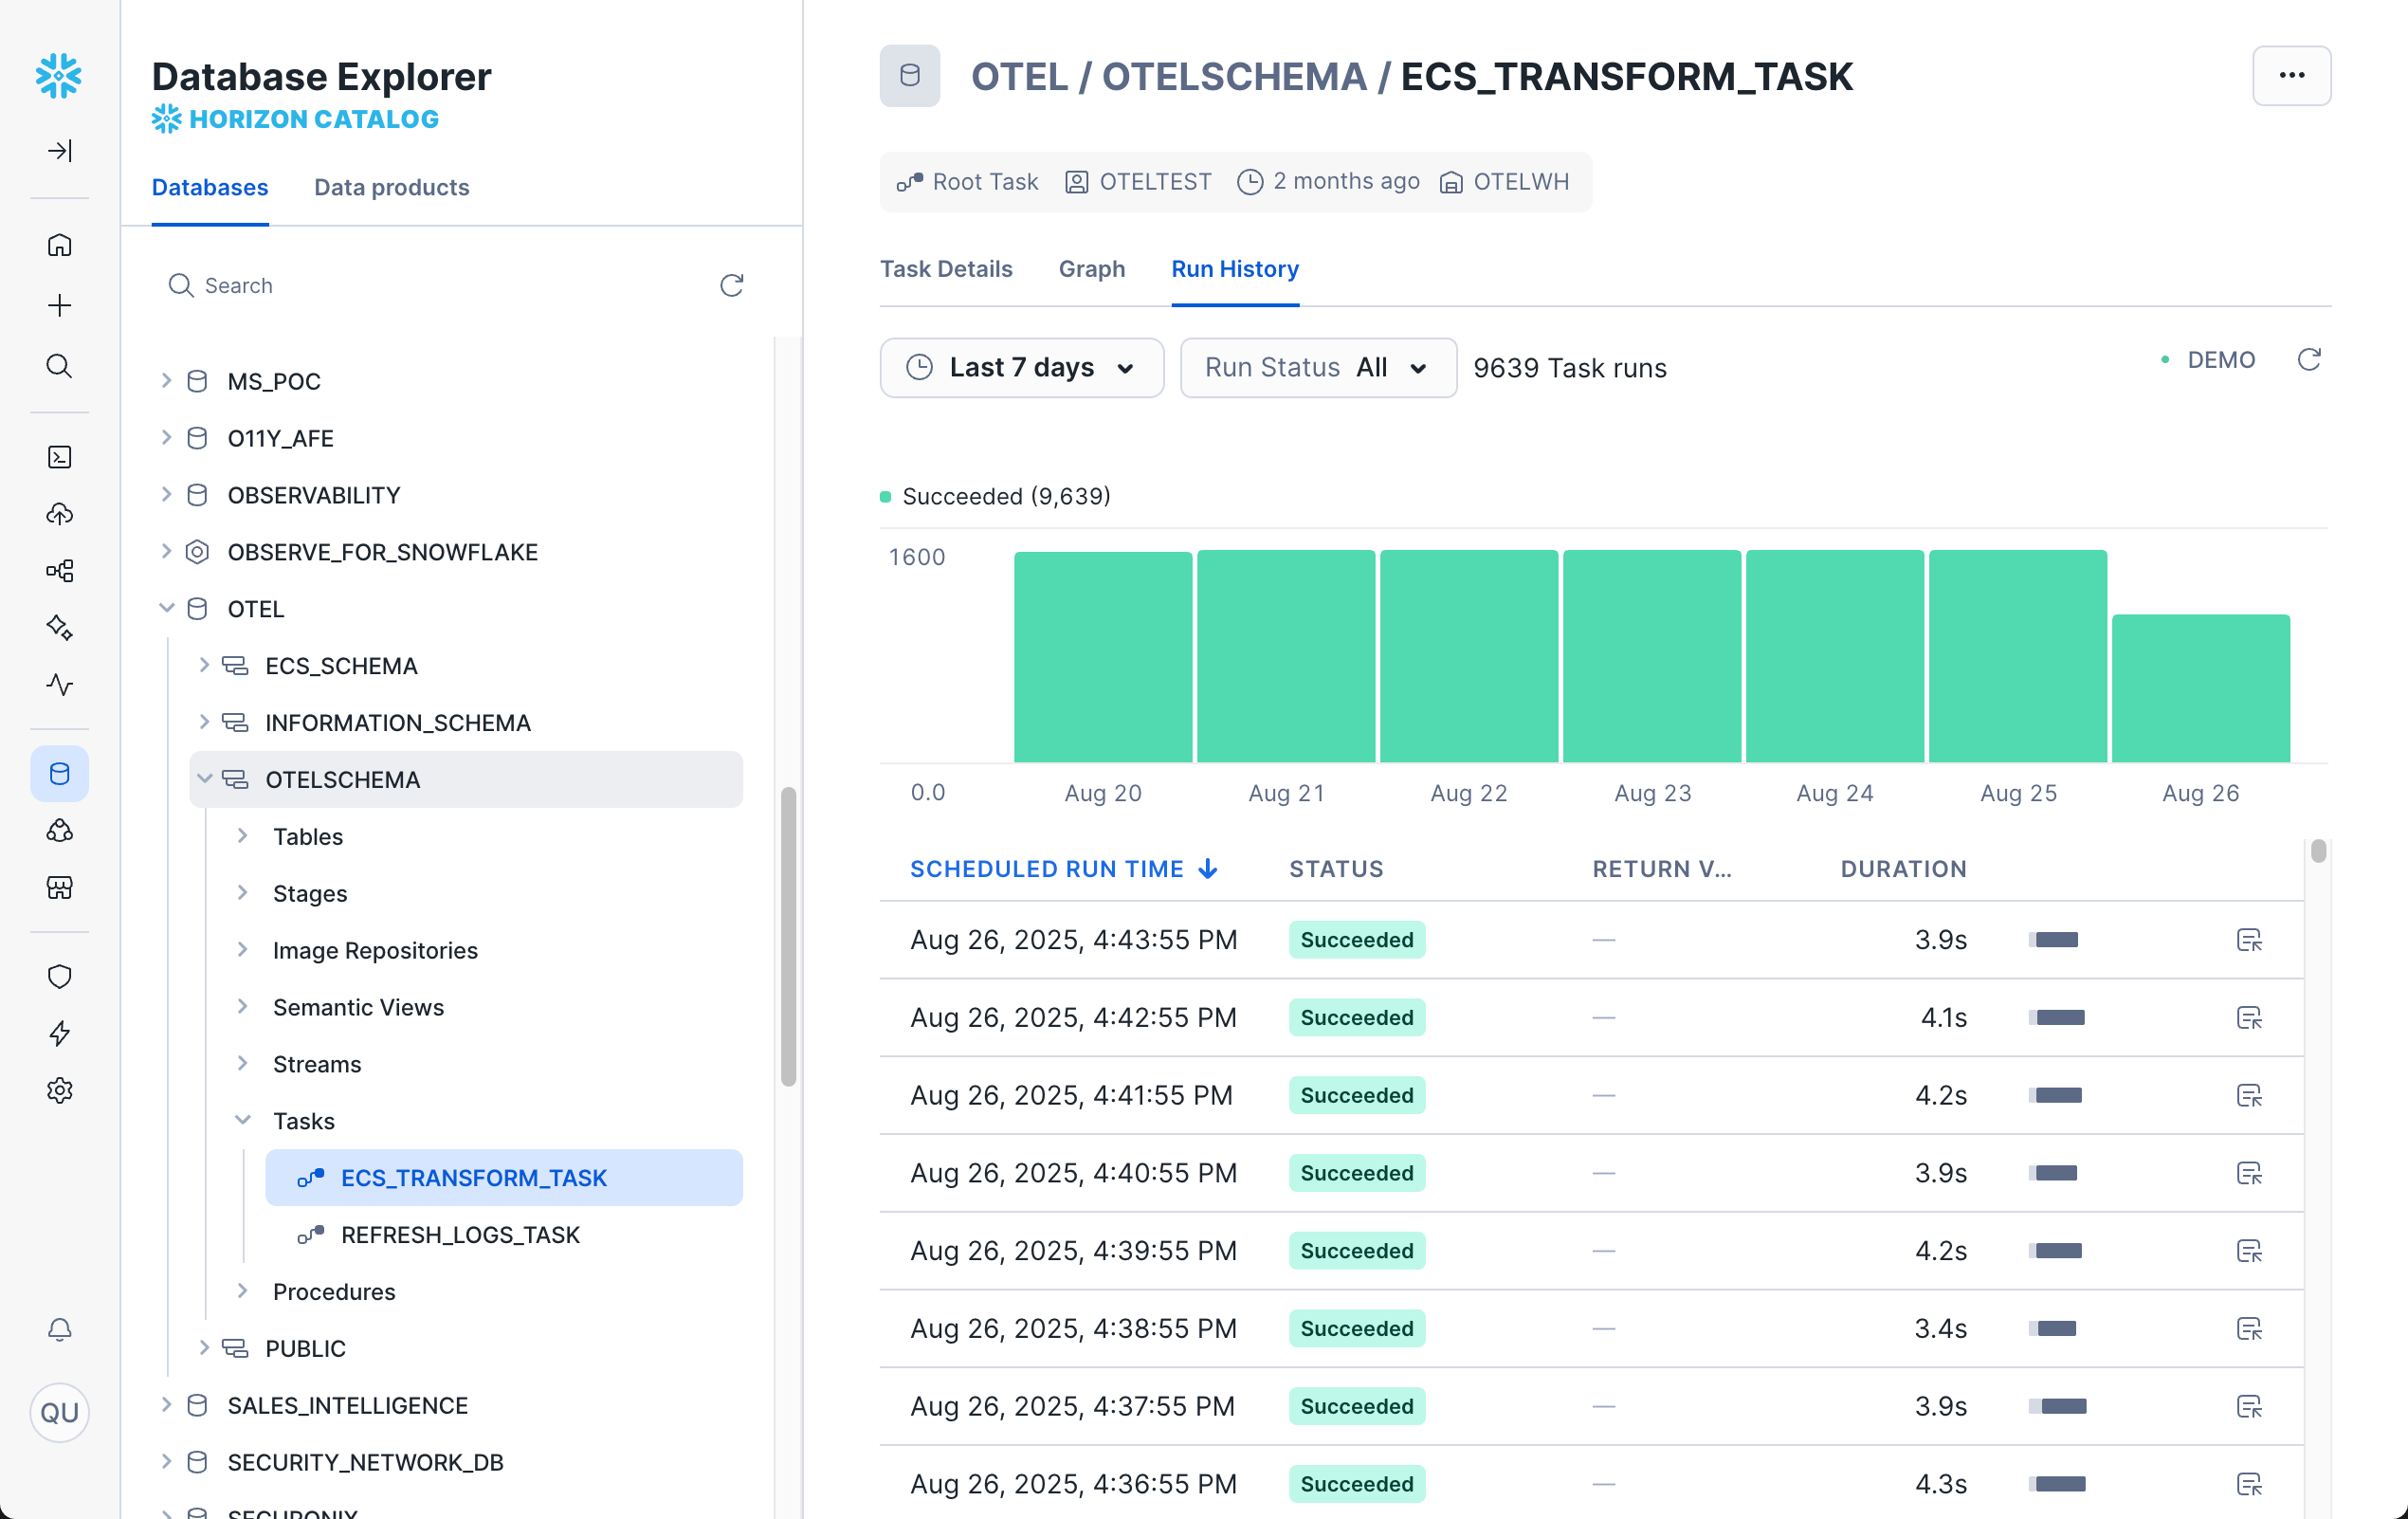
Task History can be viewed as either Task Graphs or Task Runs.
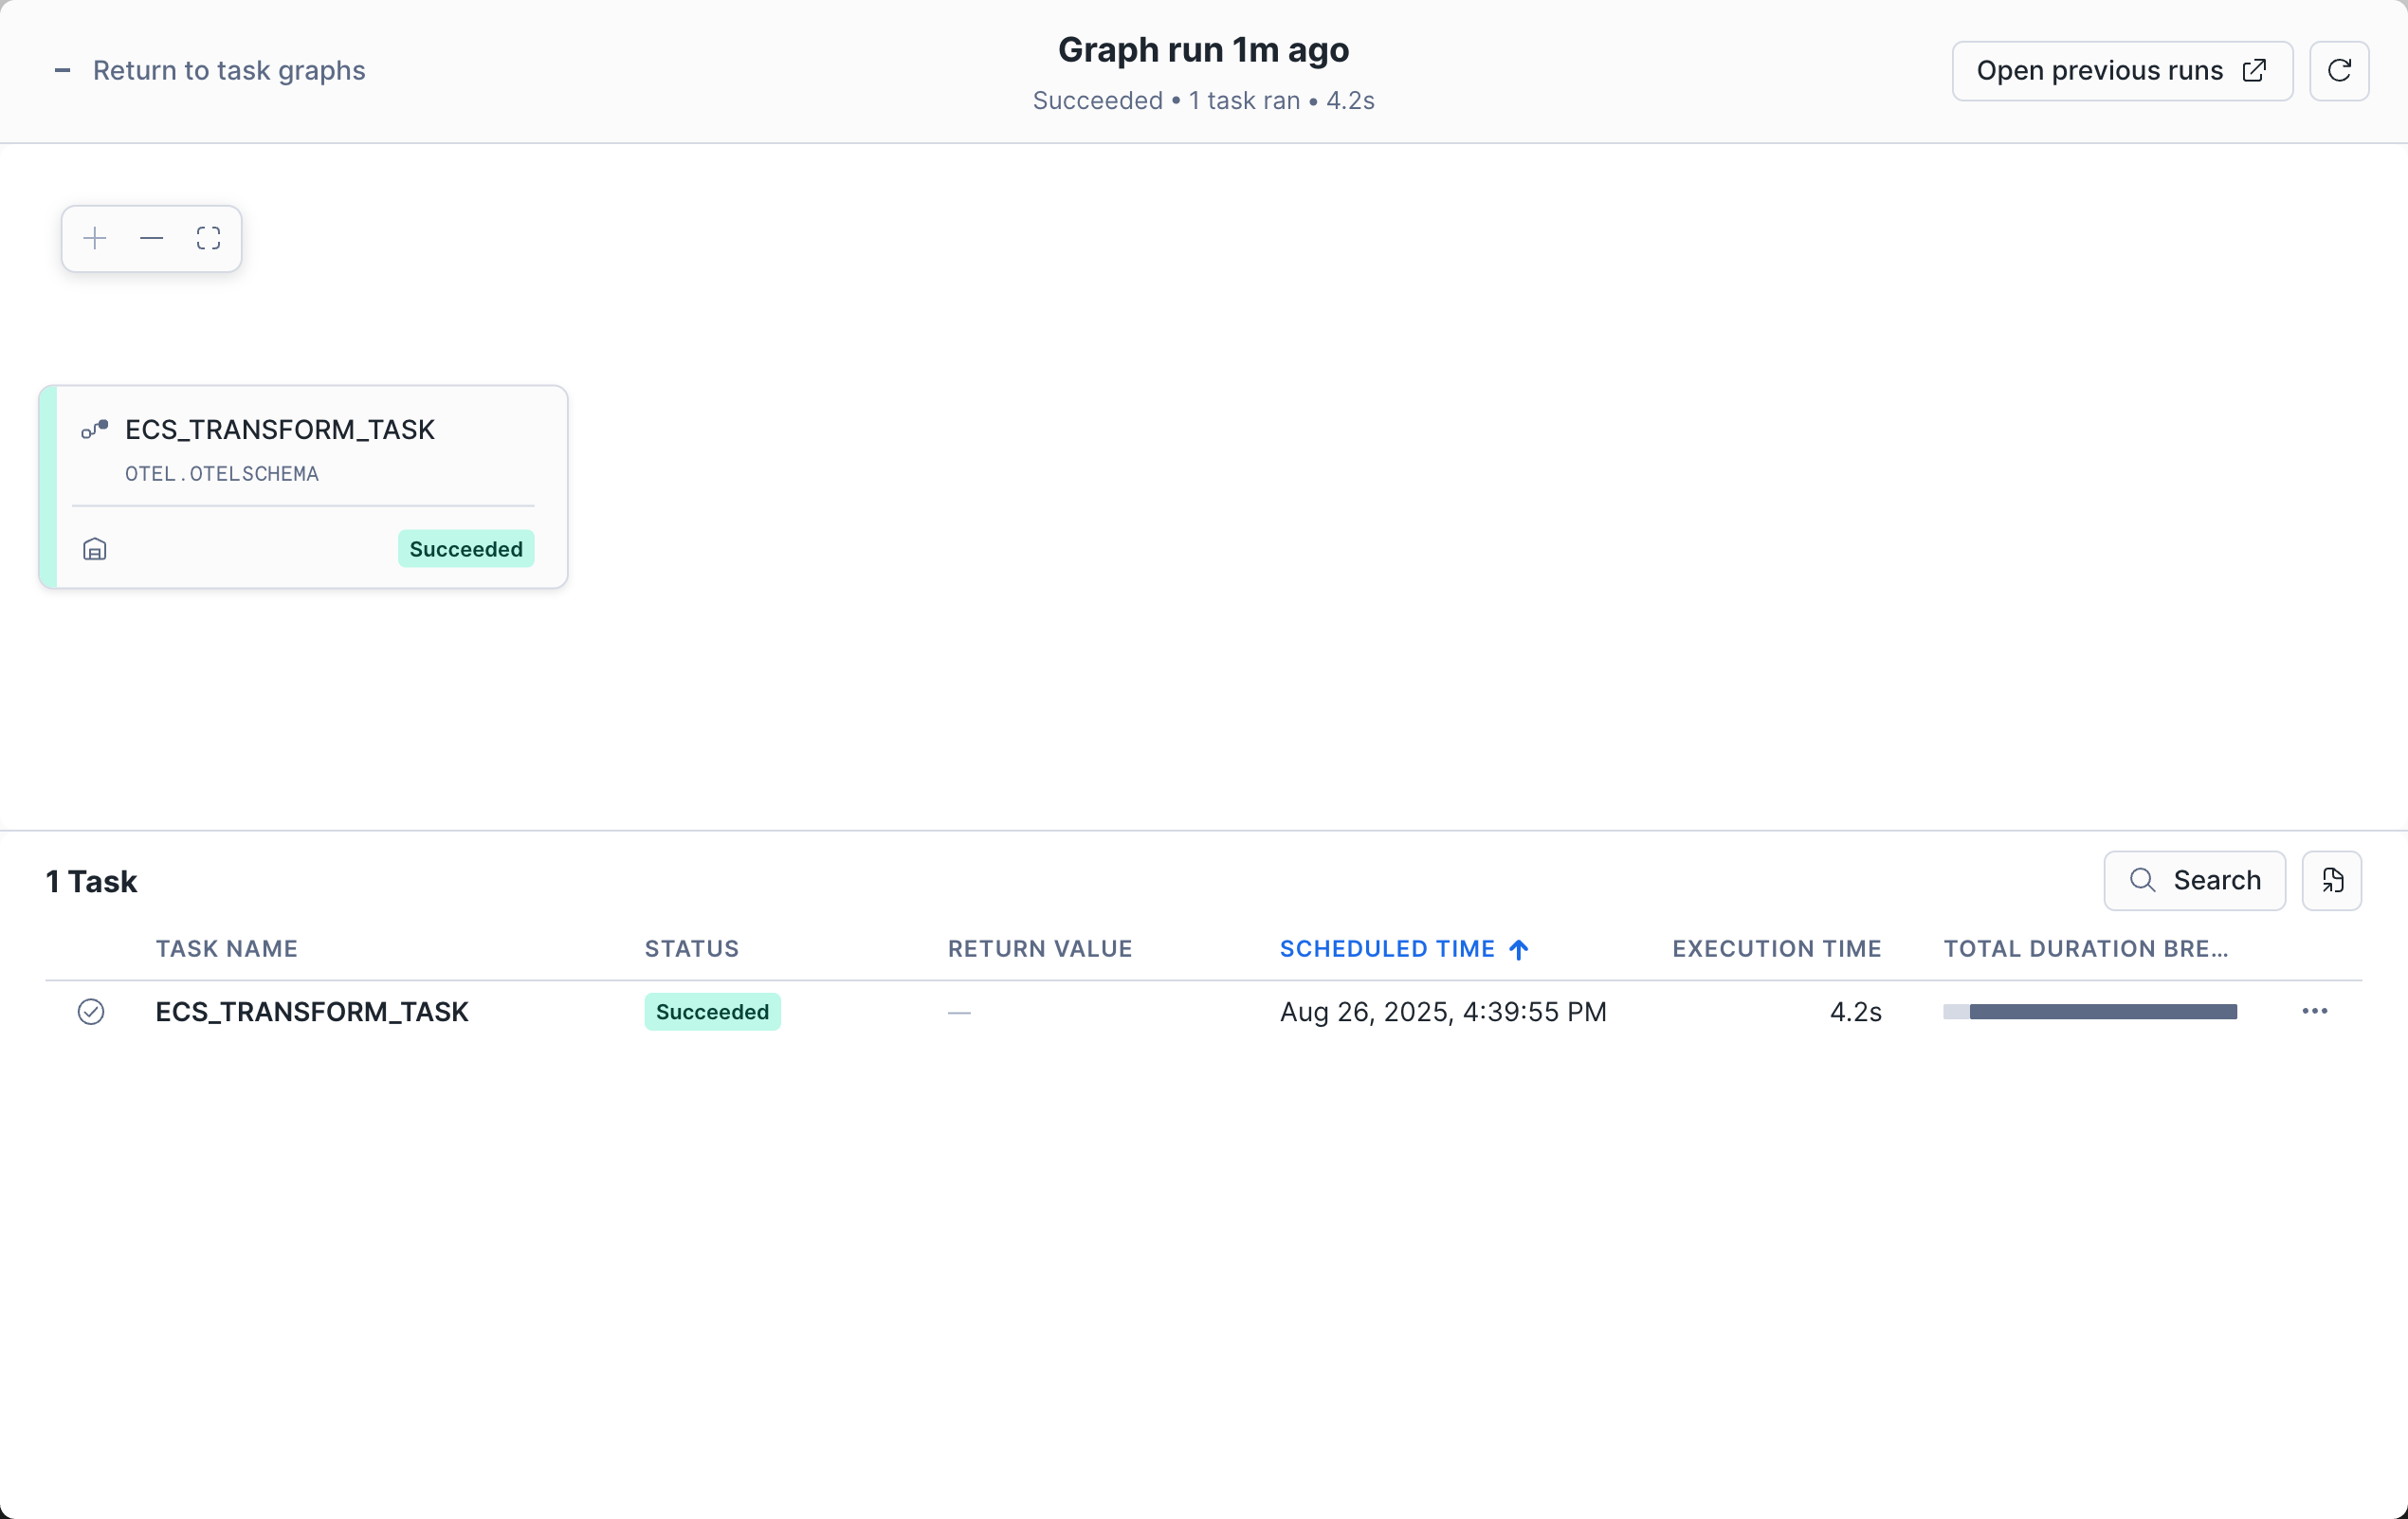
Task Graphs
The Task Graphs view groups related tasks together in a directed acyclic graph (DAG) that shows the relationship between the root task and any dependent tasks. Each row shows the root task name, schedule, recent run history, and more.
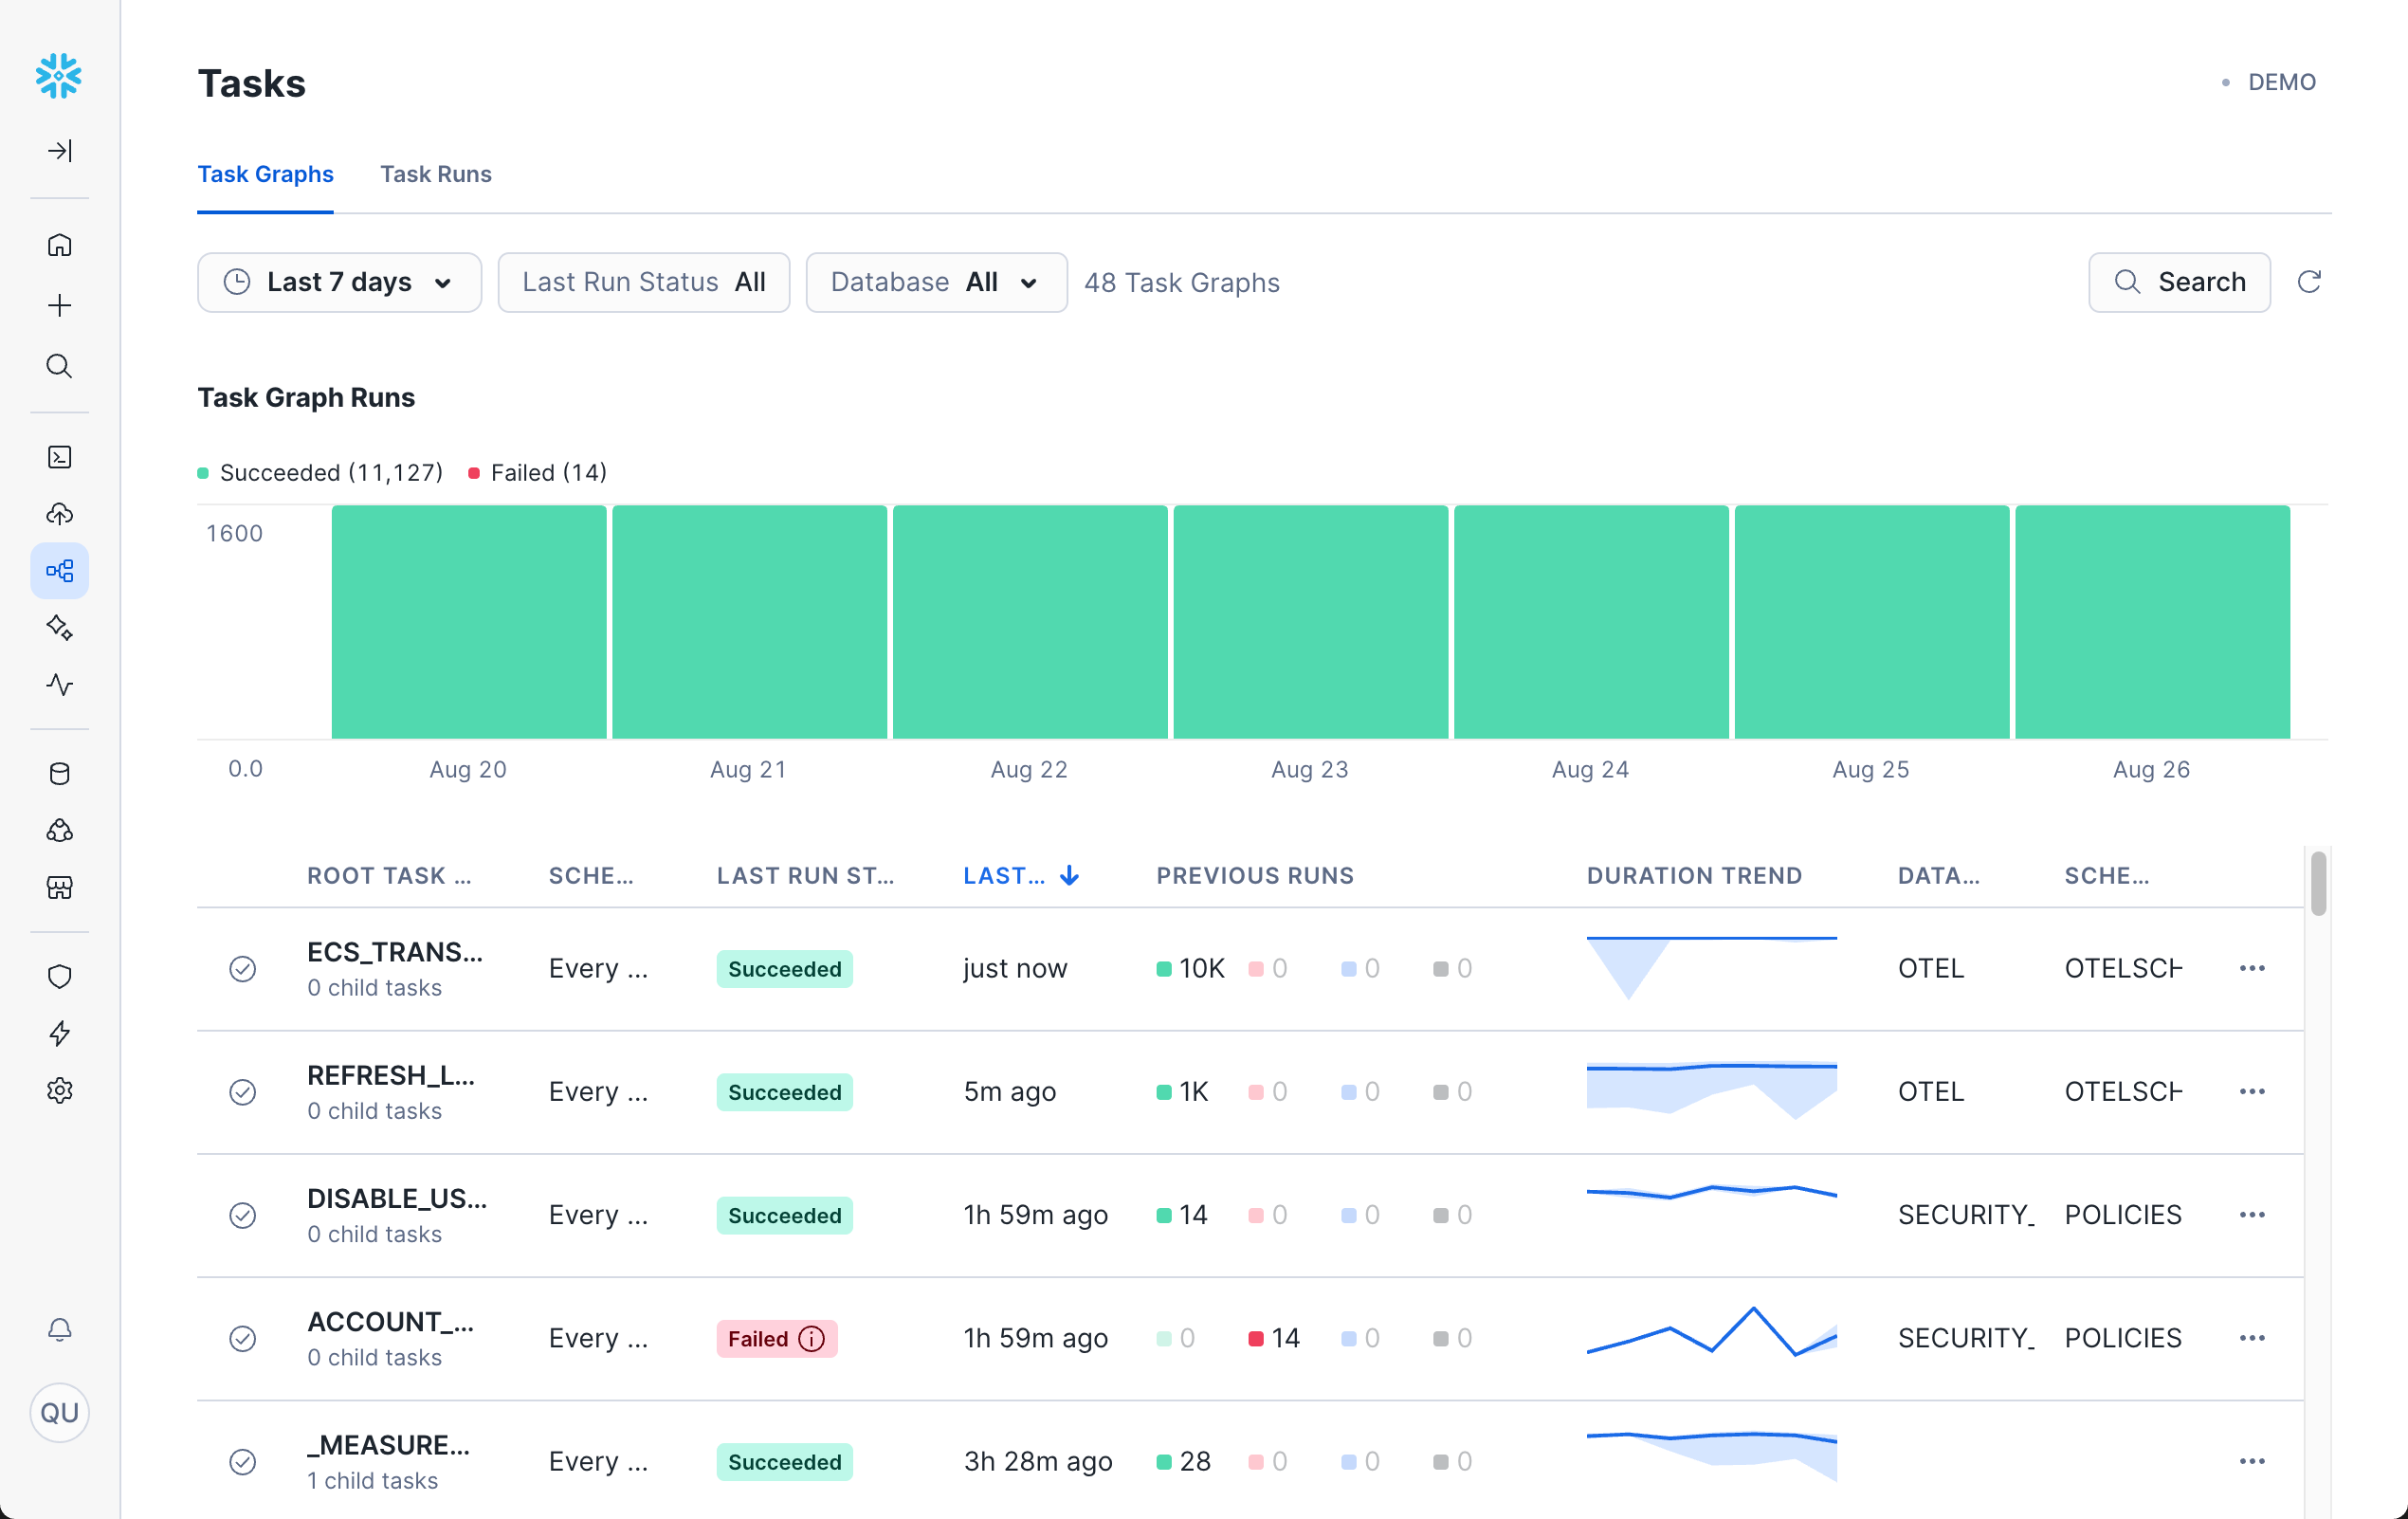
Click on any task execution to see detailed information including child task names, status, duration, and more. The real value of this is to be able to see dependencies between different tasks.
Tasks Runs
The Tasks Runs view shows individual task executions without grouping by parent task.
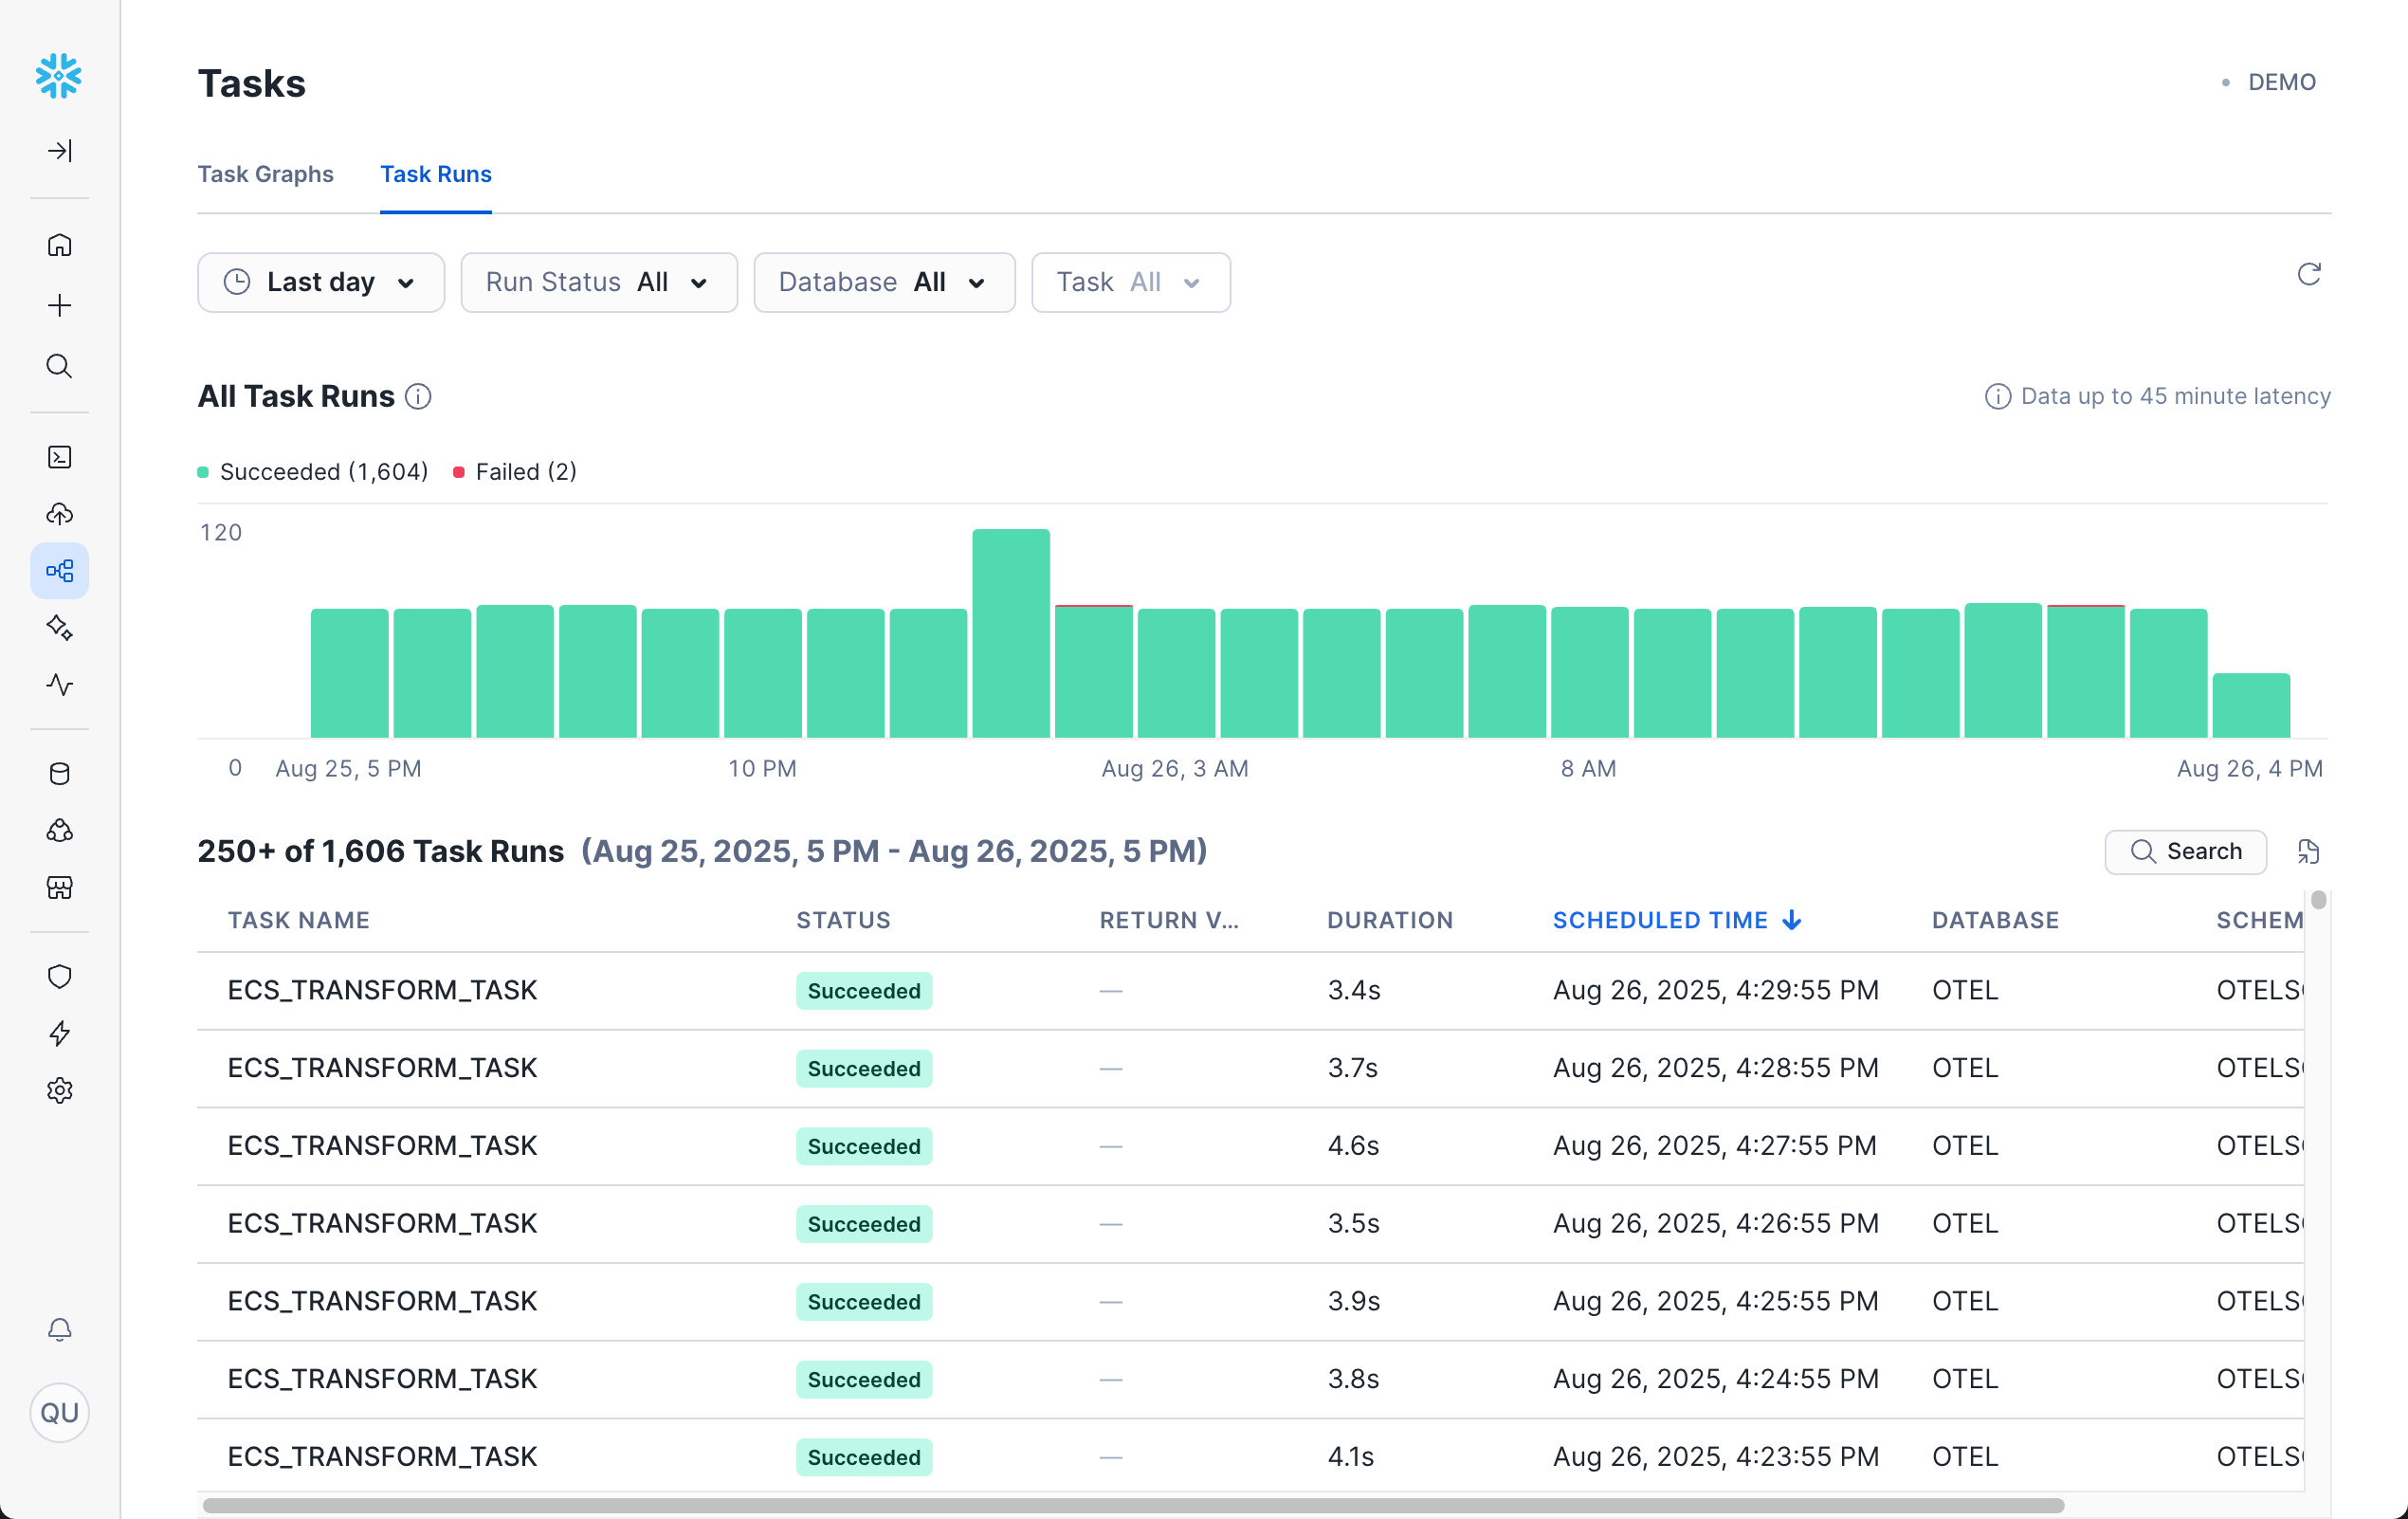
Clicking into any task run will bring you to the Run History for that task.
If you don't see any task history, you'll need to create and run some tasks.
For a step-by-step guide with examples, try one of these quickstarts:
Additional Resources
Dynamic Tables
Dynamic Tables are a table type that automatically materializes the results of a query and keeps them updated as the underlying data changes. They combine the simplicity of views with the performance of materialized data, automatically managing refresh operations. Dynamic Tables monitoring helps you track refresh performance, data freshness, and resource usage.
Why Dynamic Tables Monitoring Is Useful
Dynamic Tables monitoring helps you:
- Track refresh performance and identify optimization opportunities
- Monitor data freshness and lag times
- Analyze resource consumption for materialized views
- Troubleshoot refresh failures and dependency issues
- Optimize refresh strategies and warehouse sizing
- Ensure data pipeline reliability and performance
Accessing Dynamic Tables in Snowsight
To view Dynamic Tables monitoring in Snowsight:
- Navigate to Transformation » Dynamic Tables
- (Optional) Use the filters to narrow down by refresh status and database.
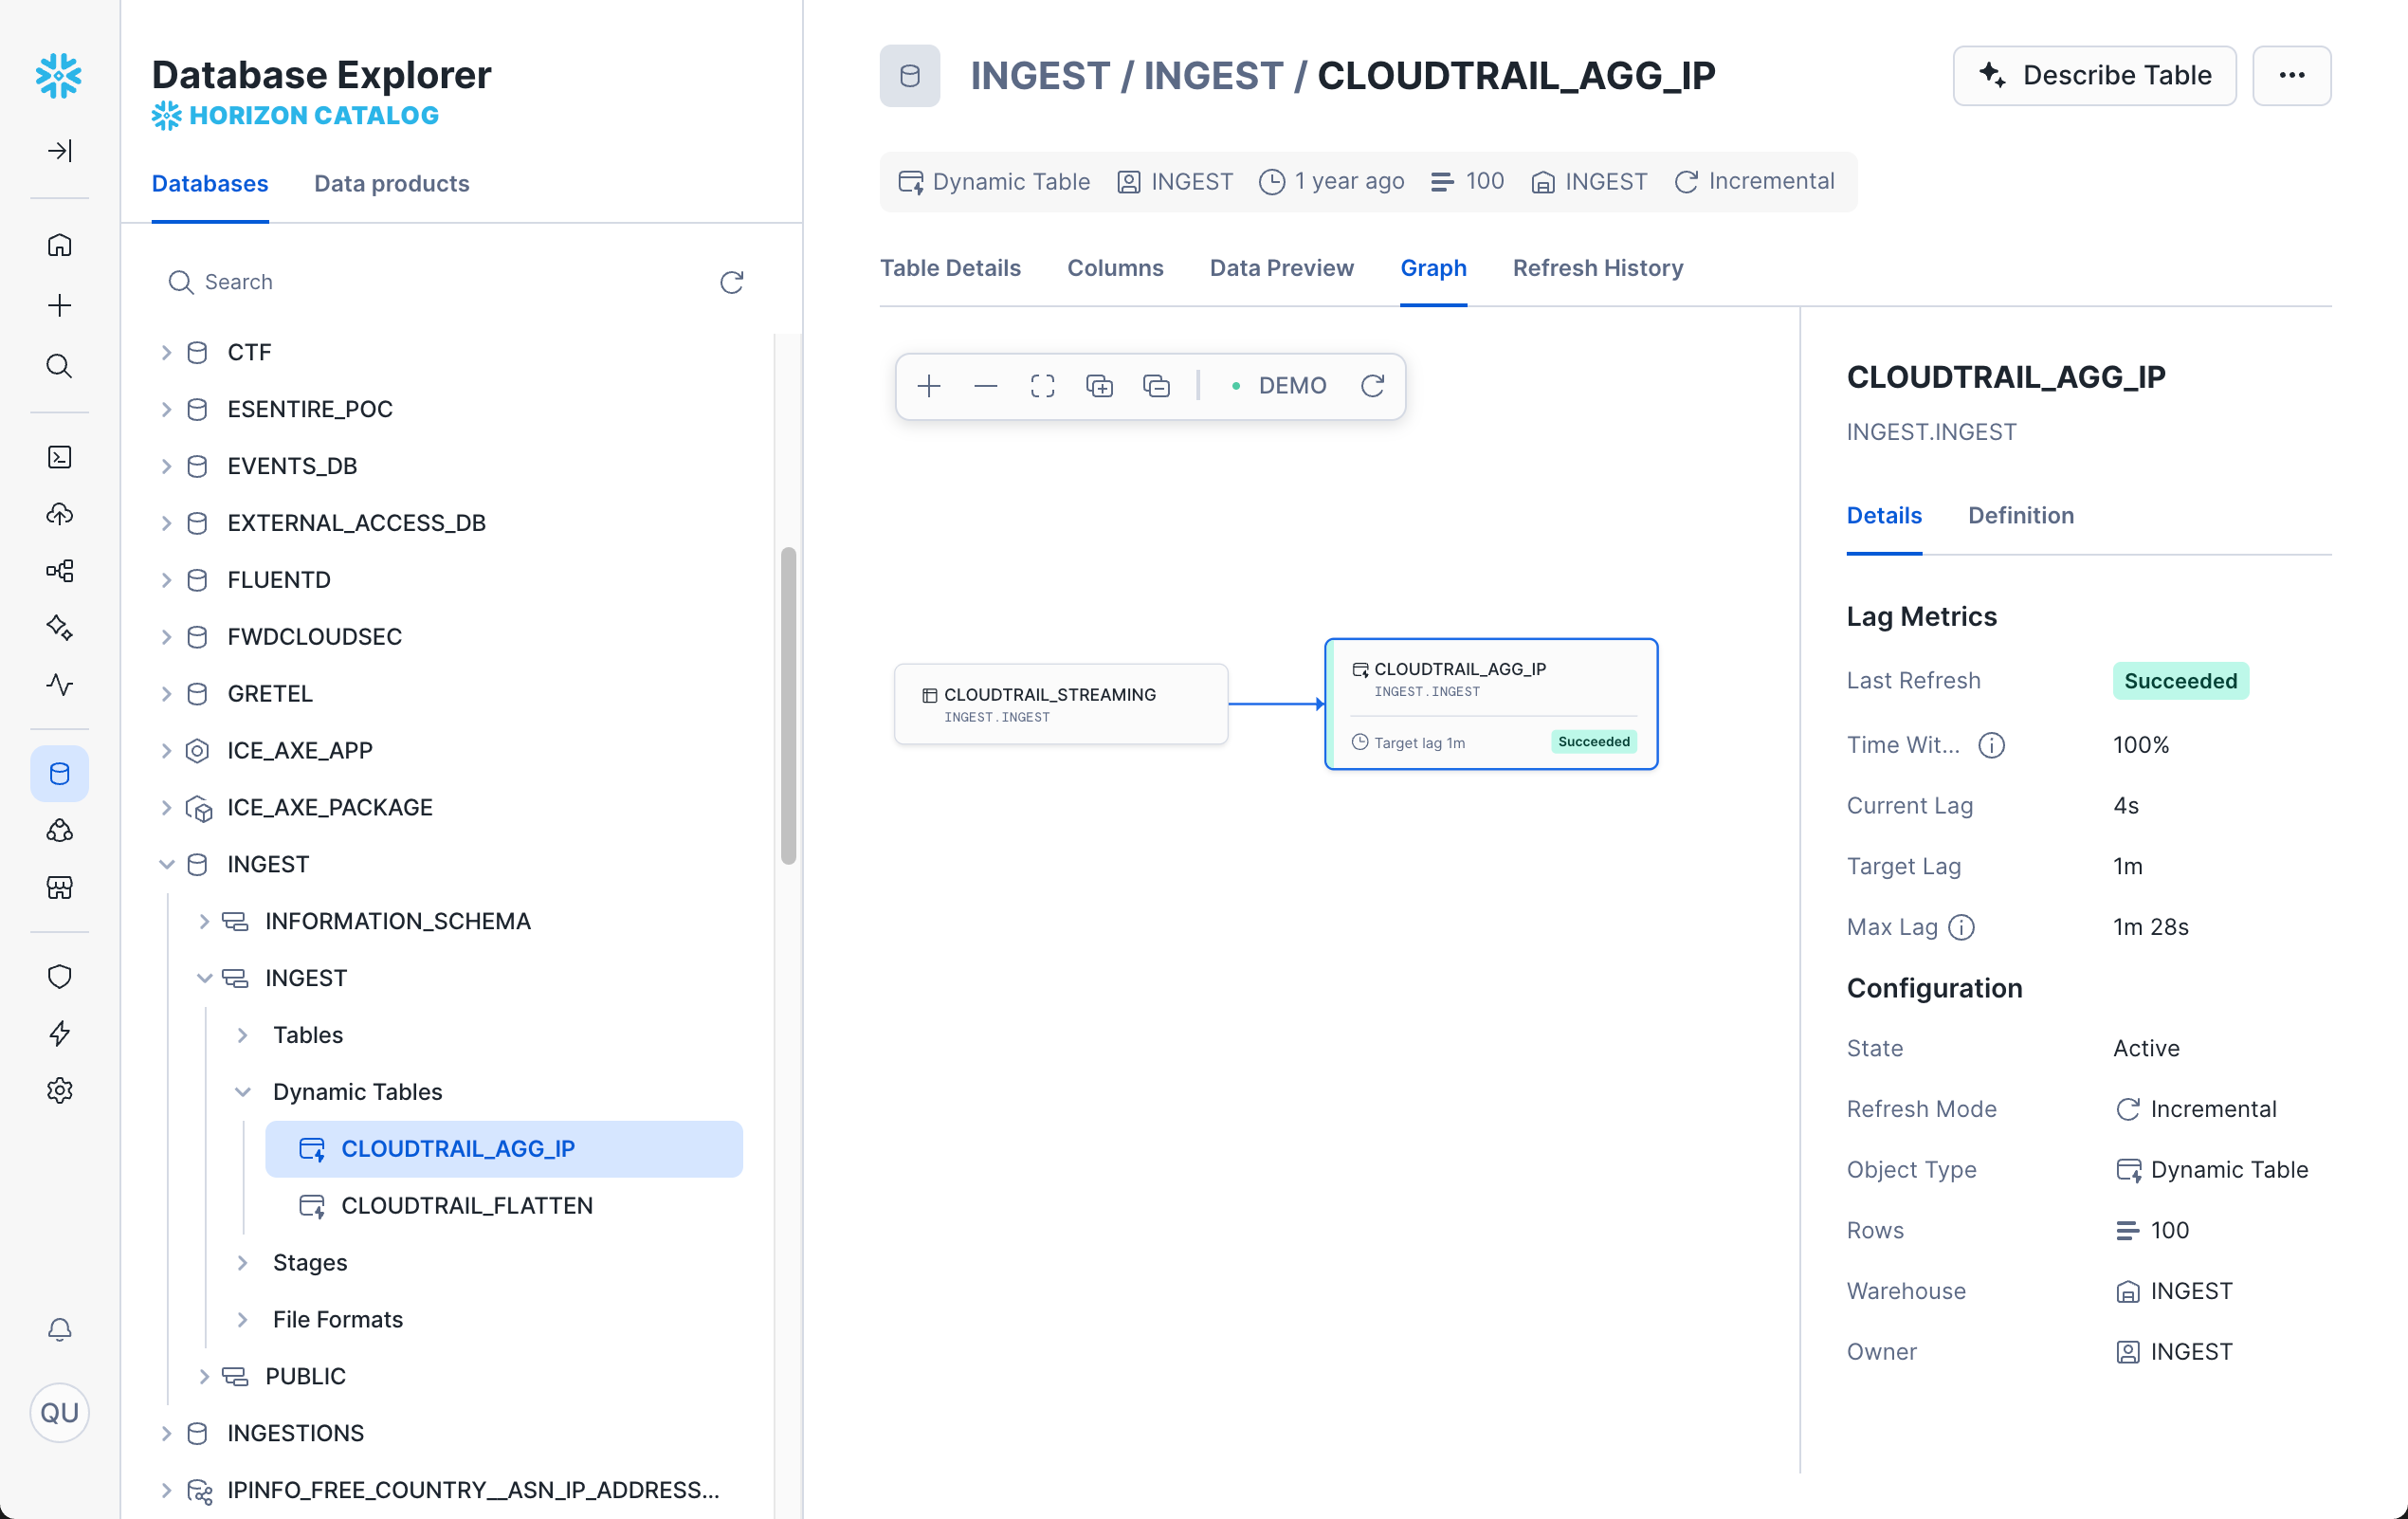
Dynamic Table Refreshes
For each Dynamic Table, we get info such as status, target lag, database, and more.
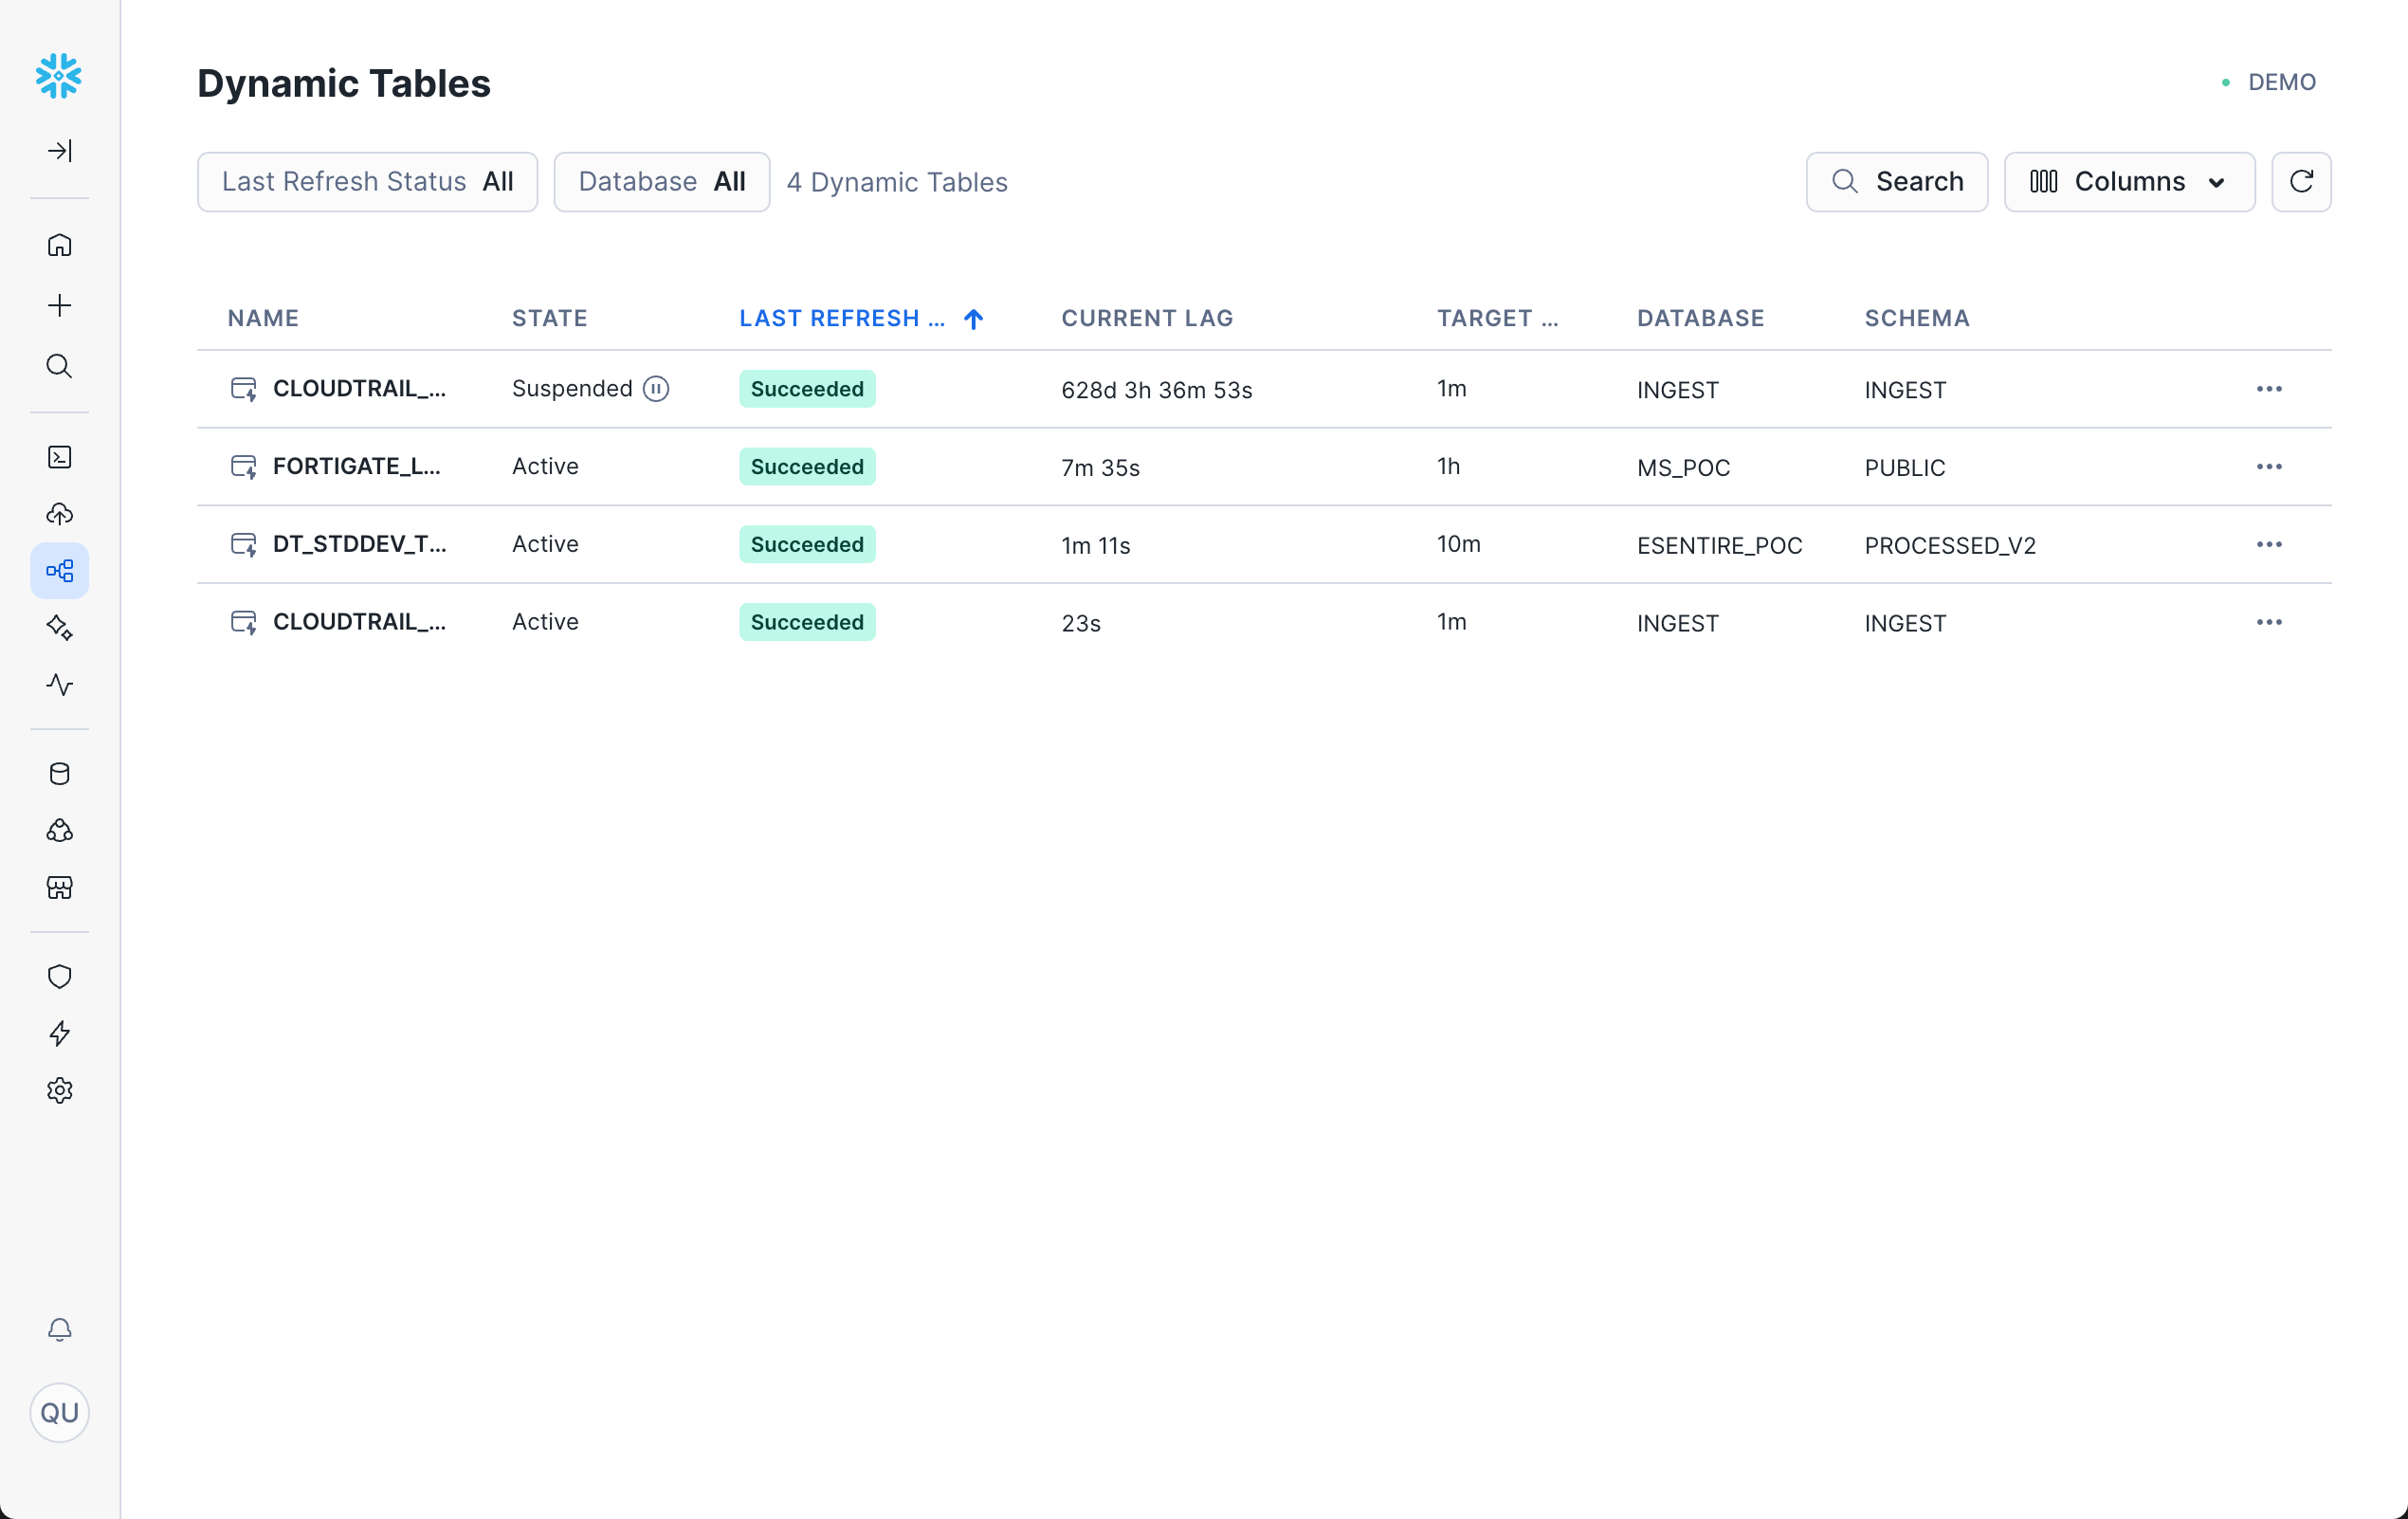
Clicking on any table will bring you to the graph view for that table.
If you don't see any Dynamic Tables, you'll need to create one first.
For a step-by-step guide, try this quickstart: Getting Started with Snowflake Dynamic Tables.
Additional Resources
AI Observability
AI Observability in Snowflake provides monitoring and insights for AI/ML workloads, including Cortex AI functions and model inference operations. As AI becomes increasingly integrated into data workflows, observability helps ensure AI operations are performing reliably and cost-effectively.
AI Observability has the following features:
- Evaluations: Use AI Observability to systematically evaluate the performance of your generative AI applications and agents using the LLM-as-a-judge technique. You can use metrics, such as accuracy, latency, usage, and cost, to quickly iterate on your application configurations and optimize performance.
- Comparison: Compare multiple evaluations side by side and assess the quality and accuracy of responses. You can analyze the responses across different LLMs, prompts, and inference configurations to identify the best configuration for production deployments.
- Tracing: Trace every step of application executions across input prompts, retrieved context, tool use, and LLM inference. Use it to debug individual records and refine the app for accuracy, latency, and cost.
Additional Resources
Conclusion And Resources
Congratulations! You have successfully explored the comprehensive observability capabilities available in Snowflake Trail. By following this quickstart, you've gained hands-on experience with the key components that make up Snowflake's observability platform.
What You Learned
Through this quickstart, you have learned how to:
- Enabled telemetry collection at the account level to start capturing logs, metrics, and traces
- Know the difference between System Views (historical data) and Telemetry data (event-driven observability)
- Utilize traces to gain end-to-end insight of execution flows and identify performance bottlenecks
- Analyze logs to debug issues and monitor application behavior
- Leverage Query History to optimize query performance and troubleshoot database operations
- Monitor data loading activities through Copy History for all ingestion methods
- Track automated operations using Task History for pipeline monitoring
- Observe Dynamic Tables refresh patterns and data freshness
- Explore AI observability concepts for monitoring AI/ML workloads and Cortex AI functions
- Build a foundational understanding of the tools available for observability across your Snowflake workloads
Possible Next Steps
Now that you have explored the basics of Snowflake Trail, consider these possible next steps:
- Configure alerts and notifications based on the telemetry data you're now collecting
- Integrate external observability tools such as Grafana, Observe for Snowflake, or Datadog
- Build custom dashboards for your specific monitoring needs using the observability data
- Implement automated monitoring workflows using Tasks and event-driven architectures
- Explore advanced observability patterns for your specific workload types
Related Resources
Core Documentation
Quickstart Guides
- Getting Started with AI Observability
- Getting Started with Event Tables and Alerts
- Getting Started with Snowflake Dynamic Tables
- Getting Started with Snowflake Task Graphs
- Getting Started with Snowpipe Streaming and Azure Event Hubs
- Getting Started with Snowpipe
- Getting Started with Streams & Tasks
- Getting Started with Traces
This content is provided as is, and is not maintained on an ongoing basis. It may be out of date with current Snowflake instances