
How do you create a powerful risk management portal to consolidate siloed structured, and semi-structured data into a single, flexible source of real-time risk information for interactive analytics?
USEReady’s Managing Director Jim Houghton and BI Analyst Rashmi Shettigar review lessons learned since the global financial crisis and identify the demands of today’s investment risk managers. They explain how risk managers can benefit from a single source of critical, data-driven insights delivered at the speed of business to make decisions across multiple investment portfolios and funds. USEReady is an analytics consulting firm based in New York.
Lessons Learned from Outdated Risk Management Analytics
The 2008 global financial crisis revealed the following:
- Misguided compensation structures encourage excessive risk-taking.
- Risk management functions should not be isolated from the investment process.
- Standard risk metrics can discount the probability or possibility of adverse tail events.
- Risk models need to be enhanced to handle increasingly complex new instruments.
- Real-time risk analytics are needed to show daily and consolidated activity to provide easy insights into sources of concentrated risk.
“Real-time analytics, the speed at which you can see your exposures, is critical,” Jim said. “The velocity of trading throughout the day due to computer trading and algorithms means that if you wait for overnight batch systems, which is what many risk systems used in 2008, you aren’t getting what you need in time. Speeding the consolidation of risk exposures is a must in today’s environment.”
What Modern Risk Managers Need
It’s not a mystery that today’s investment risk managers seek critical analytics and decision-support information in real time. They need it to influence trade decisions and prevent or minimize adverse outcomes. According to Jim and Rashmi, risk managers want the following:
- Comprehensive risk measures presented across their portfolios
- Real-time updates
- Insights that cut across data silos and multiple legacy systems
- An easy-to-understand and customizable portal
Achieving this level of insight, at the necessary velocity, requires a risk manager portal that breaks the conventional mold. To achieve this, it should harness the advantages offered by a cloud-built data warehouse that can easily load, transform and integrate both structured and semi-structured data. In addition, it should have security baked into the solution for a zero-management experience.
Security is baked into Snowflake, the data warehouse built for the cloud, enabling the strictest corporate security standards: SOC 2 Type 2, PCI DSS, HIPAA, NIST 800-53 Tier 3, and CIS Critical Security Controls. In addition, customers may choose from five Snowflake editions that provide increasing levels of security, including the highest level, Virtual Private Snowflake (VPS), a dedicated instance of Snowflake running in a separate Virtual Private Cloud.
A Peek into the Portal
The risk manager portal demonstrated by USEReady was built using Snowflake and the Tableau business intelligence and data visualization solution. Figure 1 shows the main screen of this portal. In this example, eight boxes are presented, each offering a different function or view of data and information important to risk manager Jennifer Hughes. These widgets allow direct access to interactive Tableau dashboards and other corporate information sources, which are flexible and customizable depending on your needs.
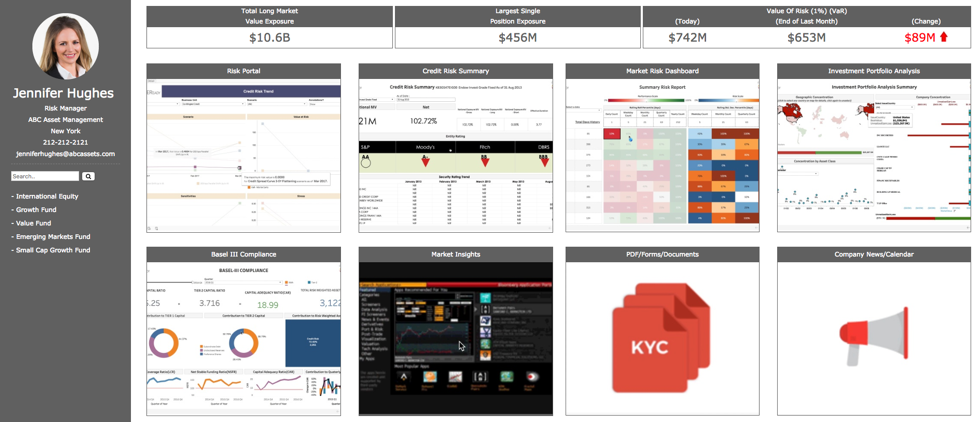
The portal’s performance is virtually unlimited due to Snowflake’s multi-cluster, shared-data architecture that separates storage and computes resources. This makes it possible to scale up and down, automatically or on the fly, without disruption. Tableau-powered widgets generate easy-to-understand dashboards that provide deep dives into critical risk analysis features.
Any risk manager can query structured and semi-structured data while it’s loading into Snowflake without degrading performance and start finding answers in seconds. Specific workloads, such as reporting dashboards, can use their own virtual data warehouse (compute cluster), ensuring reliable performance independent of other activity on the data warehouse.
In Figure 2, Jennifer has drilled down into the Investment Portfolio Analysis Summary widget to discover that a losing position in the United States is concentrated in three or four U.S. stocks, which can allow Jennifer to take further action.

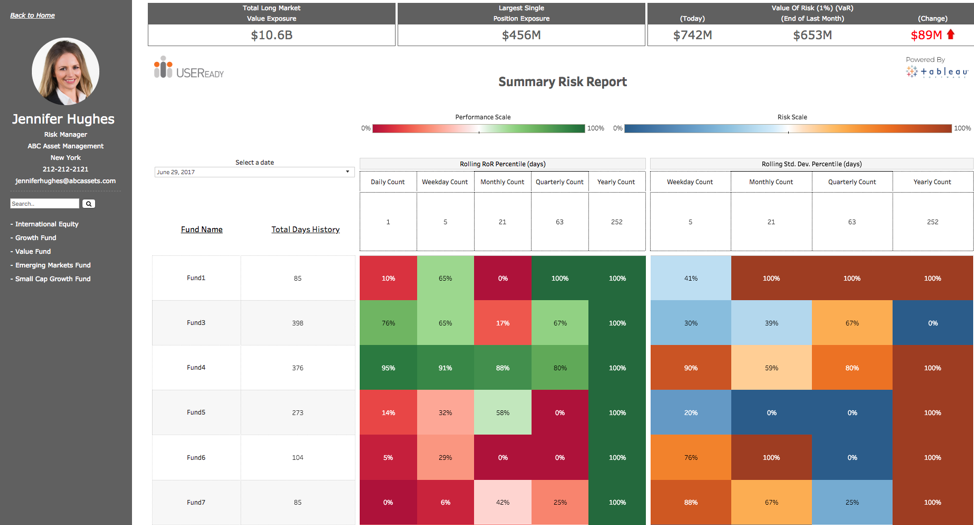
In Figure 3, Jennifer has switched to a heat map that shows statistics for each of her funds over daily, weekly, monthly, quarterly and annual time frames. The range of colors helps her quickly identify areas of risk that need attention.
Data Warehouse as a Service
One of the many benefits of this risk manager portal is that Snowflake’s patented technology can natively load and optimize both structured and semi-structured data— JSON, Avro, or XML—and make it available via SQL without sacrificing performance or flexibility.
Figure 4 highlights the key elements underlying the risk portal architecture. It includes the data procurement layer that draws in multiple financial and risk data sources of structured and semi-structured data. Multiple transformations were performed on this data as it was moved to the second tier, which is the cloud-built Snowflake data warehouse.

“Once the data model design was completed, we built the database schema and its tables in Snowflake, using the online Snowflake development client,” Rashmi said. “We didn’t have to worry too much about capacity planning in terms of setting up infrastructure or hardware for the data warehouse. The learning curve involved was very small.”
Regarding Tableau, “Our third tier was reporting and analysis, and here is where we used Tableau desktop as our reporting platform to build the dashboards,” Rashmi said. “The Tableau connector allowed us to easily and seamlessly connect to our Snowflake data warehouse.”
Meeting the Needs of Today’s Risk Managers
Here’s where the combination of Snowflake and Tableau really pays off. There’s so much you won’t need to do when you use Snowflake and Tableau for risk management and analytics. You don’t have to worry about optimizing data partitioning or workload management. Snowflake handles that automatically.
Snowflake automatically scales instantly and infinitely, and up and down, to meet your needs. There’s no massive upfront investments in hardware and software and you pay by the second.
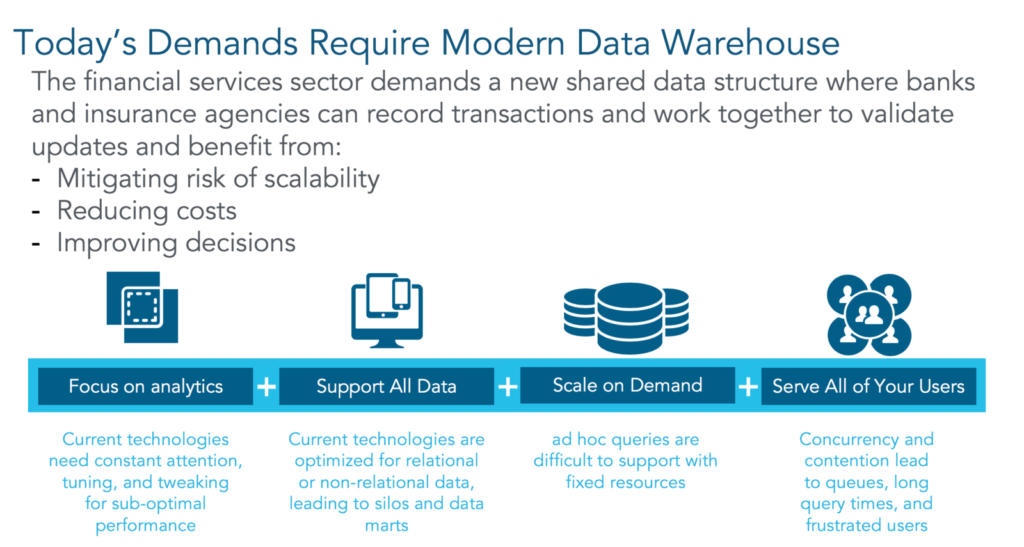
As shown in Figure 5, with Snowflake and Tableau, the focus is on analytics, support for all your data, scalability on demand, and service for all of your users.
“Snowflake has tremendously improved our execution time,” Rashmi said. “Because Snowflake is a cloud platform, we can directly go ahead with development activities without having to worry about setting up infrastructure or capacity planning. That helped reduce development time greatly.”
What About the Cloud?
Jim notes, “When I was working for large banks 10 years ago, there was very much a view that data had to be on-premise and that was the only way that they could maintain security. Now, with the advent of truly mission-critical and secure cloud-based platforms, there’s a realization that it can be more cost-effective, and possibly even more secure, to use a cloud-based data strategy. There are definitely examples in the financial services industry where organizations are going in that direction.”
For more information, watch the recently hosted webinar, Trends and Tools for Faster Risk Assessment and Scenario Analysis.